

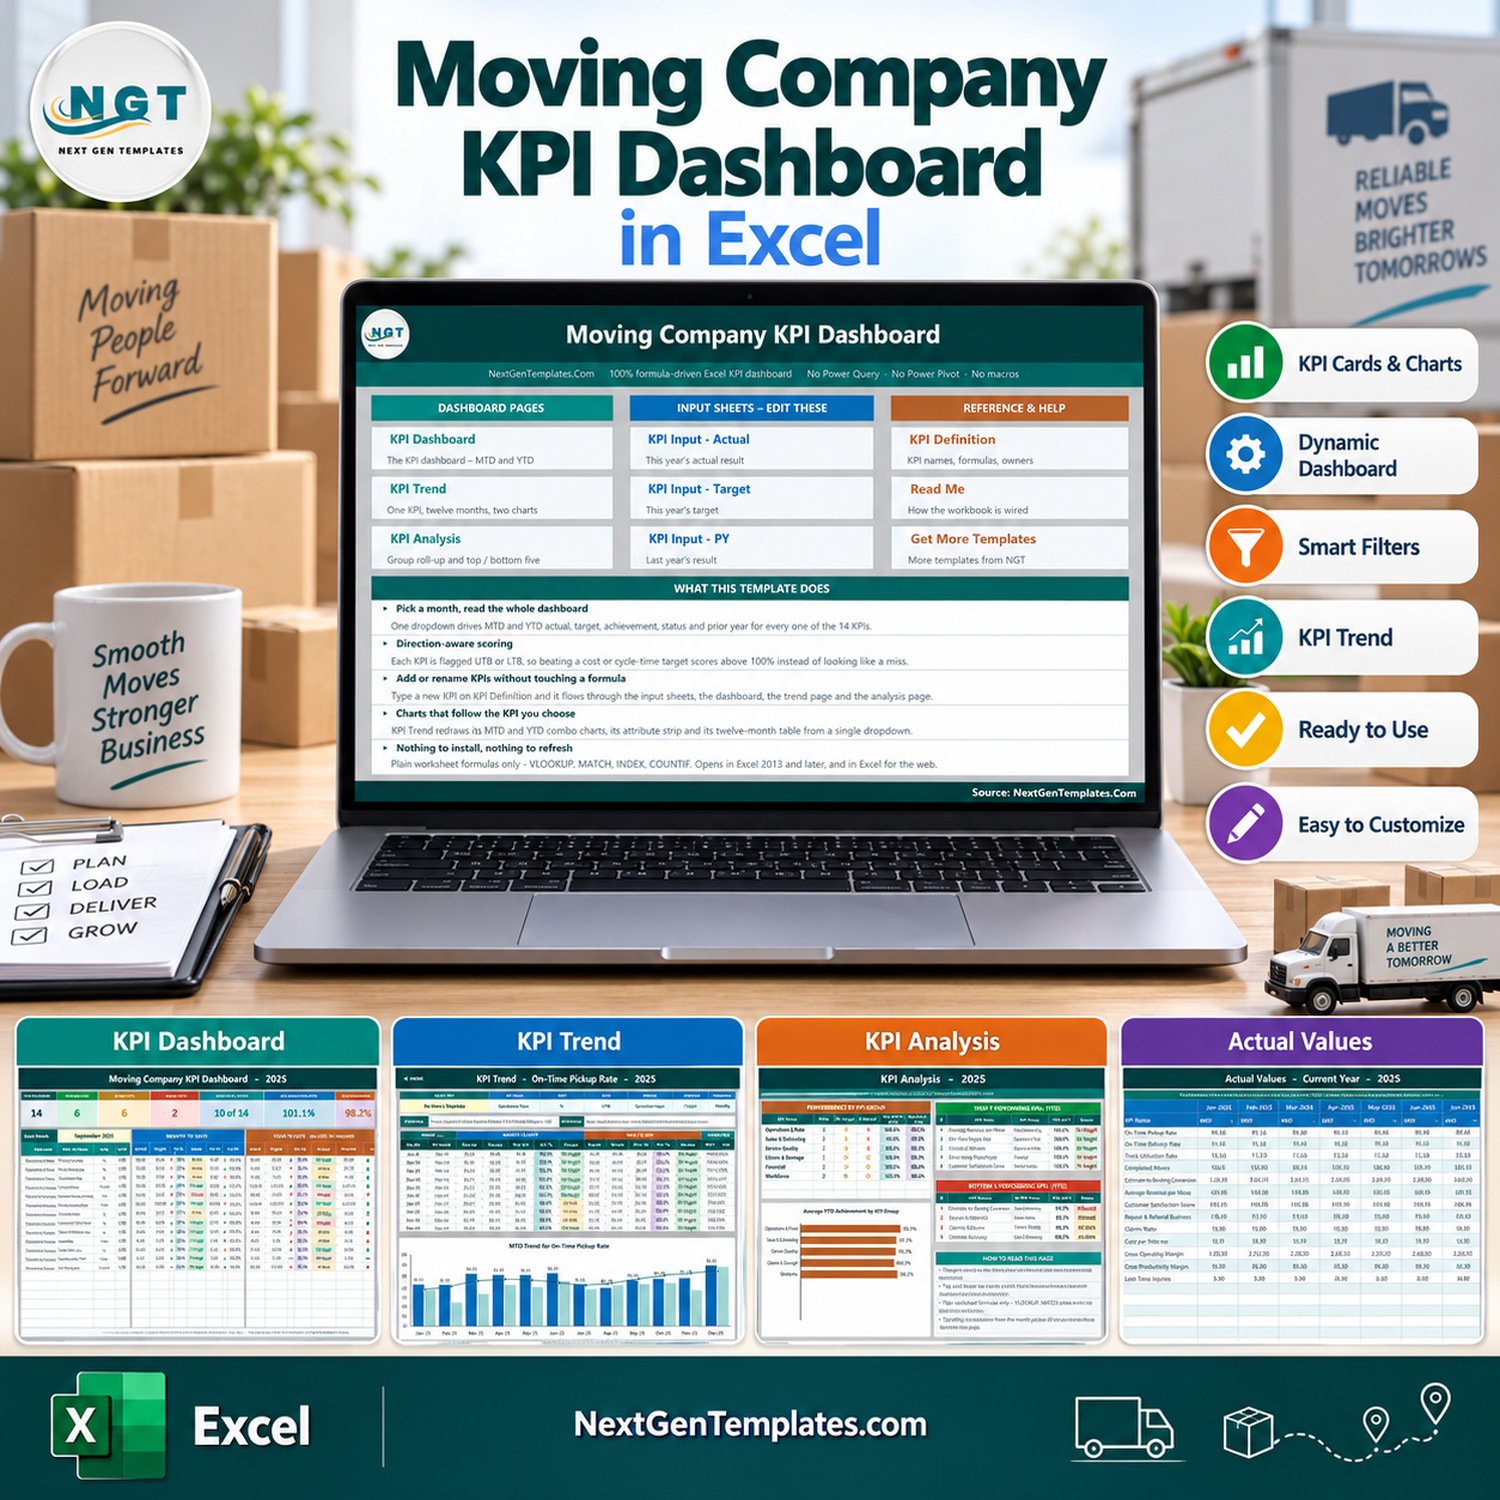
The Moving Company KPI Dashboard in Excel tracks 14 moving company KPIs across 6 groups, with MTD and YTD actual, target, achievement, traffic-light status and prior-year comparison for every KPI. One month dropdown drives the whole scorecard, a KPI Trend page charts any single KPI over twelve months, and a KPI Analysis page ranks the top five and bottom five KPIs for the year to date.
This listing is the Excel KPI Dashboard edition from the NextGenTemplates KPI dashboard family: a month picker, traffic lights, and dedicated KPI Trend and KPI Analysis pages. It is not our analytical Moving Company Dashboard in Excel, and it is not the Moving Company KPI Scorecard in Excel, which is a separate template family with its own card layout.
✅ Instant download · One-time payment · No subscription · No per-user fees · Lifetime access to the file
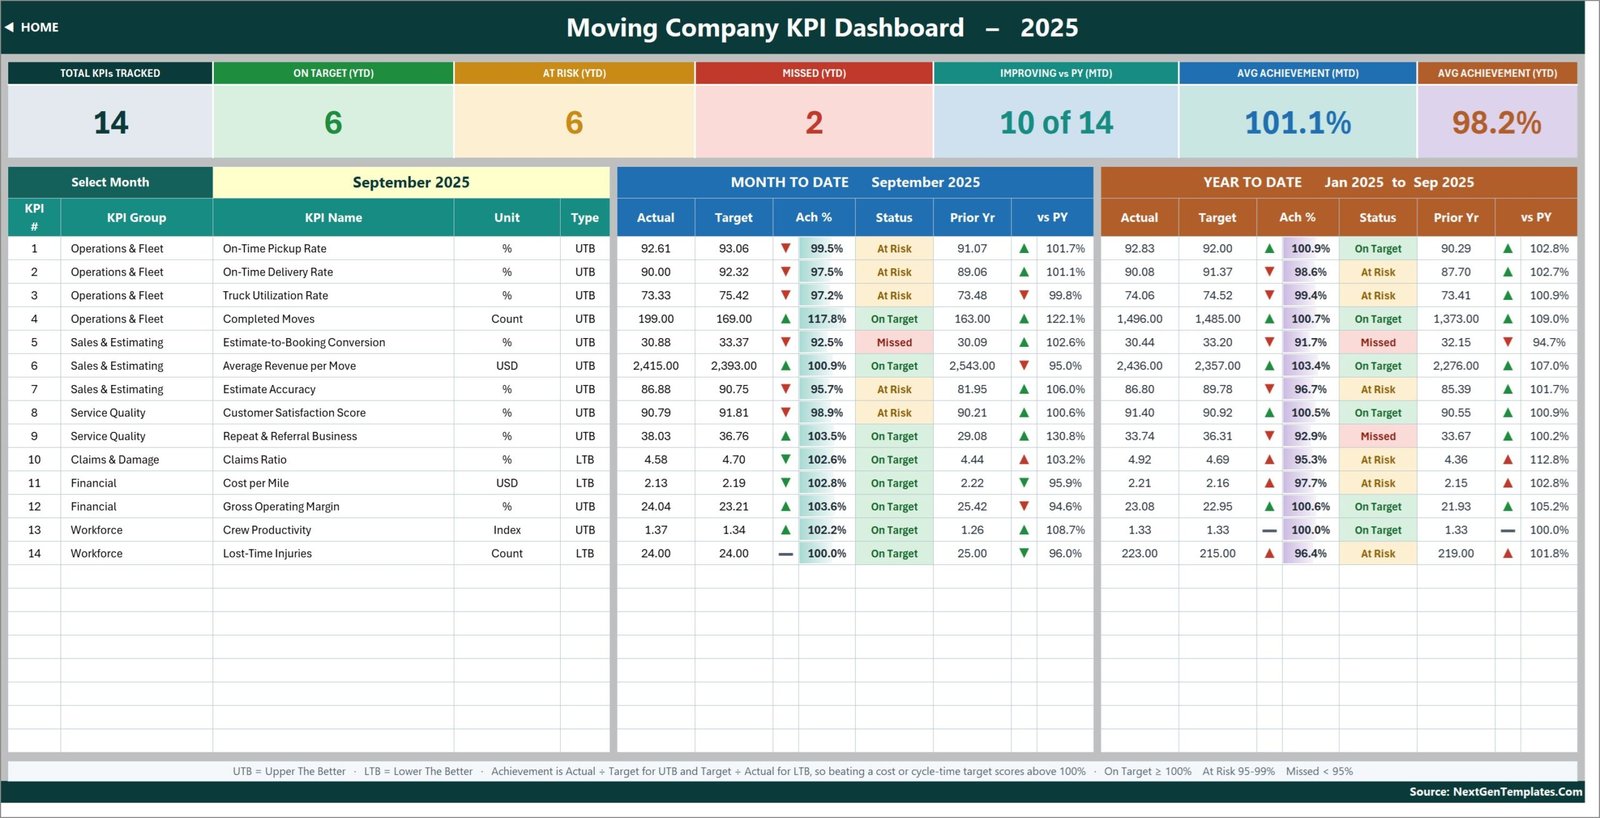
🔑 Key Features of the Moving Company KPI Dashboard
- 🚚 14 KPIs built for movers. The workbook ships with On-Time Pickup Rate, On-Time Delivery Rate, Truck Utilization Rate, Completed Moves, Estimate-to-Booking Conversion, Average Revenue per Move, Estimate Accuracy, Customer Satisfaction Score, Repeat & Referral Business, Claims Ratio, Cost per Mile, Gross Operating Margin, Crew Productivity and Lost-Time Injuries.
- 📅 One month picker for the whole workbook. Choose a month in cell D6 on the KPI Dashboard and every MTD figure, YTD figure, status light and summary card updates, along with the KPI Analysis page.
- ↕️ Direction-aware scoring. 11 KPIs are Upper The Better and 3 are Lower The Better: Claims Ratio, Cost per Mile and Lost-Time Injuries. Beating a claims, cost or injury target therefore scores above 100% instead of looking like a miss.
- 🚦 Traffic lights with clear thresholds. On Target from 100%, At Risk from 95% to 99%, Missed below 95%. The thresholds sit in plain formulas in columns L and U of the KPI Dashboard, so you can change them.
- 📊 Seven summary cards. Total KPIs Tracked, On Target, At Risk and Missed (YTD), Improving vs PY (MTD), and average achievement for MTD and YTD.
- ➕ Room for 22 KPIs. Add or rename a KPI on the KPI Definition sheet and it flows through the input sheets, the scorecard, the trend page and the analysis page without formula edits.
- 💻 No macros, no Power Query, no add-ins. Plain worksheet formulas such as VLOOKUP, INDEX, MATCH and COUNTIF. Opens in Excel 2013 and later, and in Excel for the web.
📦 What’s Inside the Moving Company KPI Workbook
The download is a ZIP holding the .xlsx workbook and the Excel KPI Dashboard User Manual PDF. The workbook has 11 sheets: Home, KPI Dashboard, KPI Trend, KPI Analysis, three input sheets, KPI Definition, a Support helper sheet, Read Me and Get More Templates.
Home
A navigation page with links to the three dashboard pages, the three input sheets and the reference sheets, plus a short summary of the five things the template does.
KPI Dashboard
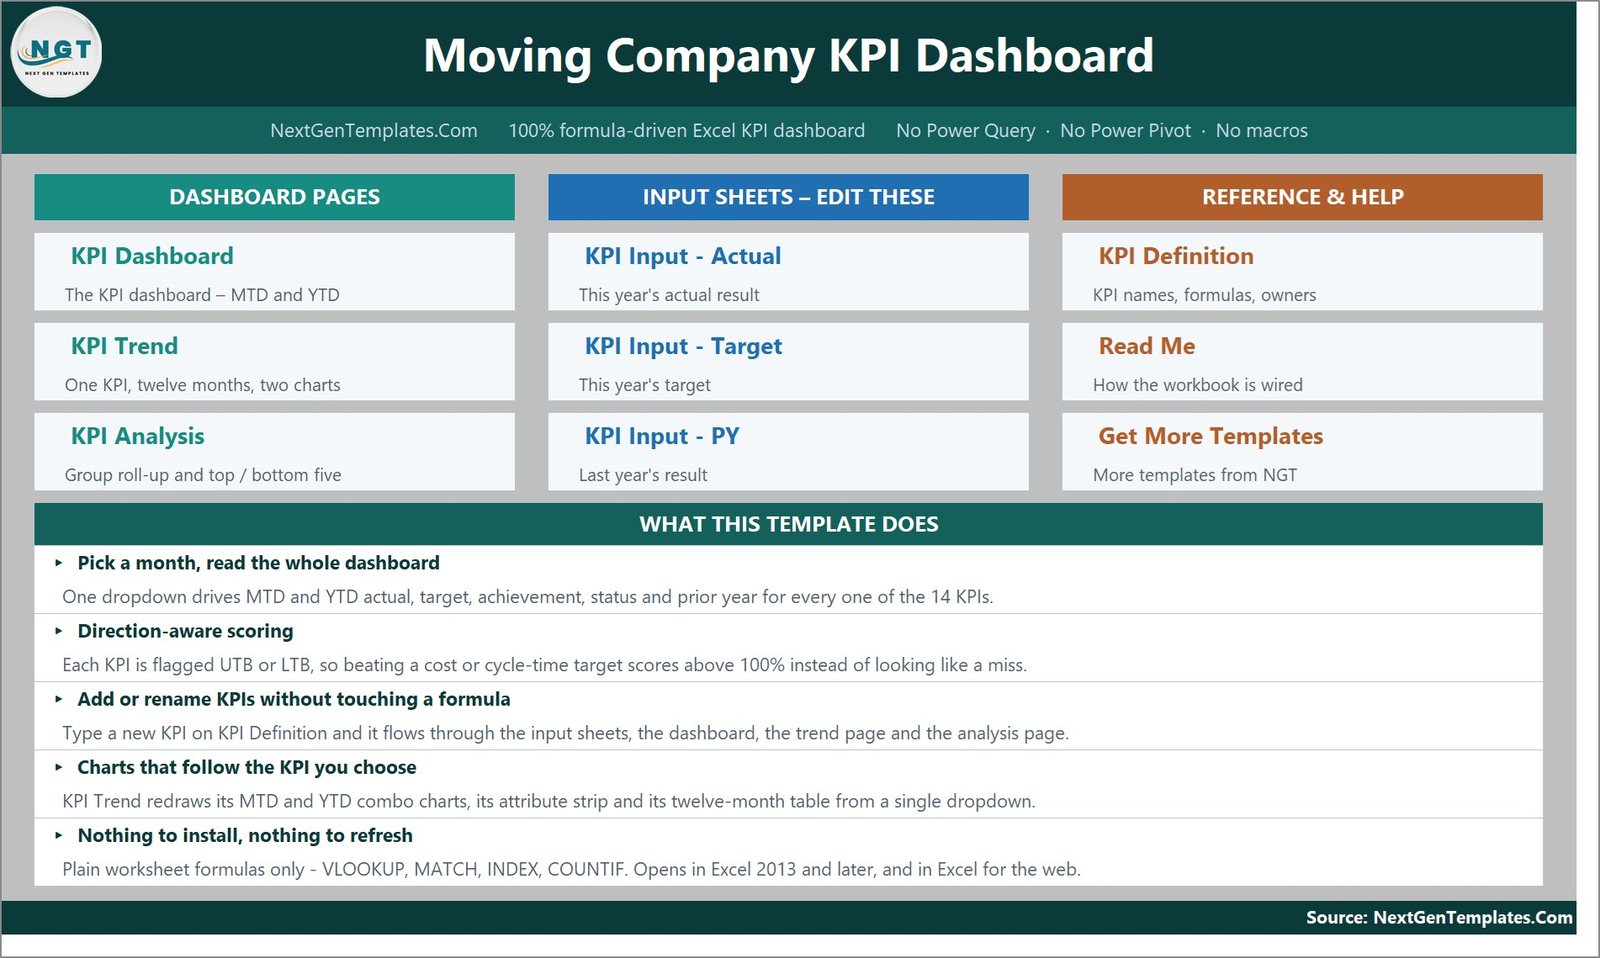
The main scorecard. With the September 2025 sample month selected, the cards read 14 KPIs tracked, 6 On Target, 6 At Risk and 2 Missed for the year to date, 10 of 14 improving against the prior year, and average achievement of 101.1% MTD and 98.2% YTD. Each KPI row shows group, unit, UTB/LTB type, and MTD and YTD actual, target, achievement %, status, prior year and vs PY. For example, Completed Moves reached 199 against a target of 169 and 163 last September, so it scores 117.8% On Target, while Estimate-to-Booking Conversion came in at 30.88% against a 33.37% target and is Missed at 92.5%.
KPI Trend
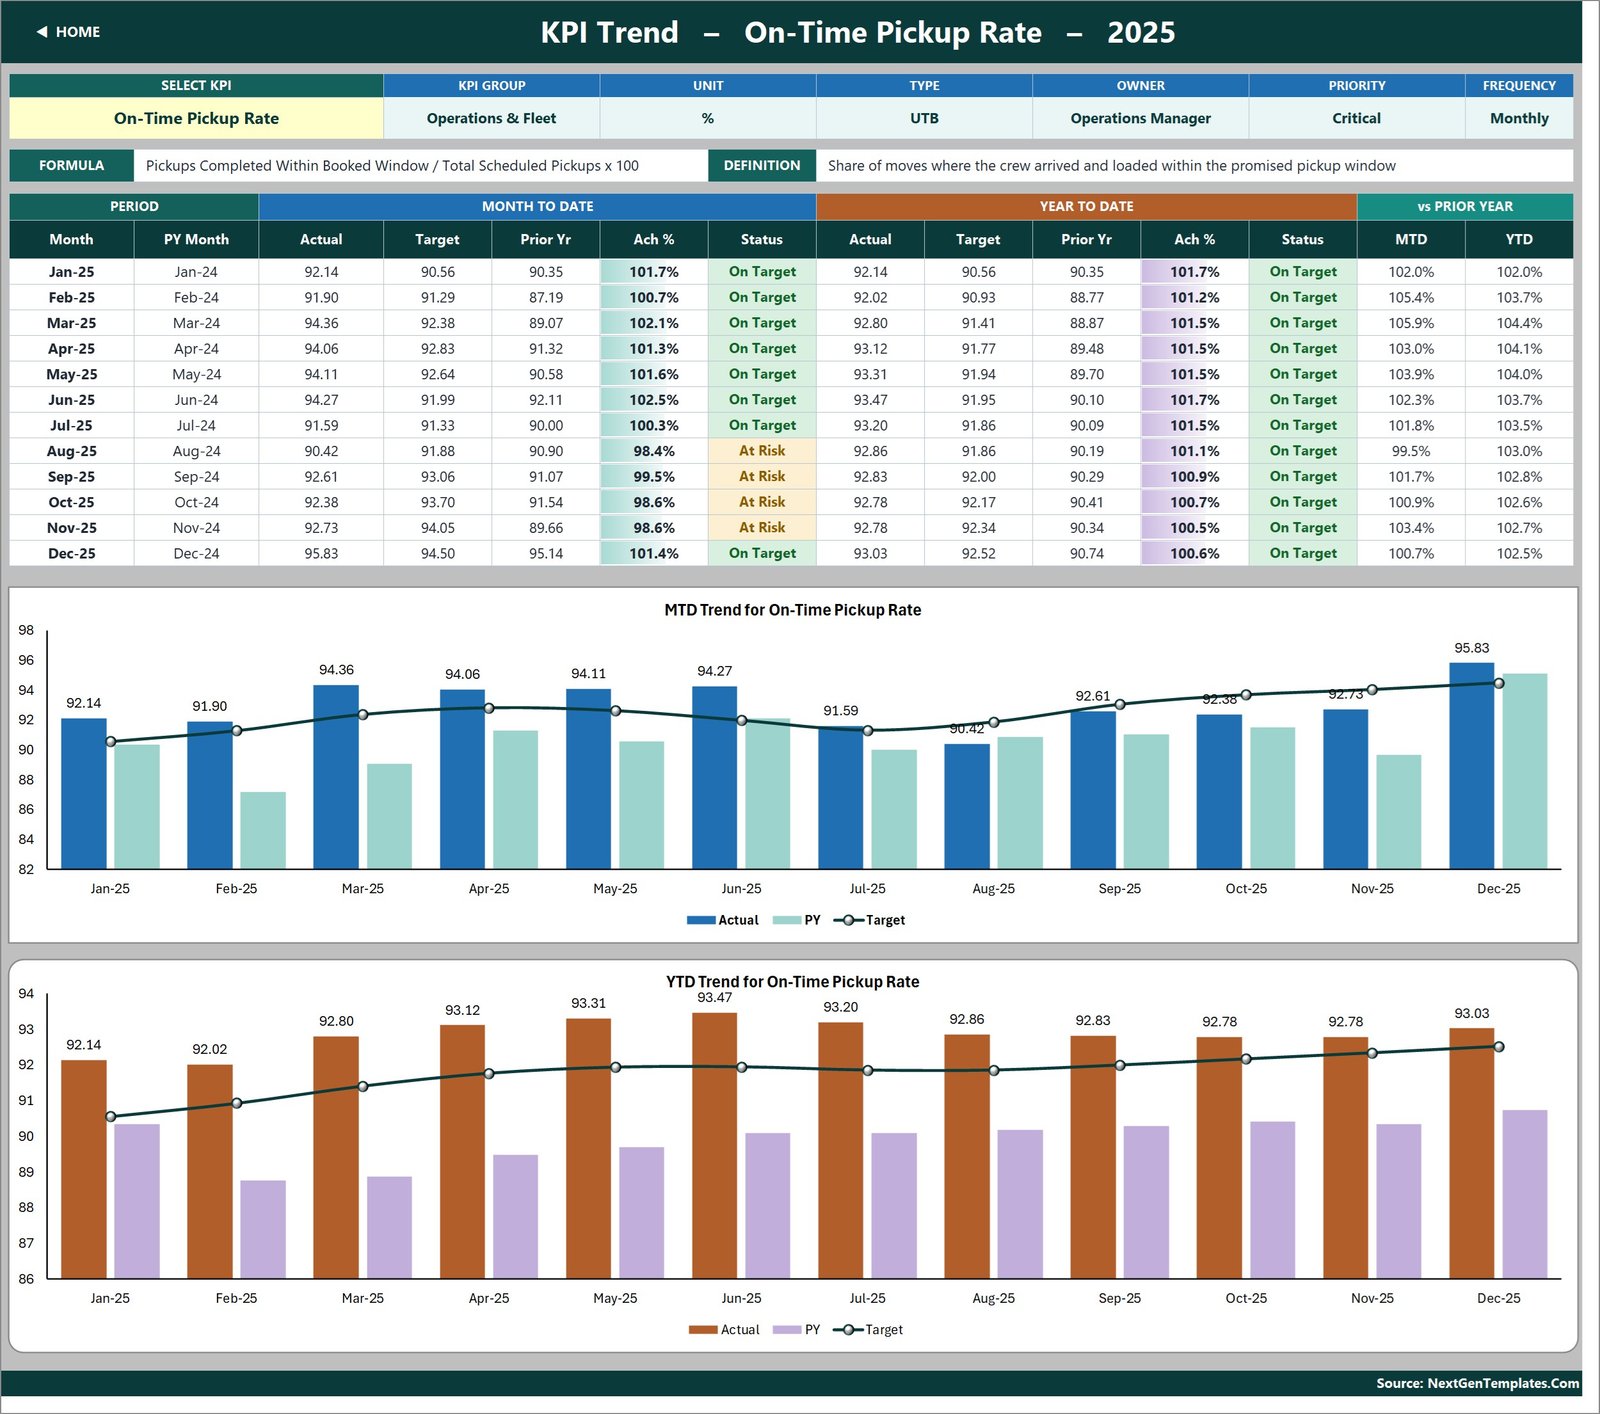
Pick any KPI in cell B4 to see its group, unit, type, owner, priority, frequency, formula and definition, a twelve-month table, and two combo charts: MTD Trend and YTD Trend, each with actual and prior-year columns and a target line. The sample shows On-Time Pickup Rate, owned by the Operations Manager, at 92.61% against 93.06% for September (At Risk) and 92.83% against 92.00% for the year to date (On Target).
KPI Analysis
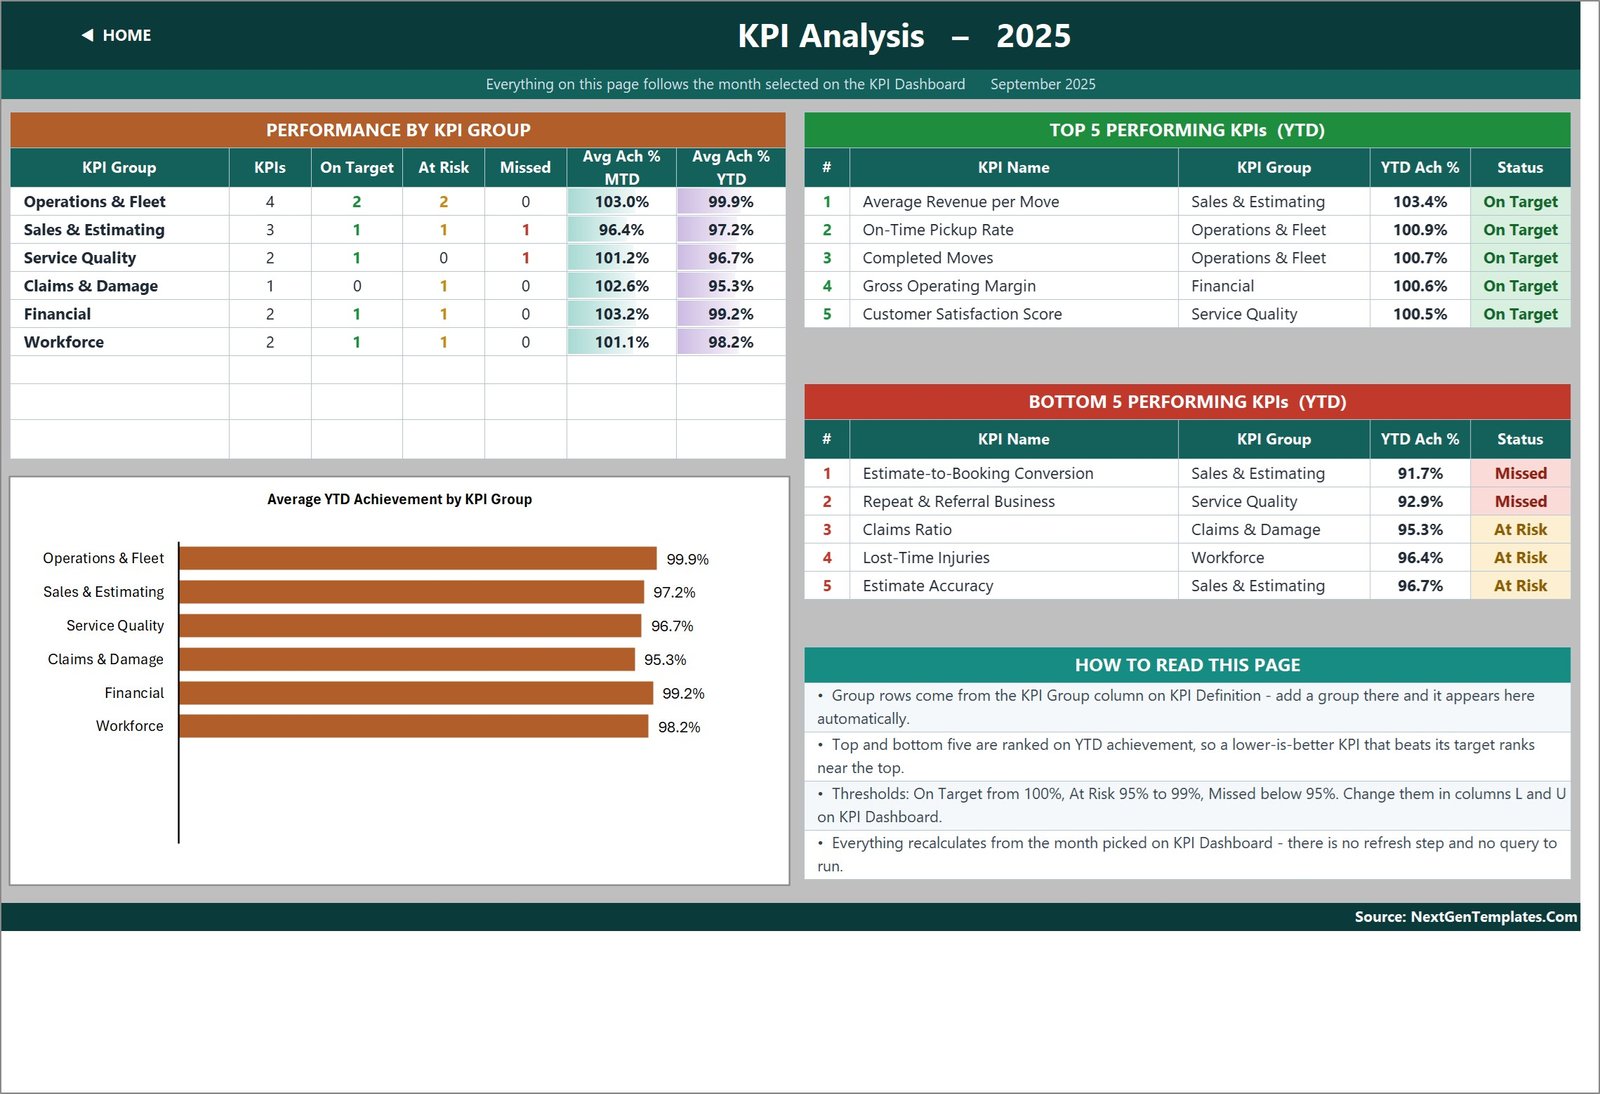
Performance by KPI Group lists each group’s KPI count, On Target, At Risk and Missed counts and average achievement for MTD and YTD, with an Average YTD Achievement by KPI Group bar chart. Beside it sit the Top 5 and Bottom 5 KPIs by YTD achievement. In the sample, Average Revenue per Move leads at 103.4%, while Estimate-to-Booking Conversion (91.7%) and Repeat & Referral Business (92.9%) are the two KPIs Missed.
KPI Input – Actual, Target and PY
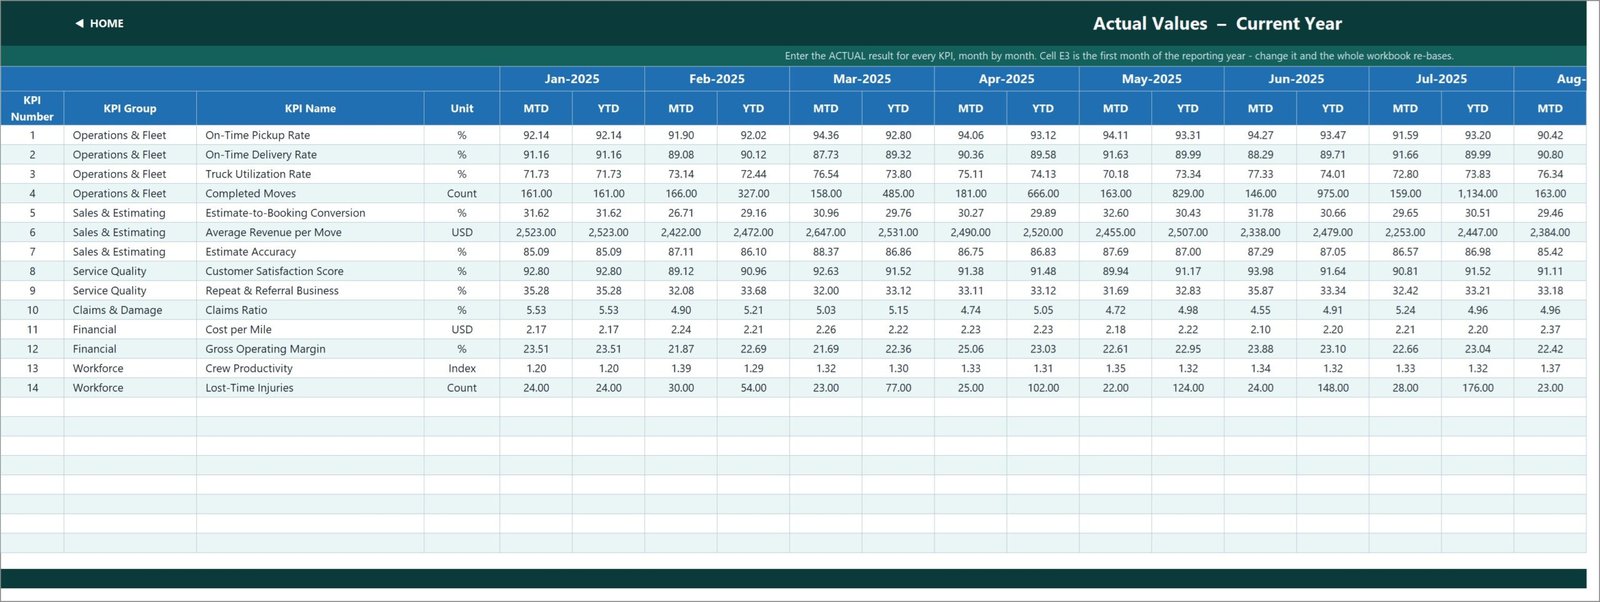
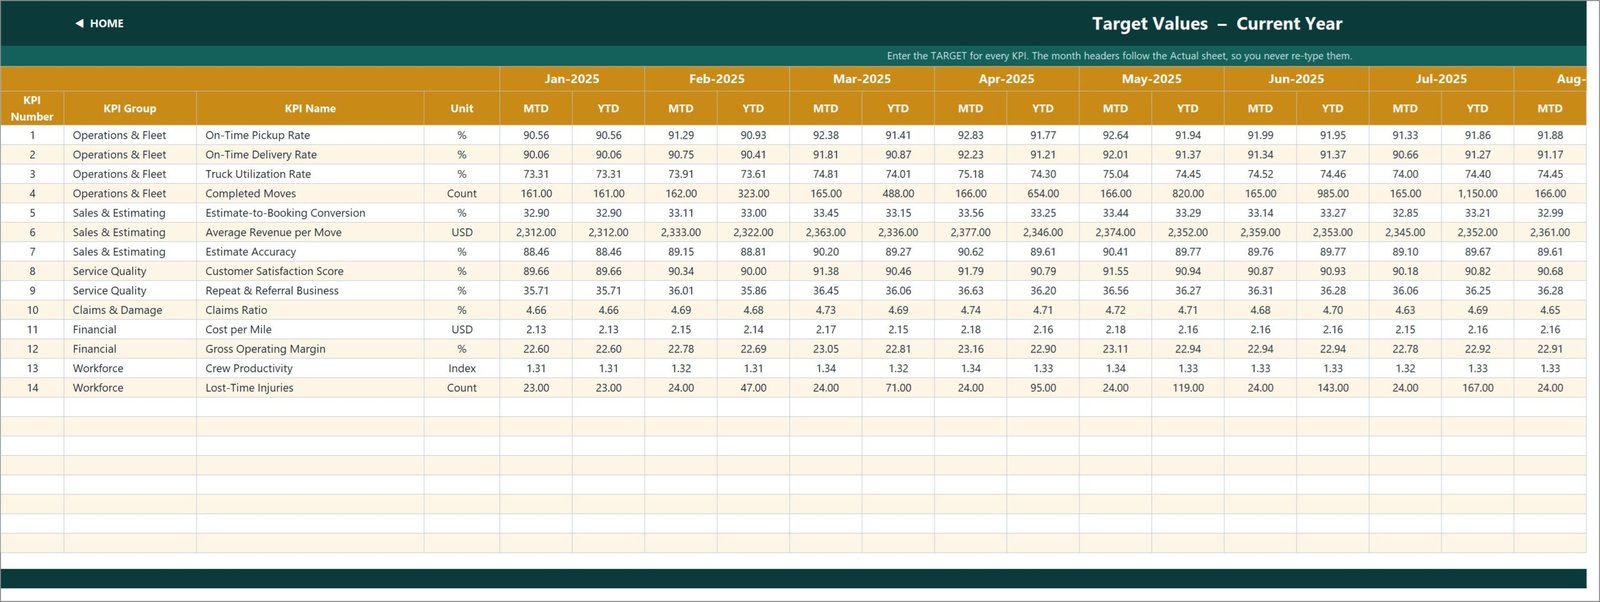
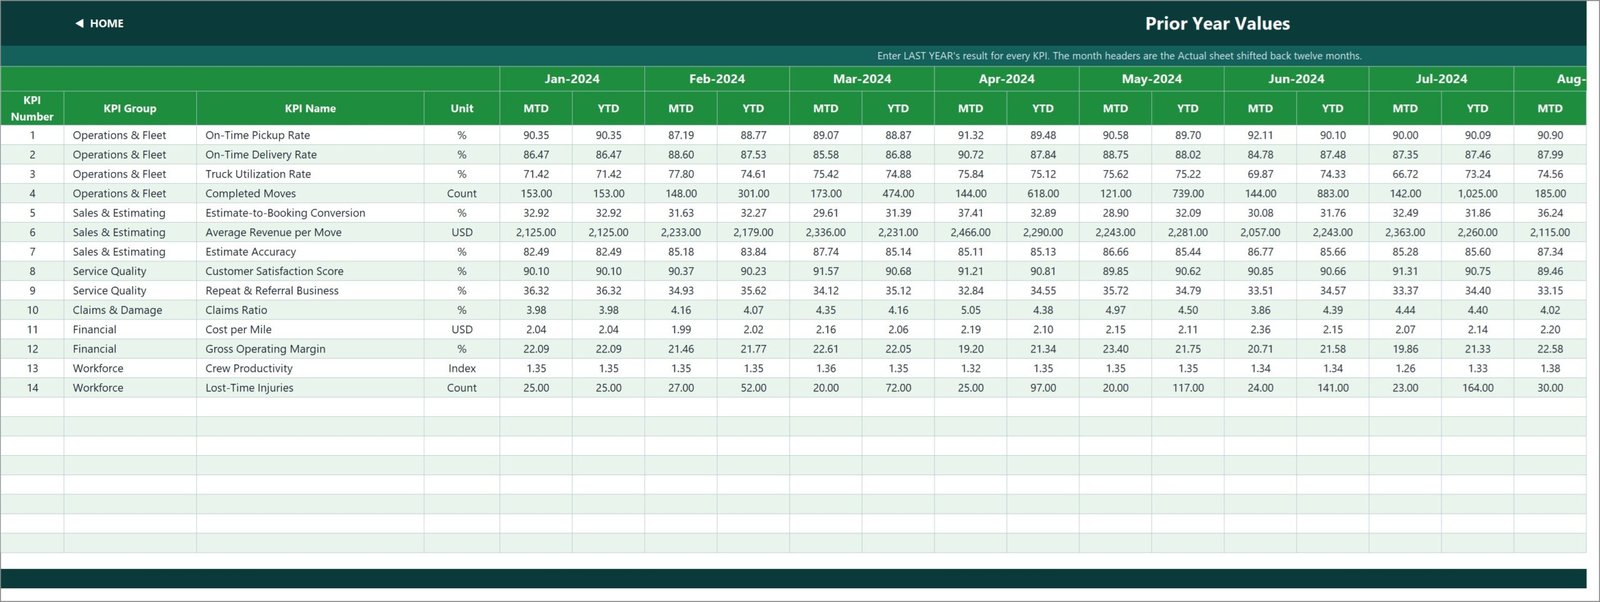
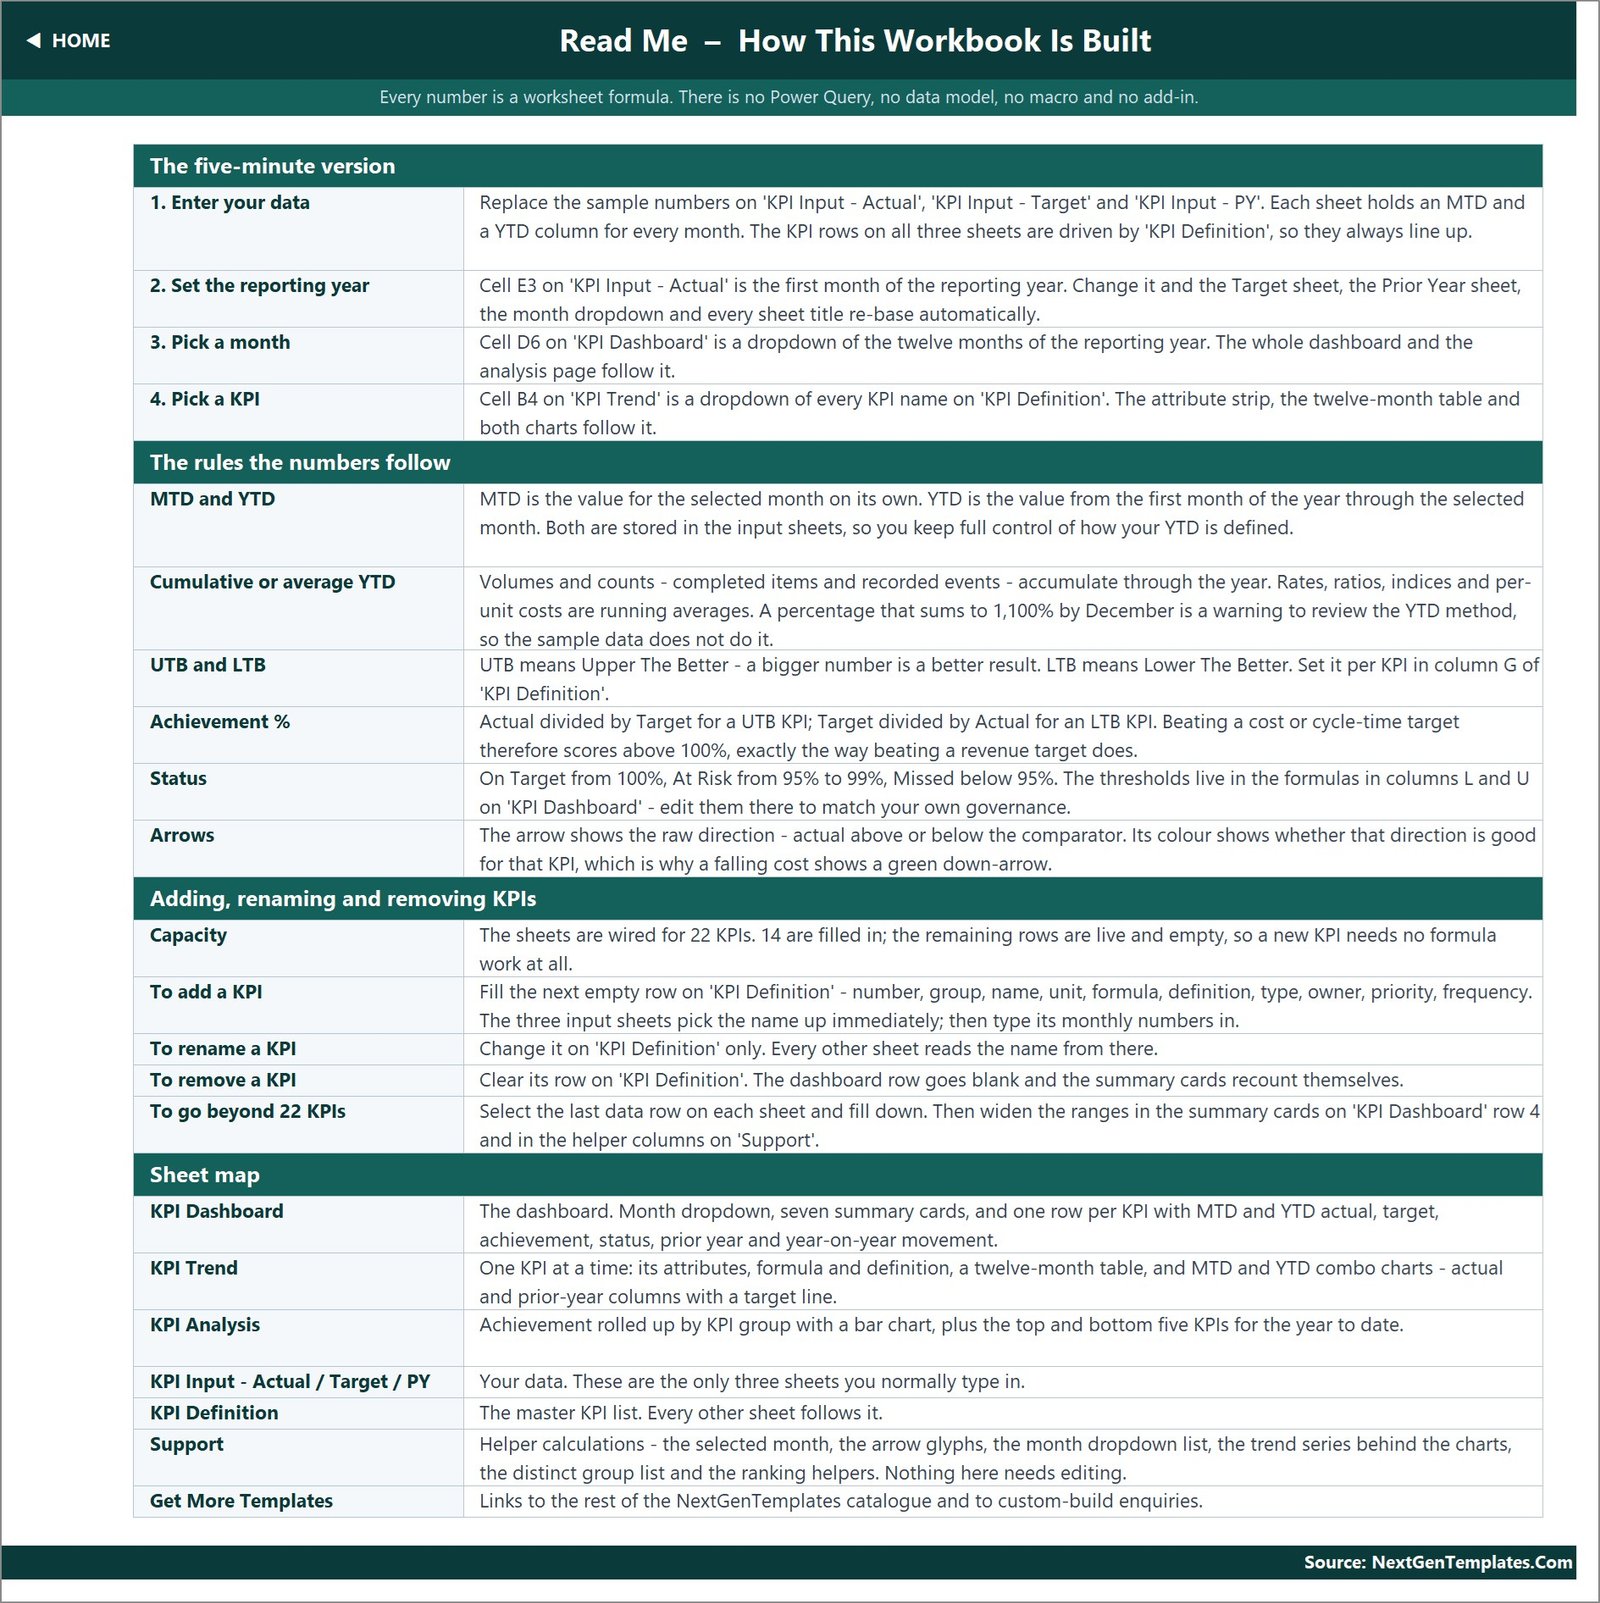
Three input sheets, one for this year’s actuals, one for targets and one for the prior year. Each holds an MTD and a YTD column for every month. Counts such as Completed Moves and Lost-Time Injuries accumulate through the year; rates, ratios, indices and per-unit costs run as averages. Cell E3 on the Actual sheet sets the first month of the reporting year.
KPI Definition, Read Me and Get More Templates
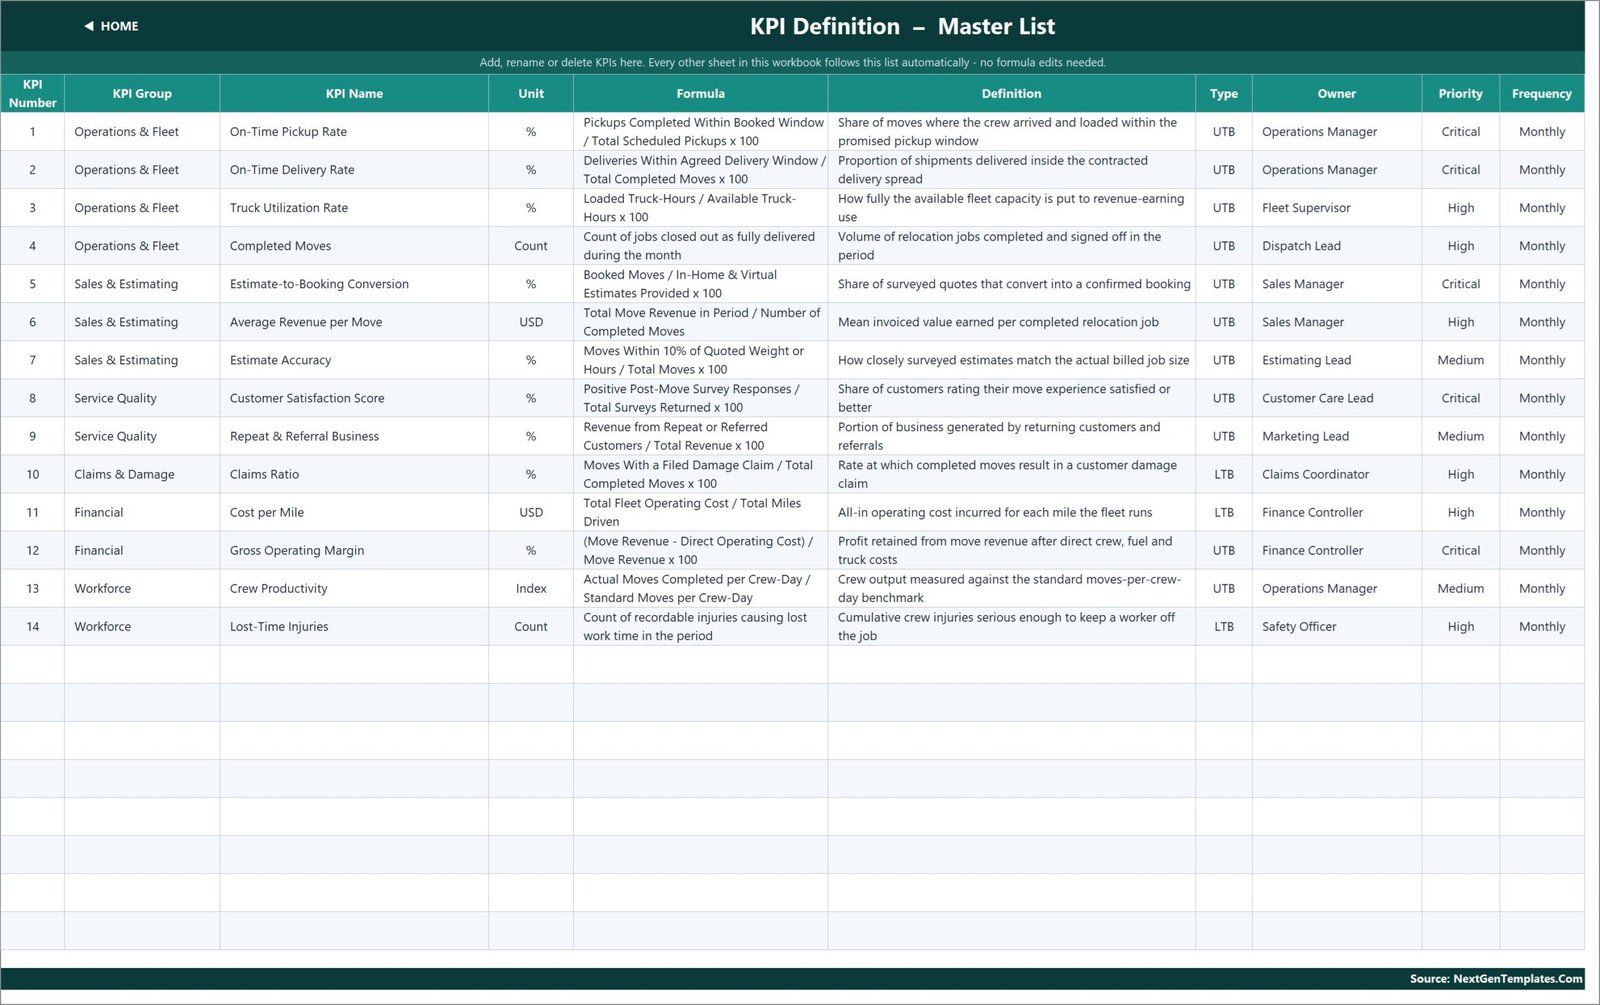
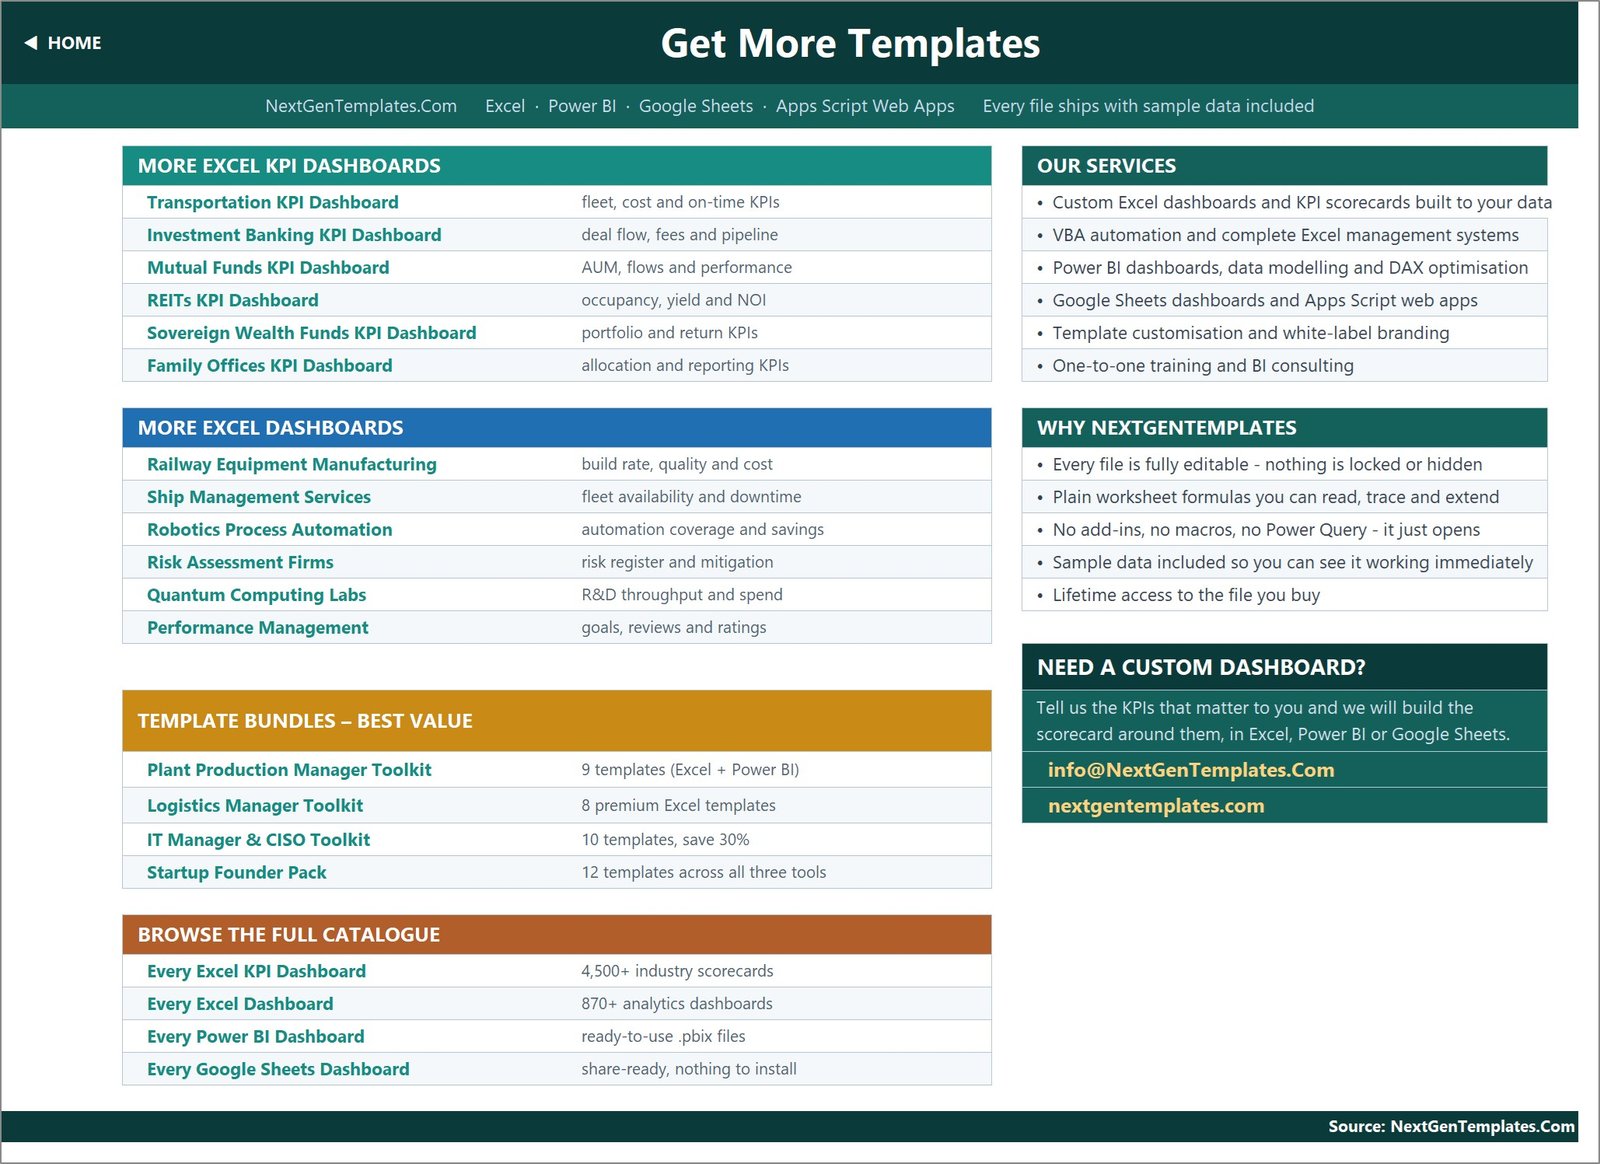
KPI Definition is the master list: number, group, name, unit, formula, definition, type, owner, priority and frequency for each KPI, for example Truck Utilization Rate = Loaded Truck-Hours / Available Truck-Hours x 100, owned by the Fleet Supervisor. Read Me explains the MTD/YTD rules, achievement maths, status thresholds and how to add KPIs. Get More Templates links to the wider catalogue.
📊 Moving Company KPI Template in Excel vs. Google Sheets Equivalent vs. Paid Moving Software
| Feature | Moving Company KPI Dashboard in Excel | Google Sheets equivalent | Paid moving CRM / BI software |
|---|---|---|---|
| Cost | ✅ $12.99 one-time | Build it yourself or buy separately | Recurring subscription, often priced per user |
| Platform | Excel 2013+ and Excel for the web | Browser, Google account | Vendor web app |
| Setup time | ✅ Type your monthly numbers into three input sheets | Build formulas and charts from scratch | Onboarding and data integration |
| MTD and YTD with prior year | ✅ Built in for all 14 KPIs | Manual | Depends on plan and reports |
| Lower-the-better scoring | ✅ UTB/LTB flag per KPI | Manual | Varies |
| Real-time team collaboration | Through OneDrive or SharePoint co-authoring | ✅ Native | ✅ Native |
| Customizable KPIs | ✅ Up to 22 KPIs, no formula edits | Manual | Limited to vendor metrics |
| Bookings, dispatch and inventory | Not included, KPI reporting only | Not included | ✅ Usually included |
| Year-1 cost at 5 users | ✅ $12.99 | Your build time | Several subscription seats |
For moving companies that want a monthly KPI review without paying for another subscription, the Moving Company KPI Dashboard in Excel sits in the sweet spot.
👥 Who This Template Is For, and Who It’s Not For
✅ This template is built for:
- Owners and general managers of local and long-distance moving companies who run a monthly performance review
- Operations managers and dispatch leads watching on-time pickups, deliveries, truck utilization and crew productivity
- Sales and estimating managers tracking booking conversion, estimate accuracy and revenue per move
- Finance controllers comparing cost per mile and gross operating margin against target and last year
❌ This template is NOT for:
- Teams that need move booking, crew dispatch, inventory lists or customer invoicing. This workbook reports KPIs from numbers you enter; it does not run operations
- Anyone looking for a damage-claims handling system, a safety incident log or a regulatory compliance record
- Businesses that need a live connection to a moving CRM or telematics feed without manual data entry
⚙️ How to Use the Moving Company KPI Workbook
- Unzip the download and open the .xlsx in Microsoft Excel.
- Review the 14 KPIs on KPI Definition. Rename, add or clear rows to match your company.
- Set the first month of your reporting year in cell E3 on KPI Input – Actual.
- Replace the sample MTD and YTD numbers on the Actual, Target and PY input sheets.
- Pick a month in cell D6 on the KPI Dashboard to read the scorecard and the analysis page.
- Select a KPI in cell B4 on KPI Trend to review its twelve-month history.
New to dropdown cells? Microsoft explains how they work in its guide to creating a drop-down list in Excel.
💼 Real-World Use Cases
Daniel runs a 12-truck household moving company. At each month end he types his pickup, delivery and utilization figures into the Actual sheet, picks the month on the KPI Dashboard and sees at once which operations KPIs slipped to At Risk, before his crew leads meeting.
Priya manages sales and estimating for a regional relocation firm. She uses KPI Trend to compare Estimate-to-Booking Conversion and Estimate Accuracy with last year month by month, and brings the Bottom 5 list to her weekly estimator coaching sessions.
Marcus is the finance controller at a commercial mover. He watches Cost per Mile and Gross Operating Margin against target on the YTD side of the scorecard, and uses the Improving vs PY card to show the owner whether the business is ahead of last year.
❓ Frequently Asked Questions
What KPIs does the Moving Company KPI Dashboard in Excel track?
It tracks 14 KPIs in 6 groups: Operations & Fleet, Sales & Estimating, Service Quality, Claims & Damage, Financial and Workforce. They include On-Time Pickup Rate, Truck Utilization Rate, Estimate-to-Booking Conversion, Claims Ratio, Cost per Mile and Crew Productivity. You can rename them or add up to 22 KPIs.
Do I need macros or Power Query?
No. The Moving Company KPI Dashboard in Excel uses plain worksheet formulas only, with no macros, Power Query, data model or add-ins. It opens as a normal .xlsx file in Excel 2013 and later and in Excel for the web, so there is nothing to enable or refresh.
Can the reporting year start in a month other than January?
Yes. Change cell E3 on KPI Input – Actual to the first month of your financial or reporting year. The Target and Prior Year sheets, the month dropdown and every sheet title re-base automatically, so a July-to-June year works the same way as a calendar year.
Does it book moves, dispatch crews or handle damage claims?
No. This workbook is a KPI reporting tool. It scores the monthly numbers you enter for bookings, deliveries, claims and injuries, but it does not store customer jobs, schedule crews, process claims or act as a safety or regulatory compliance record.
How does it compare with paid moving software?
Paid moving CRMs handle bookings, dispatch and invoicing on a recurring subscription. The Moving Company KPI Dashboard in Excel costs $12.99 once and focuses on a monthly MTD and YTD KPI review against target and prior year, so many movers use it alongside their operational system.
👤 About the Author
Built by PK, Microsoft Certified Professional with 15+ years of Excel, Google Sheets and Power BI experience. Founder of NextGenTemplates, sharing tutorials on the YouTube channels @PKAnExcelExpert, @NextGenTemplates and @NeoTechNavigators. Every template is hand-built and tested before release.
🔗 Explore Related Templates
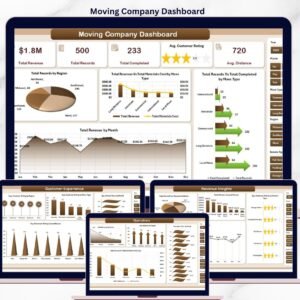
- 📈 Moving Company Dashboard in Excel: the analytical dashboard edition for movers, a different template family from this KPI dashboard.
- 📊 Moving Company Dashboard in Power BI and Moving Company Dashboard in Google Sheets for teams on other platforms.
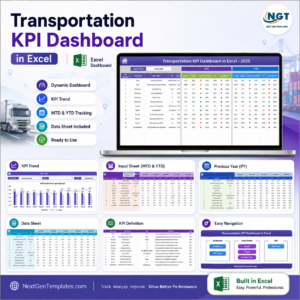
- 🚛 Transportation KPI Dashboard in Excel and Trucking and Logistics Dashboard in Excel for fleet-heavy operations.
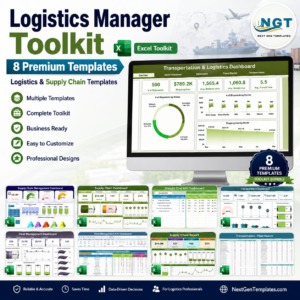
- 💎 Logistics Manager Toolkit: eight premium Excel templates in one bundle.
- 📂 Browse every Excel KPI Dashboard template or all MS Excel templates.
📖 Click here to read the Detailed Blog Post
🎥 Visit our YouTube channel for step-by-step video tutorials
👉 YouTube.com/@NextGenTemplates
📅 Last updated: September 2026





























Reviews
There are no reviews yet.