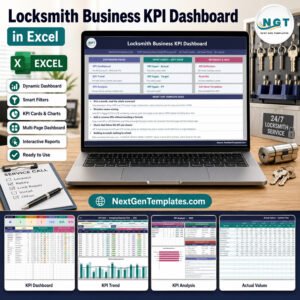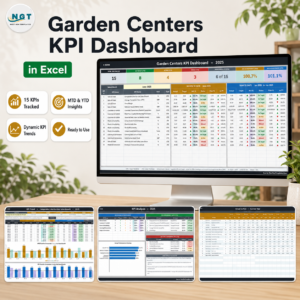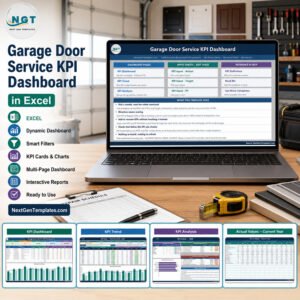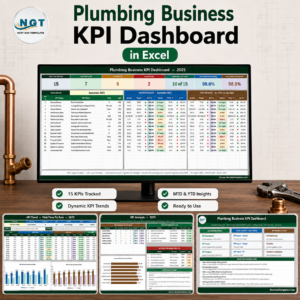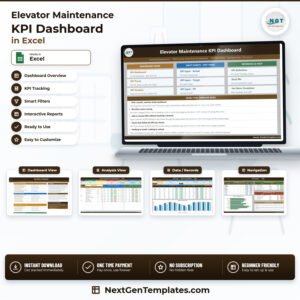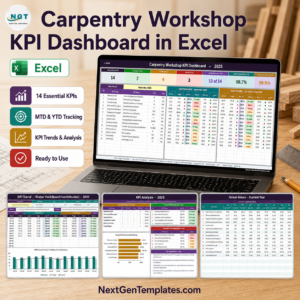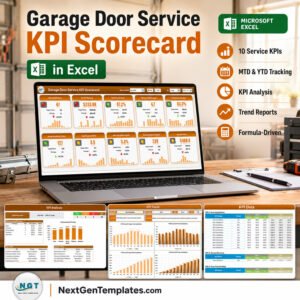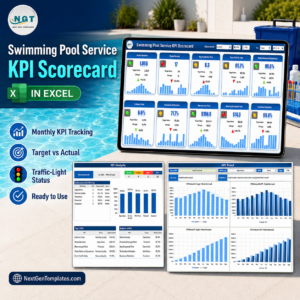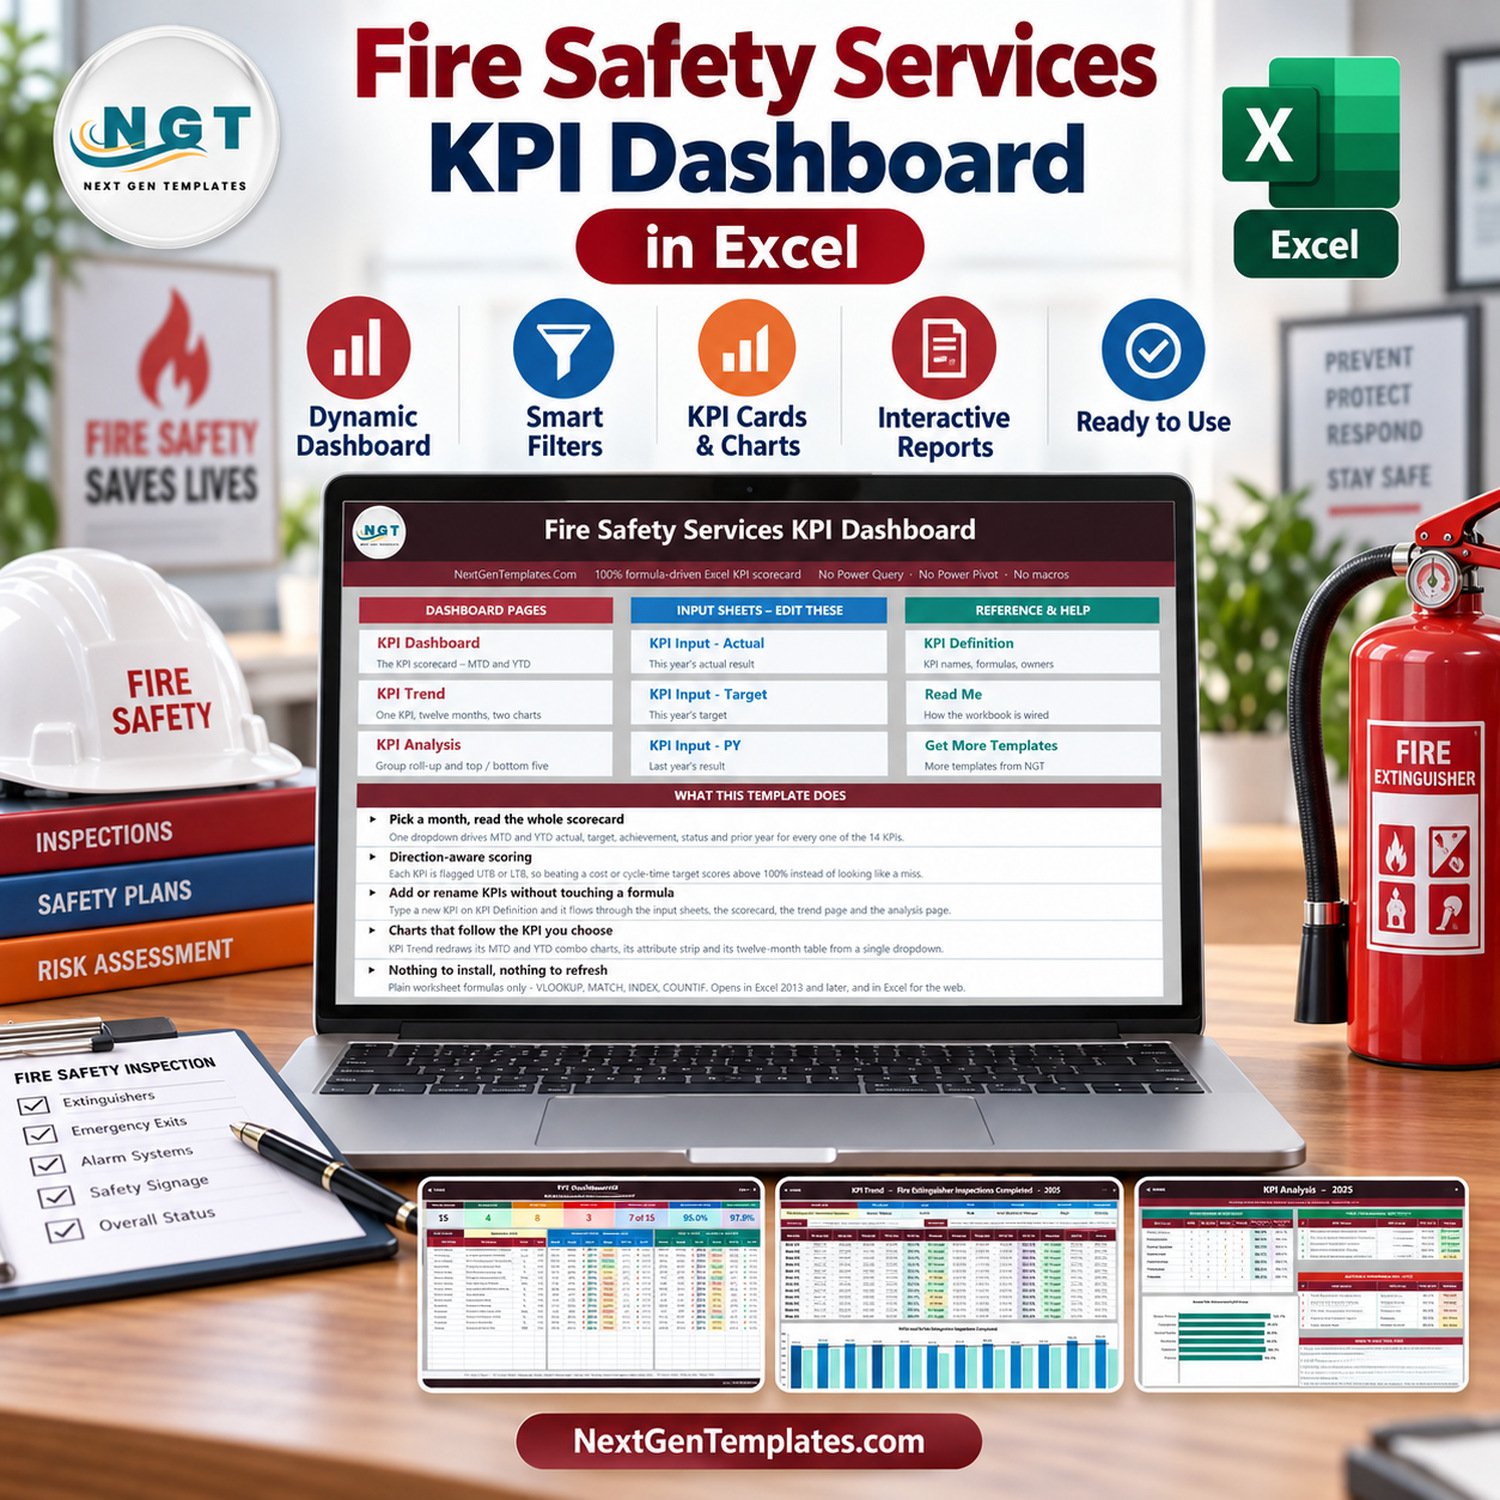
The Fire Safety Services KPI Dashboard in Excel is a formula-driven monthly reporting workbook for fire protection contractors, inspection teams and compliance managers. You type your own figures into three input sheets and the scorecard, the trend page and the analysis page recalculate on their own. There is no Power Query, no data model, no macro and no add-in.
Read this first. This is a reporting template over data you type in. It does not certify, inspect, test or prove the condition of any fire alarm, extinguisher, sprinkler, suppression system, emergency light or fire door. Every number you see in the screenshots is demo data shipped as a worked example, not a record of any real building or system.
Key Features of the Fire Safety Services KPI Dashboard in Excel
- 15 fire safety KPIs across 6 KPI groups – Service Delivery, Compliance, Service Quality, Workforce, Customer and Finance.
- Month-to-date and year-to-date side by side for every KPI, driven by one month dropdown.
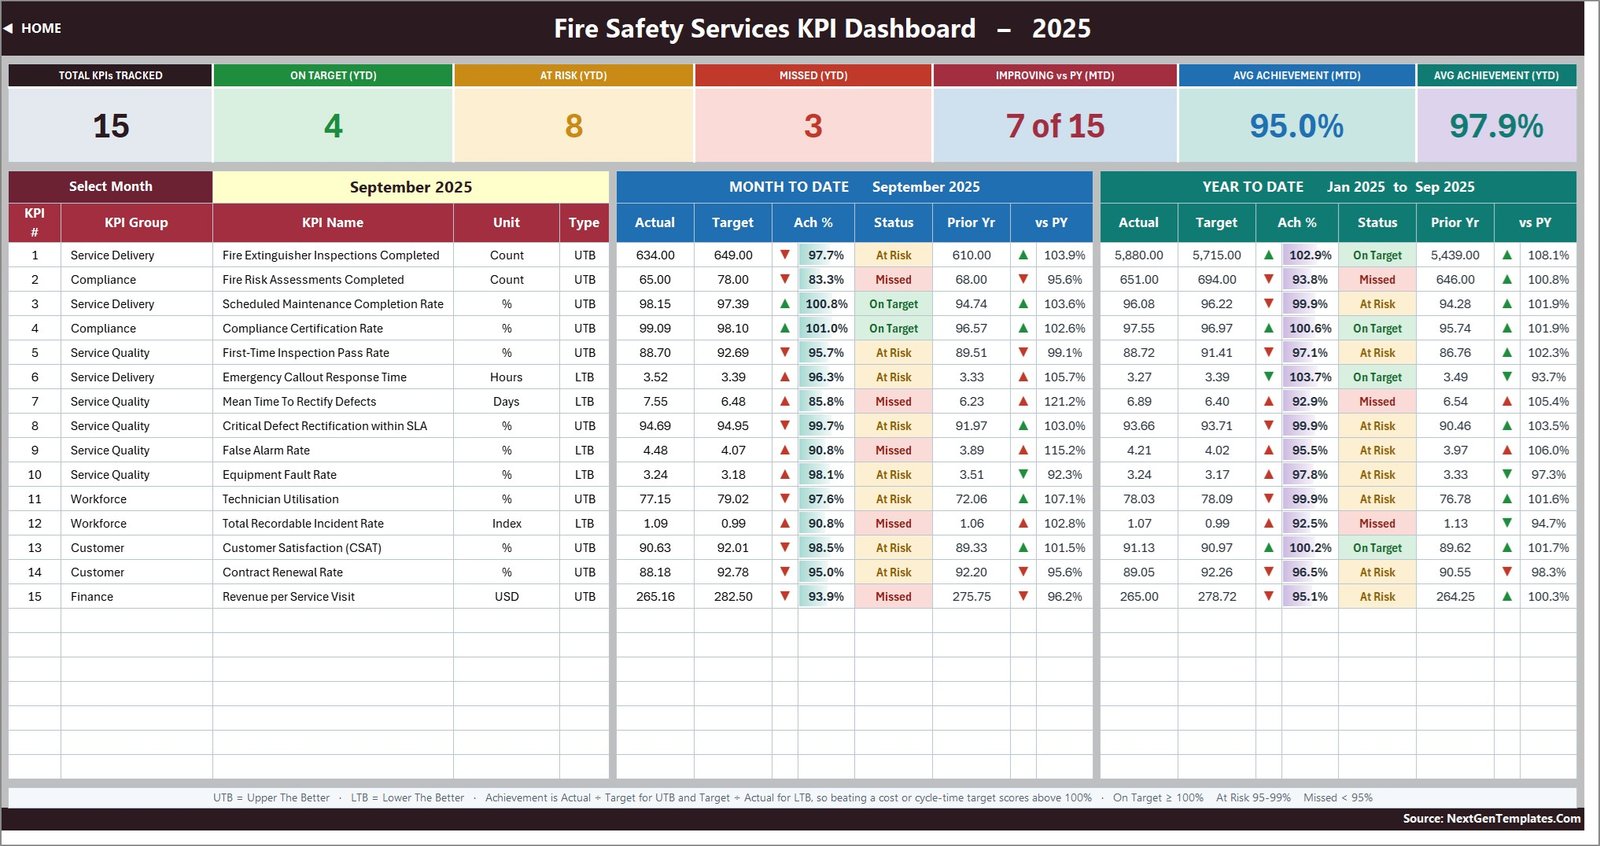
- Seven summary cards – total KPIs tracked, On Target, At Risk, Missed, improving vs prior year, and average achievement for both MTD and YTD.
- Direction-aware UTB/LTB scoring so beating a response-time or defect-rate target scores above 100% instead of reading as a miss.
- Colour-correct movement arrows – the glyph shows raw direction, the colour shows whether that direction is good for that KPI, so a falling fault rate shows a green down-arrow.
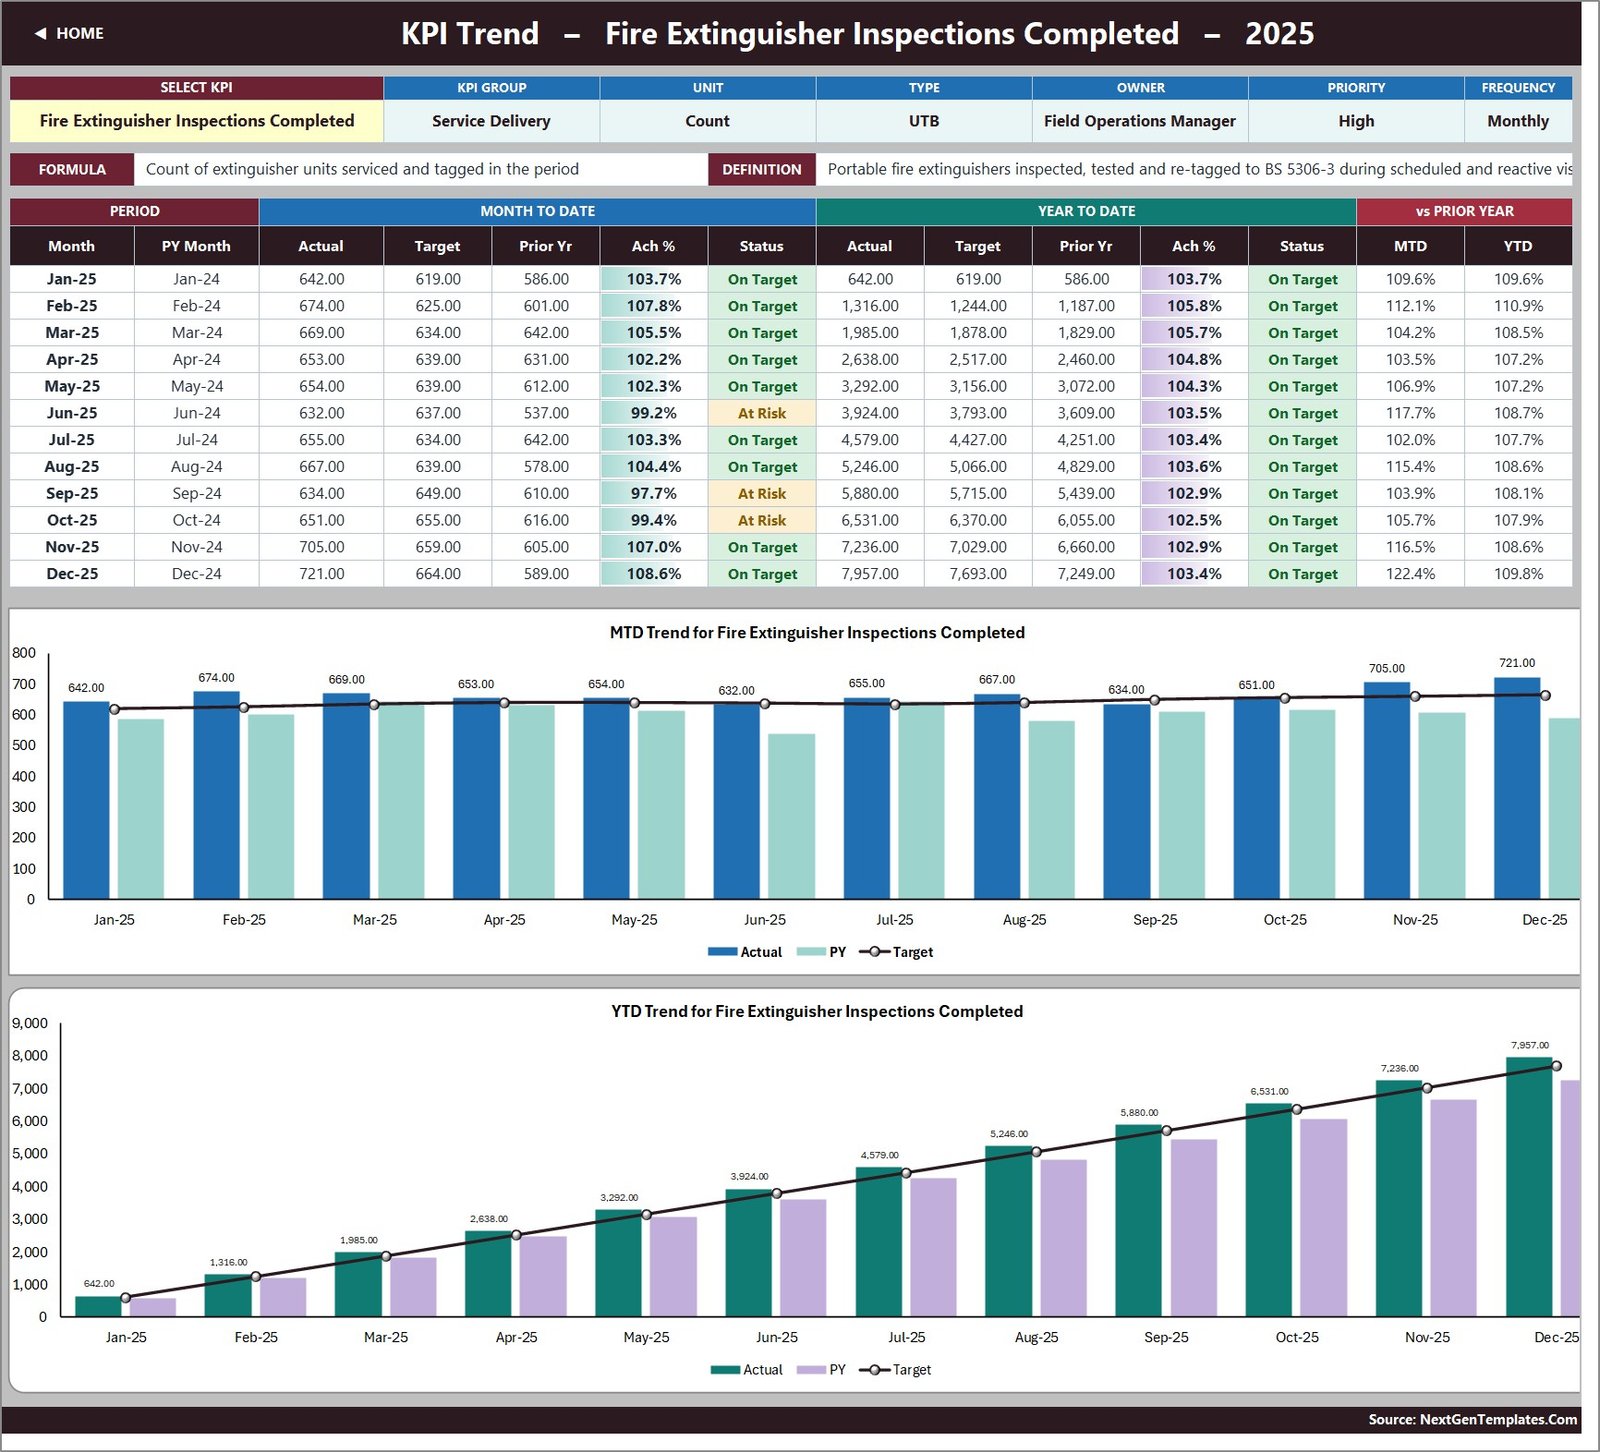
- 12-month KPI Trend page with an attribute strip and two combo charts – actual and prior-year columns with a target line.
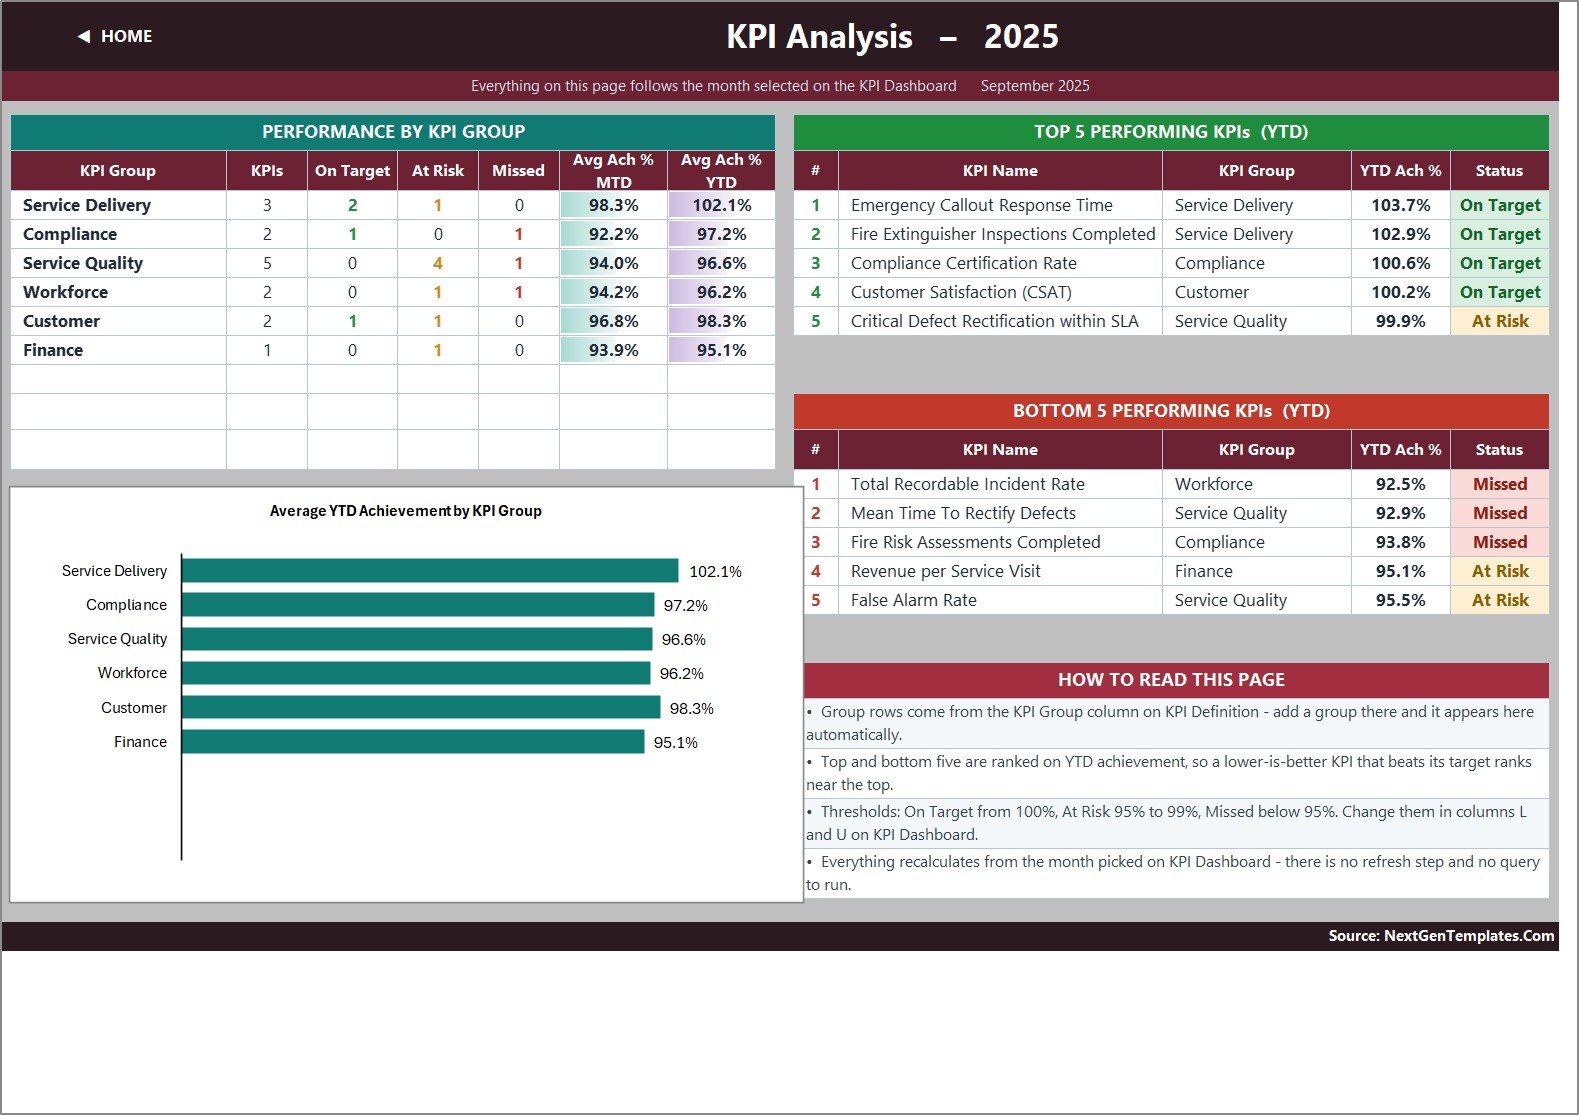
- KPI Analysis page with a group roll-up, an Average YTD Achievement by KPI Group bar chart, and Top 5 / Bottom 5 rankings.
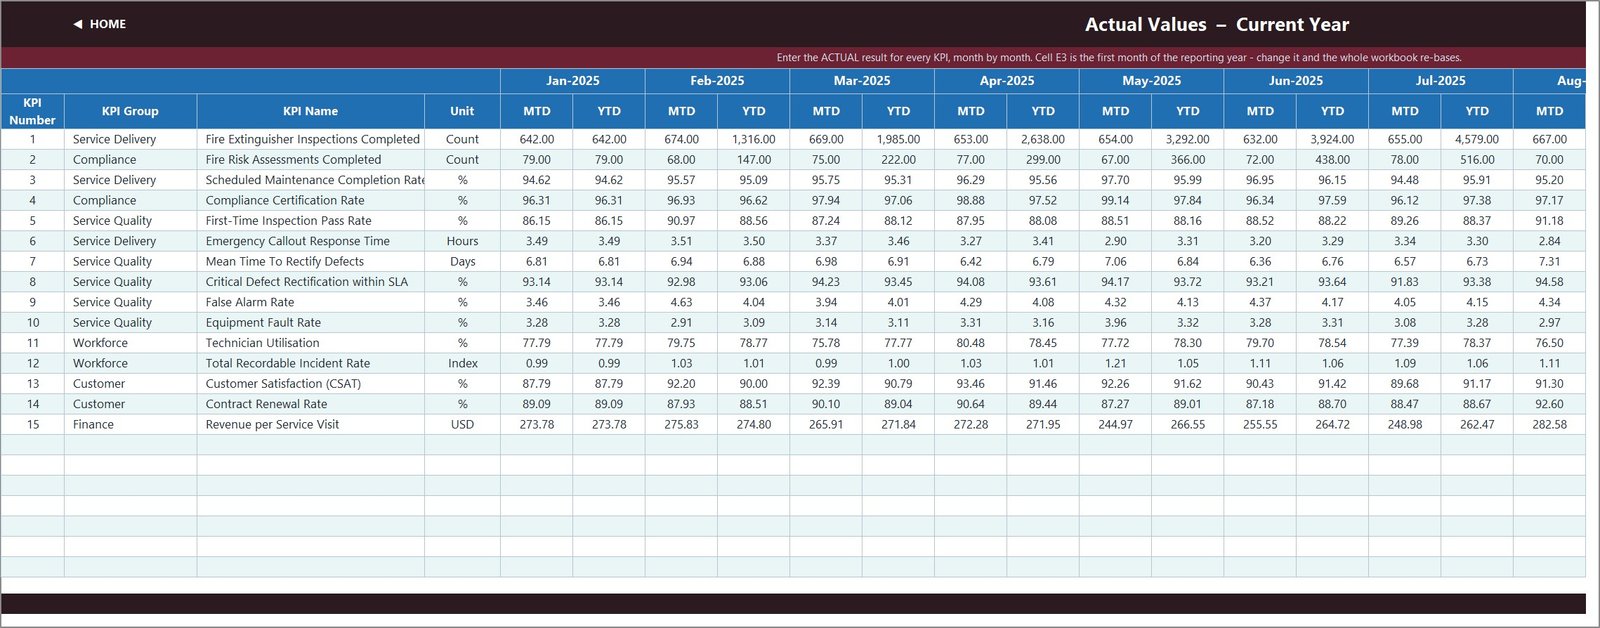
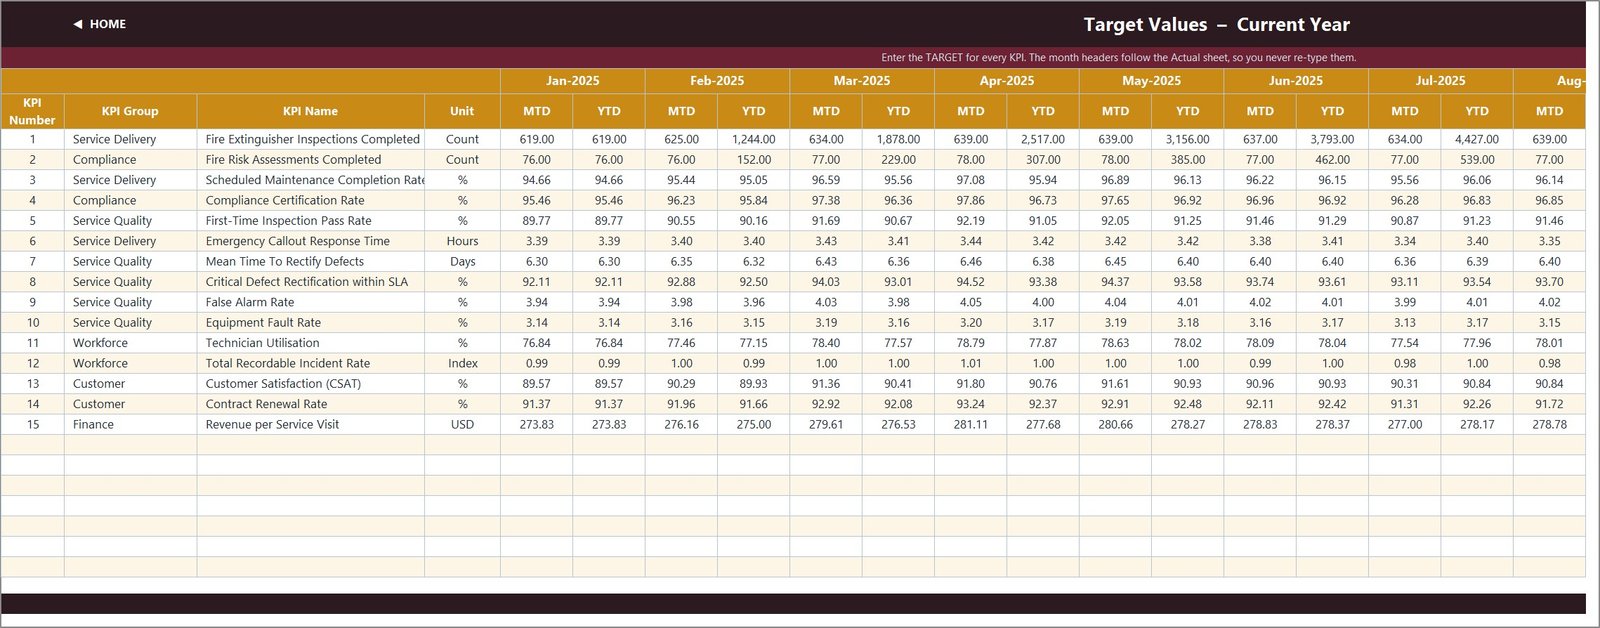
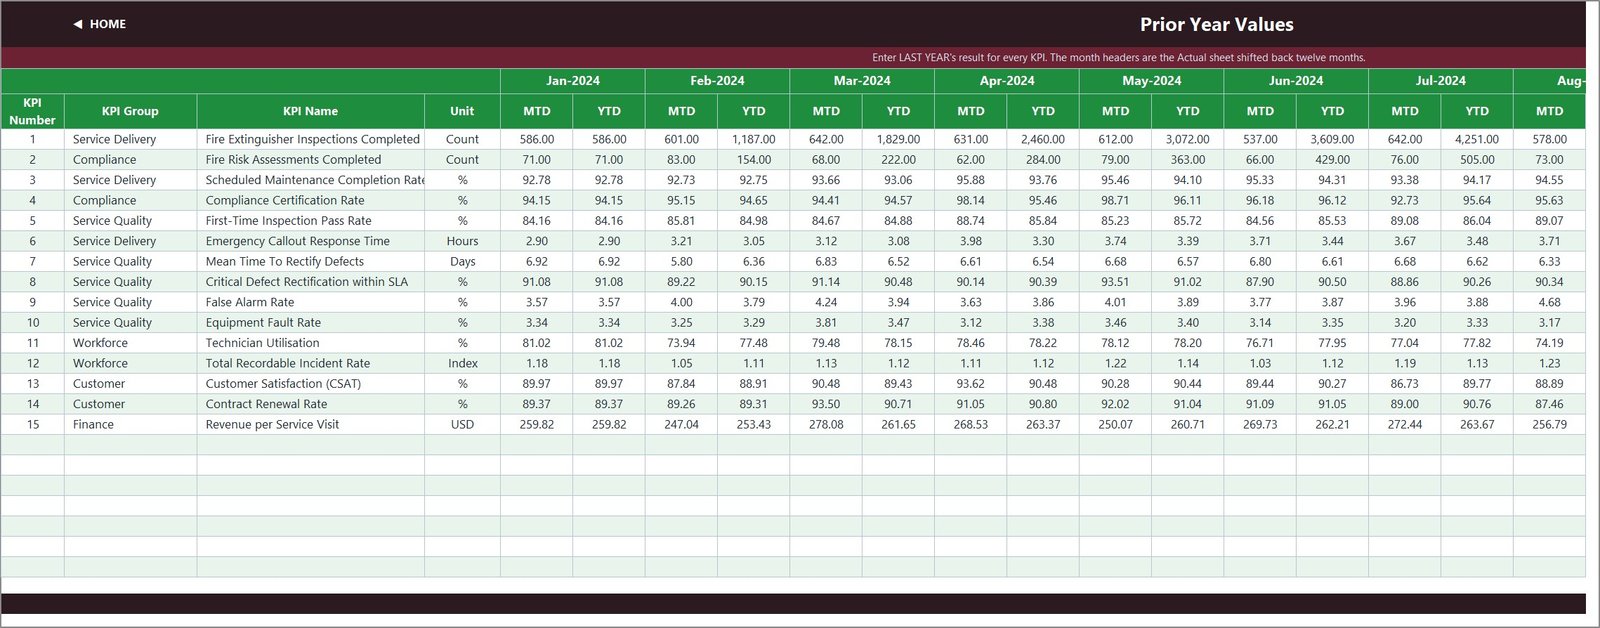
- Three input sheets – Actual, Target and Prior Year – each holding an MTD and a YTD column for all twelve months.
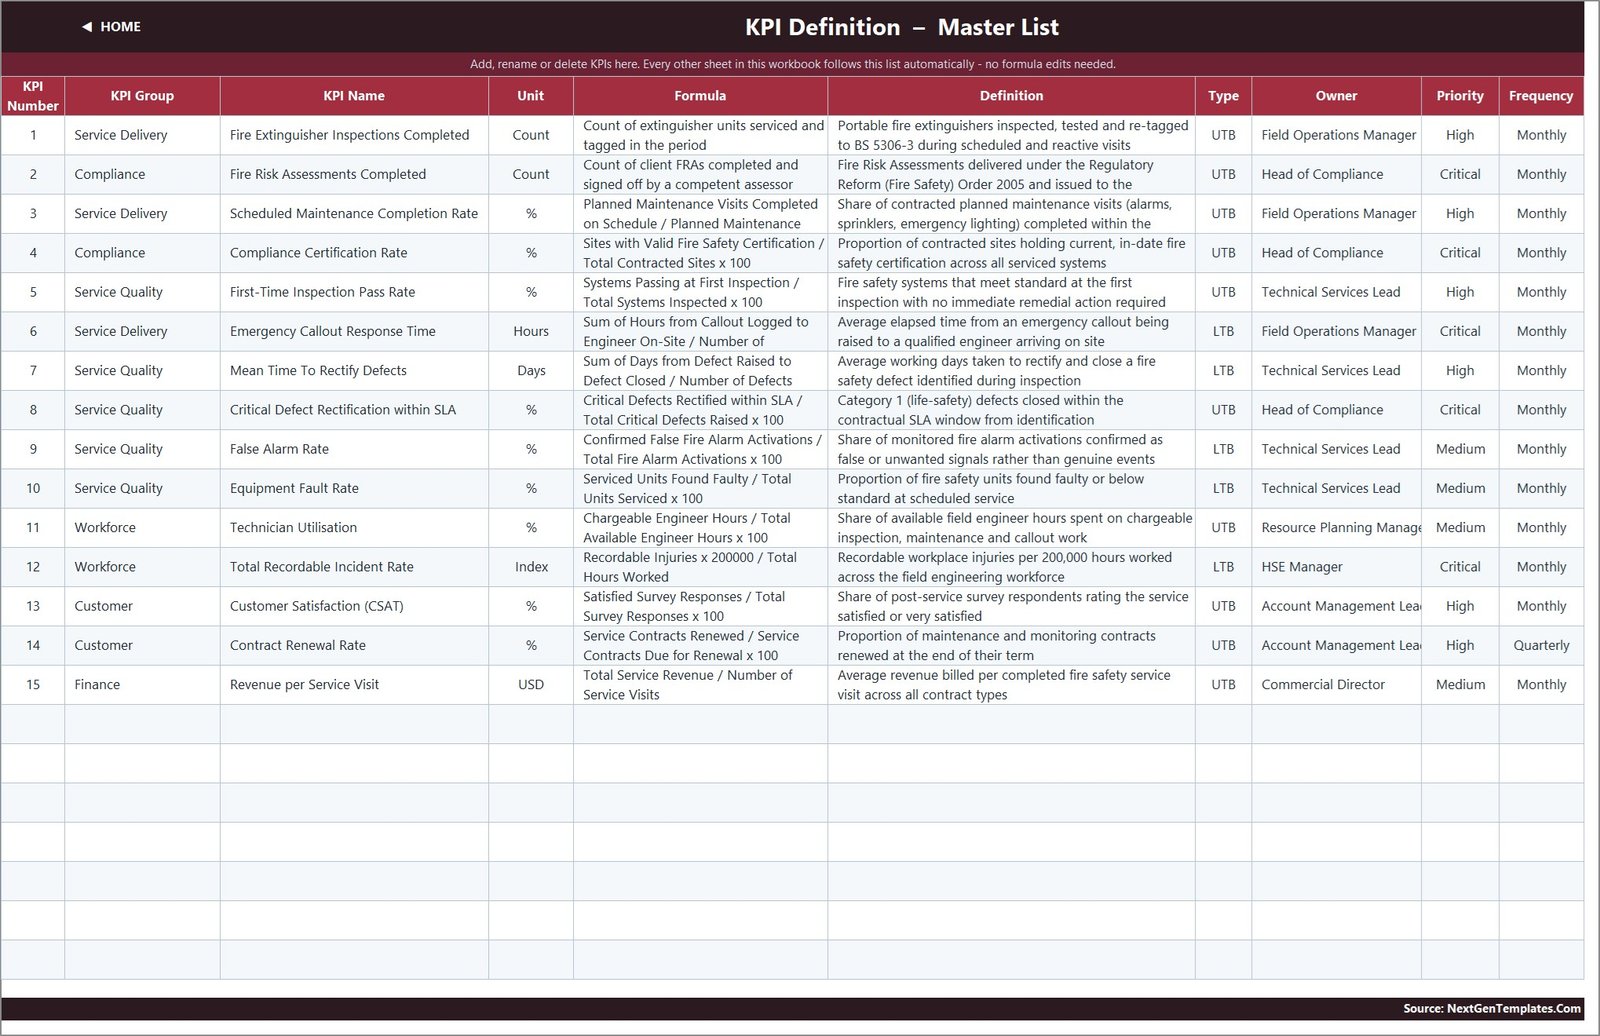
- Editable KPI Definition master list – rename, add or remove a KPI and every other sheet follows automatically.
- Instant download – the .xlsx workbook plus an Excel KPI Dashboard user manual PDF.
Which NextGenTemplates Product This Is
NextGenTemplates publishes three families whose names read alike. This listing is the KPI Dashboard one, and they are genuinely different products rather than duplicates of each other:
- This product – the KPI Dashboard line. A month-picker scorecard: every KPI on one row with MTD and YTD actual, target, achievement percentage, status, prior year and year-on-year movement, plus a per-KPI trend page and a group analysis page.
- The Excel Dashboard line is the analytical one – slicers, pivot-driven charts and a free-form analysis canvas rather than a fixed KPI scorecard.
- The KPI Scorecard line is the compact one – a shorter ten-KPI review layout on fewer pages.
If you want a one-page review pack rather than a full scorecard workbook, the Fire Safety Services KPI Scorecard in Excel (product 94301) is the closer companion. It is being prepared and is not live yet, so there is no link to it here.
What’s Inside the Fire Safety Services KPI Dashboard in Excel
The workbook ships eleven sheets. Ten of them are shown in the gallery above.
KPI Dashboard
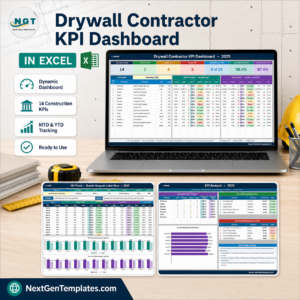
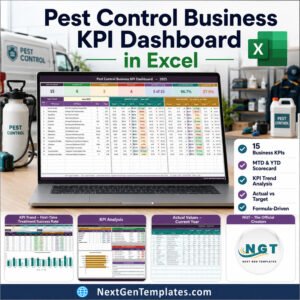
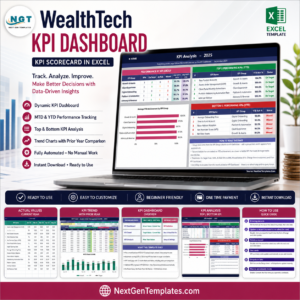
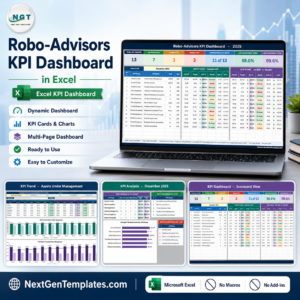
The scorecard. Pick a month in the dropdown and the seven summary cards and all fifteen KPI rows re-read. In the shipped demo month of September 2025 the cards read 15 KPIs tracked, 4 On Target, 8 At Risk and 3 Missed – which is where every KPI sits against the sample targets, and nothing more than that. Status thresholds are On Target from 100%, At Risk from 95% to 99%, and Missed below 95%, and they live in ordinary formulas you can edit.
KPI Trend
One KPI at a time. Choose a KPI from the dropdown and the attribute strip, its formula and definition, a twelve-month table and both charts follow it. This page deliberately shows the whole twelve months whatever month the scorecard is set to – it is a full-year view of a single measure, driven by the KPI picker rather than the month picker.
KPI Analysis
Achievement rolled up by KPI group with a bar chart, plus Top 5 and Bottom 5 KPIs on year-to-date achievement. Because ranking is on achievement rather than raw value, a lower-is-better KPI that beats its target ranks near the top, exactly as it should.
Actual, Target and Prior Year inputs
Three sheets, fifteen KPI rows each, twelve months each, with an MTD and a YTD column per month. The KPI rows on all three are driven by the KPI Definition sheet so they can never fall out of step. Change one cell – the first month of the reporting year – and the target sheet, the prior-year sheet, the month dropdown and every sheet title re-base.
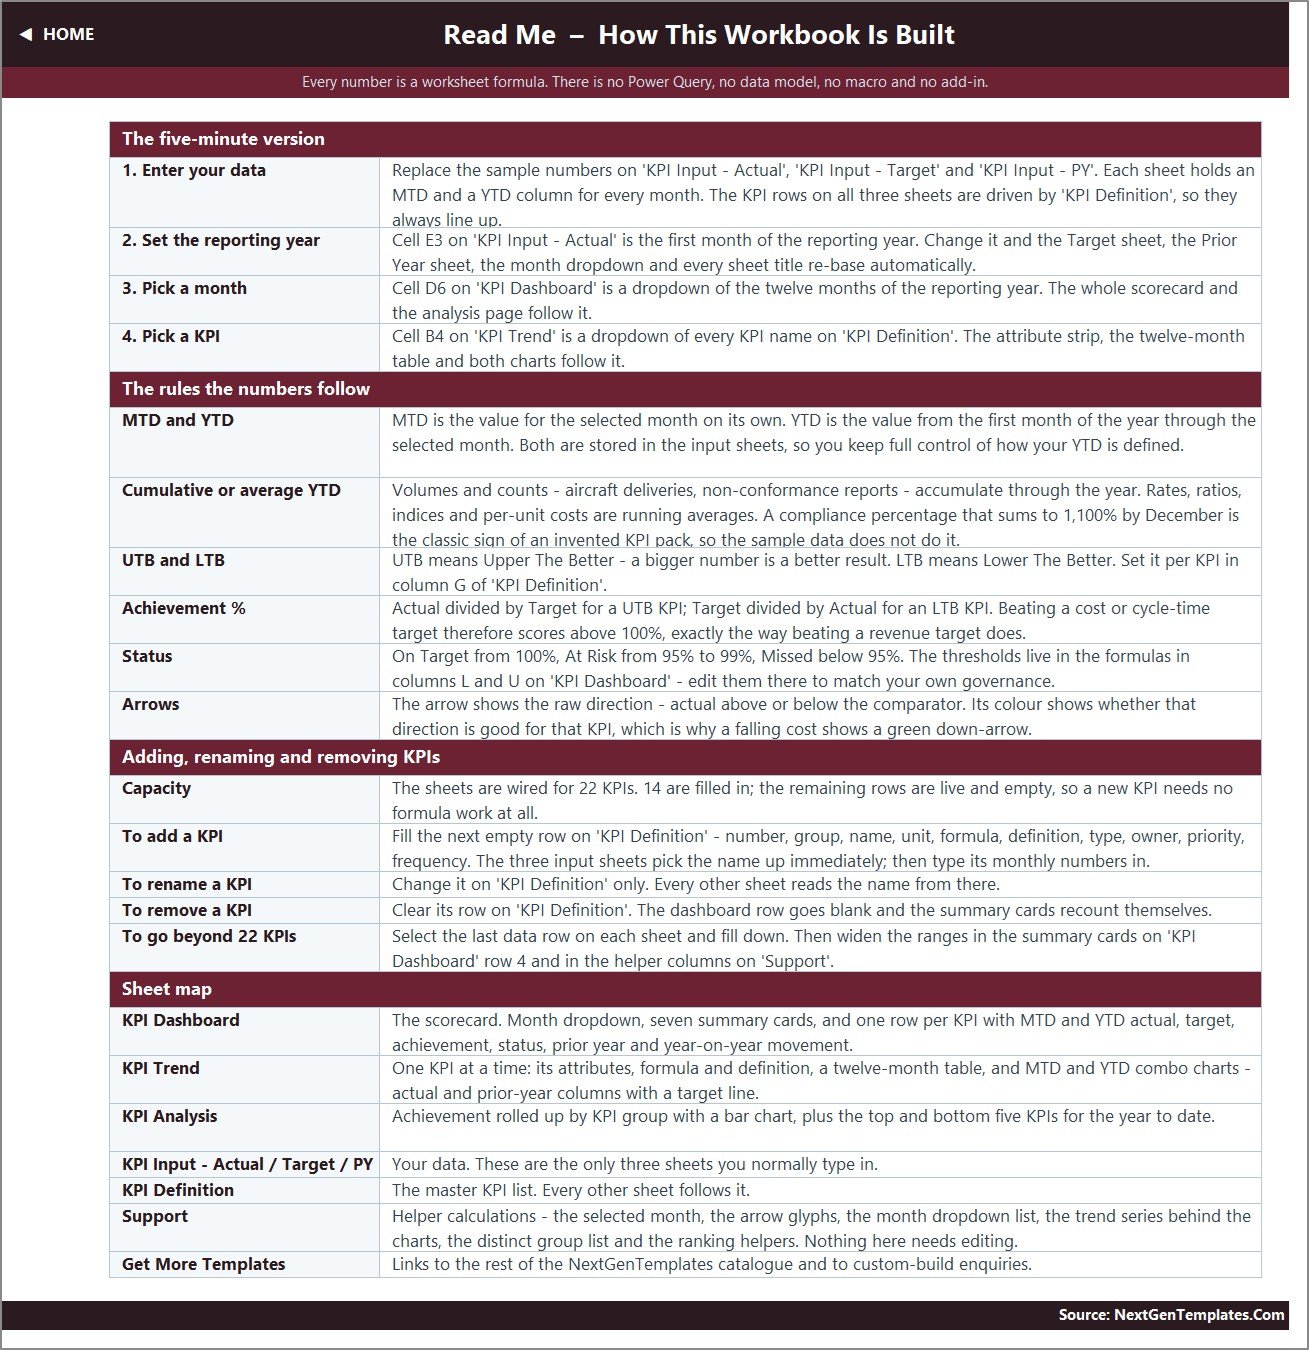
KPI Definition and Read Me
The master list carries KPI number, group, name, unit, formula, plain-English definition, UTB/LTB type, owner, priority and frequency for all fifteen KPIs. The Read Me explains MTD versus YTD, cumulative versus average year-to-date, how achievement and status are calculated, and how to add or remove KPIs. The sheets are wired for 22 KPI rows, so seven more can be added with no formula work.
The 15 KPIs You Get
All fifteen are pre-filled with twelve months of demo data so you can see the workbook working before you replace a single figure.
- Service Delivery – Fire Extinguisher Inspections Completed (count), Scheduled Maintenance Completion Rate (%), Emergency Callout Response Time (hours, lower is better).
- Compliance – Fire Risk Assessments Completed (count), Compliance Certification Rate (%).
- Service Quality – First-Time Inspection Pass Rate (%), Mean Time To Rectify Defects (days, lower is better), Critical Defect Rectification within SLA (%), False Alarm Rate (%, lower is better), Equipment Fault Rate (%, lower is better).
- Workforce – Technician Utilisation (%), Total Recordable Incident Rate (index, lower is better).
- Customer – Customer Satisfaction CSAT (%), Contract Renewal Rate (%).
- Finance – Revenue per Service Visit (USD).
Every one of those names, units and definitions is editable. Nothing is locked, hidden or protected.
What This Template Is Not
This is the most important section on the page, so it is written plainly. The Fire Safety Services KPI Dashboard in Excel does not:
- certify, inspect, test or prove the condition of any fire alarm, extinguisher, sprinkler, suppression system, emergency light or fire door;
- establish compliance with NFPA 25, NFPA 72, BS 5839, BS 9999, the Regulatory Reform (Fire Safety) Order, OSHA, local fire codes, or any licensing or third-party certification scheme;
- constitute a fire risk assessment, a service or inspection certificate, a commissioning record, a defect notice, or a log book of any legal standing;
- replace the statutory duties of a competent person or a responsible person;
- connect to alarm panels, monitoring centres, scheduling systems or any live data source.
Any inspection-due, response-time, defect-rectification or compliance figure in the artwork is a buyer-entered demo number. It must never be presented as evidence that a system is safe or that a building is compliant. The workbook reports what you type into it, and nothing else.
Excel Workbook vs. Google Sheets vs. Field-Service SaaS – Where This Fits
| This Excel workbook | Google Sheets edition | Field-service SaaS | |
|---|---|---|---|
| Cost | One-off purchase, yours to keep | One-off purchase, yours to keep | Monthly per-user subscription |
| Setup time | Minutes – open and type | Minutes – copy and type | Weeks of configuration |
| Works offline | Yes | No | Usually no |
| Multi-user editing | No – file based | Yes | Yes |
| Job scheduling and dispatch | No | No | Yes |
| Pulls data automatically | No – you type it in | No – you type it in | Yes |
| Full control of the formulas | Yes – nothing locked | Yes | No |
| Issues certificates or proves compliance | No | No | No |
Who This Template Is For – and Who It Is Not For
A good fit: fire protection contractors and extinguisher servicing firms running a monthly management review; compliance and HSE managers who need a consistent KPI pack; operations managers tracking SLA performance across a contract portfolio; consultants who report to clients in Excel.
Not a fit: anyone who needs live dispatch, engineer scheduling, mobile job sheets or automatic data capture; anyone who needs a legally valid inspection certificate or log book; anyone expecting the workbook to assess risk or make a compliance judgement on their behalf. It reports; it does not decide.
How to Use It
- Open the workbook and go to the Read Me sheet.
- On KPI Definition, rename the sample KPIs to your own terminology, or leave them as they are.
- Set the first month of your reporting year in cell E3 of KPI Input – Actual. Everything else re-bases.
- Replace the demo figures on the Actual, Target and Prior Year sheets with your own numbers.
- Pick your reporting month on KPI Dashboard and review the scorecard.
- Use KPI Trend for a single measure over twelve months and KPI Analysis for the group roll-up and the Top 5 / Bottom 5.
Honest Notes on This Build
We check every workbook before listing it and publish what we find. On this build the numbers reconcile and two pieces of wording do not:
- The figures reconcile. All 540 year-to-date cells across the three input sheets recompute correctly – counts accumulate, rates and indices run as averages. The seven summary cards reconcile with the fifteen KPI rows (4 + 8 + 3 = 15), and the KPI Analysis group table reconciles with both the scorecard and its own chart (3 + 2 + 5 + 2 + 2 + 1 = 15 KPIs in 6 groups).
- A KPI count in the copy is wrong. The Home page and the Read Me both say 14 KPIs. The workbook actually ships 15, numbered 1 to 15 on every sheet. It is a wording slip on two text cells – no calculation uses it, and you can correct both cells by typing over them.
- Two stray examples in the Read Me. The “Cumulative or average YTD” note illustrates its point with “aircraft deliveries, non-conformance reports” – leftover examples from another template’s Read Me. The rule it describes is correct; only the examples are off-topic.
- Minor clipping on two exported pages. On the KPI Trend page the long Definition text and the December prior-year column sit slightly past the print width, and a few Formula, Definition and Owner cells on the KPI Definition sheet are trimmed to their row height. Widen the column or row in Excel and the full text is there – nothing is missing from the file.
Frequently Asked Questions
Does this certify our fire safety systems or make a building compliant?
No. It is an Excel reporting template over figures you type in. It is not a fire risk assessment, an inspection or service certificate, a commissioning record or a log book, and it establishes compliance with nothing – not NFPA 25 or 72, not BS 5839 or BS 9999, not the Regulatory Reform (Fire Safety) Order, not OSHA, and not any local fire code or certification scheme. Only a competent person can do that work.
Are the numbers in the screenshots real?
No. Every figure shipped in the workbook and shown in the gallery is demo data, included so you can see the template working before you replace it. It describes no real building, contract or system.
How many KPIs are there, really?
Fifteen, in six groups. The Home and Read Me pages say fourteen; that wording is wrong and the file is right. Both cells are editable text.
Can I change the KPIs?
Yes. Edit the KPI Definition sheet and every other sheet follows. The sheets are wired for 22 rows, so you can add seven more without touching a formula.
What do UTB and LTB mean?
Upper The Better and Lower The Better. Achievement is actual divided by target for a UTB KPI and target divided by actual for an LTB KPI, so beating a response-time target scores above 100%.
Does it use macros or Power Query?
Neither. It is plain worksheet formulas – VLOOKUP, MATCH, INDEX, COUNTIF – and it opens in Excel 2013 and later and in Excel for the web.
Does it import job or alarm data automatically?
No. You enter the monthly figures yourself. That is deliberate: it keeps the workbook portable and keeps you in control of how each measure is defined.
What files are included?
A single ZIP containing the .xlsx workbook and the Excel KPI Dashboard user manual PDF.
Explore Related Templates
The same fifteen-KPI scorecard is available on other platforms:
- Fire Safety Services KPI Dashboard in Power BI – the same KPI family as an interactive report.
- Fire Safety Services KPI Dashboard in Google Sheets – share-ready, nothing to install.
- Fire Safety Services KPI Scorecard in Google Sheets – the compact scorecard layout.
- Fire & Safety Audit Management System Web App – if you need a multi-user system rather than a workbook.
About NextGenTemplates
NextGenTemplates builds ready-to-use Excel, Power BI, Google Sheets and Apps Script templates for operations and finance teams. Every file ships with sample data so you can see it working, nothing is locked or password protected, and the formulas are plain enough to read, trace and extend. If you need this scorecard rebuilt around your own KPI list, in Excel, Power BI or Google Sheets, tell us the measures that matter and we will build it.