



Review 14 glass-installation KPIs without rebuilding a management report every month. The Glass Installation KPI Dashboard in Excel brings Sales, Operations, Quality & Safety, Materials, Customer, and Financial measures into one formula-driven workbook. Select a month and the dashboard recalculates MTD and YTD actuals, targets, achievement, status, and prior-year comparisons. The sample June view shows 6 on-target KPIs, 6 at risk, and 2 missed, with average achievement of 99.0% MTD and 98.4% YTD. It is a one-time purchase with no macros, Power Query, Power Pivot, add-ins, or recurring software fee.
Key Features of Glass Installation KPI Dashboard in Excel
- Fourteen ready-made KPIs: track quoting, installations, quality, safety, materials, customer results, and margin.
- MTD and YTD views: compare current performance over two reporting horizons on one screen.
- Direction-aware scoring: UTB and LTB logic treats a lower lead time, breakage rate, or rework rate correctly.
- Seven summary cards: see total KPIs, on target, at risk, missed, improving versus prior year, and average achievement.
- Month selector: one dropdown drives the dashboard, KPI Analysis page, and visible reporting period.
- KPI Trend page: choose one measure to see a 12-month table plus MTD and YTD Actual, Target, and Prior Year charts.
- Group analysis: review average achievement by KPI group and the top and bottom five YTD performers.
- Editable KPI master: change names, groups, units, formulas, owners, priorities, frequency, and UTB/LTB type.

Home worksheet and workbook navigation
What’s Inside the Glass Installation KPI Dashboard in Excel
KPI Dashboard
The main sheet lists all 14 KPIs with MTD and YTD Actual, Target, Achievement, Status, Prior Year, and variance versus prior year. The supplied measures include Estimate-to-Job Conversion Rate, Average Contract Value, Quote Turnaround Time, Installations Completed, On-Time Completion Rate, Order-to-Install Lead Time, First-Time Fix Rate, Glass Breakage and Damage Rate, Callback and Rework Rate, Safety Incidents and Lacerations, Re-cut and Re-order Rate, Customer Satisfaction, Net Promoter Score, and Gross Margin per Job.

Month-controlled KPI Dashboard
KPI Trend and KPI Analysis
KPI Trend follows one selected KPI and shows its group, unit, type, owner, priority, frequency, formula, definition, 12-month results, and two charts. KPI Analysis rolls performance up by the six KPI groups, charts average YTD achievement, and ranks the top and bottom five measures for the selected month.

Selected-KPI monthly trend

KPI group roll-up and rankings
Actual, Target, and Prior Year inputs
Three structured input sheets hold monthly MTD and YTD values. Enter current actuals, targets, and prior-year results in the matching rows; formula-driven report pages read them automatically. The first month on the Actual sheet rebases the reporting year throughout the workbook.

Current-year Actual input

Current-year Target input

Prior Year input
KPI Definition and guidance
KPI Definition is the master list for every measure. The Read Me page explains setup, MTD/YTD behavior, UTB/LTB achievement, status thresholds, and capacity. Fourteen rows are populated and the workbook is wired for 22 KPIs before formulas need extending.

Editable KPI Definition master list

Built-in Read Me guidance
Glass Installation KPI Dashboard vs. Google Sheets vs. Paid Field-Service SaaS – Where This Fits
| Decision point | This Excel template | Google Sheets alternative | Paid field-service SaaS |
|---|---|---|---|
| Cost | One-time purchase | Template plus Google account | Recurring plan, often per user |
| Platform | Excel 2013+ or Excel for the web | Browser and Google Drive | Vendor web/mobile application |
| Setup | Replace monthly summary values | Copy and enter values | Configuration and migration |
| Team collaboration | File sharing or cloud co-authoring | Native link sharing | Role-based accounts |
| Custom KPIs | Editable master and formulas | Editable sheet structure | Depends on vendor plan |
| Job scheduling, quoting, CRM | No | No | Often included |
| Best fit | Monthly management review | Shared spreadsheet review | Live operational workflow |
Who This Template Is For – and Who It’s Not For
This Excel KPI dashboard for glazing contractors suits residential and commercial glass installers, glazing subcontractors, storefront and curtain-wall teams, estimators, operations managers, field supervisors, safety leads, and business owners. It works best when your source systems already hold job-level details and leadership needs a consistent monthly summary.
It is not estimating, measurement, scheduling, dispatch, inventory, CRM, accounting, incident-management, or safety-compliance software. It does not import data, validate source records, calculate glass dimensions, or replace required operational and safety systems.
How to Use This Excel KPI Dashboard
- Download and unzip the package, then open the .xlsx file in Microsoft Excel.
- Save a clean backup before replacing the sample values.
- Review KPI Definition and confirm every formula, owner, priority, frequency, and UTB/LTB direction.
- Set the first reporting month on the Actual sheet.
- Enter monthly Actual, Target, and Prior Year MTD/YTD values.
- Select a month on KPI Dashboard and investigate exceptions on KPI Trend and KPI Analysis.
- Validate one KPI manually after each update before sharing the report.
If several people will maintain the file, review Microsoft’s guidance on sharing and collaborating in Excel and define one owner for each reporting cycle.
Real-World Use Cases
Operations review
Ravi compares installations completed, on-time completion, and order-to-install lead time before allocating crews and resolving delays.
Quality and safety meeting
Maria reviews first-time fixes, breakage, callbacks, safety incidents, and re-orders together so a strong delivery count cannot hide avoidable defects.
Owner and estimator review
Daniel connects conversion, average contract value, customer satisfaction, and gross margin without turning the workbook into a replacement for the accounting or CRM system.
Frequently Asked Questions
Does the workbook use macros?
No. It uses standard worksheet formulas including VLOOKUP, MATCH, INDEX, and COUNTIF.
Can I change the 14 KPIs?
Yes. Edit the KPI Definition master and the linked sheets follow. The workbook has room for 22 KPIs before ranges need extending.
What do UTB and LTB mean?
Upper the Better and Lower the Better define which direction counts as stronger performance.
Does it import job data automatically?
No. This glazing KPI tracking template uses manually entered monthly summaries.
Can it replace field-service software?
No. The glass contractor performance dashboard is for KPI reporting, not live job operations.
What files are included?
The ZIP contains the Excel workbook and an Excel KPI Dashboard user manual.
About the Author
Built by PK – Microsoft Certified Professional with 15+ years of Excel, Google Sheets, and Power BI experience. Founder of NextGenTemplates, reaching 300K+ subscribers across YouTube channels. Every template is hand-built and tested before release.
Explore Related Templates
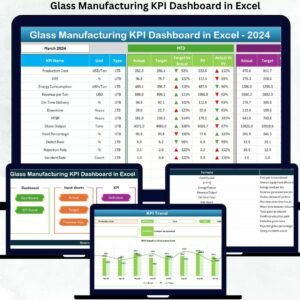
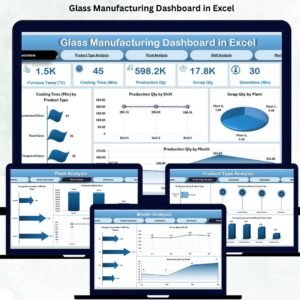
Compare the Glass Installation KPI Scorecard in Google Sheets, Roofing Contractor KPI Dashboard in Excel, and Flooring Installation KPI Dashboard in Excel. For production-focused reporting, see the Glass Manufacturing KPI Dashboard and browse the Excel KPI Dashboard collection.
Download this glass installation KPI dashboard and turn validated monthly figures into a repeatable management review.
Watch the step-by-step video Demo:
Last updated: 10 September 2026.
Compatibility and Requirements
- Works in Microsoft Excel desktop (Excel 2016 or later, or Microsoft 365).
- You pick the reporting month from a dropdown on the KPI Dashboard sheet. Microsoft explains dropdowns in Create a drop-down list.
































Reviews
There are no reviews yet.