

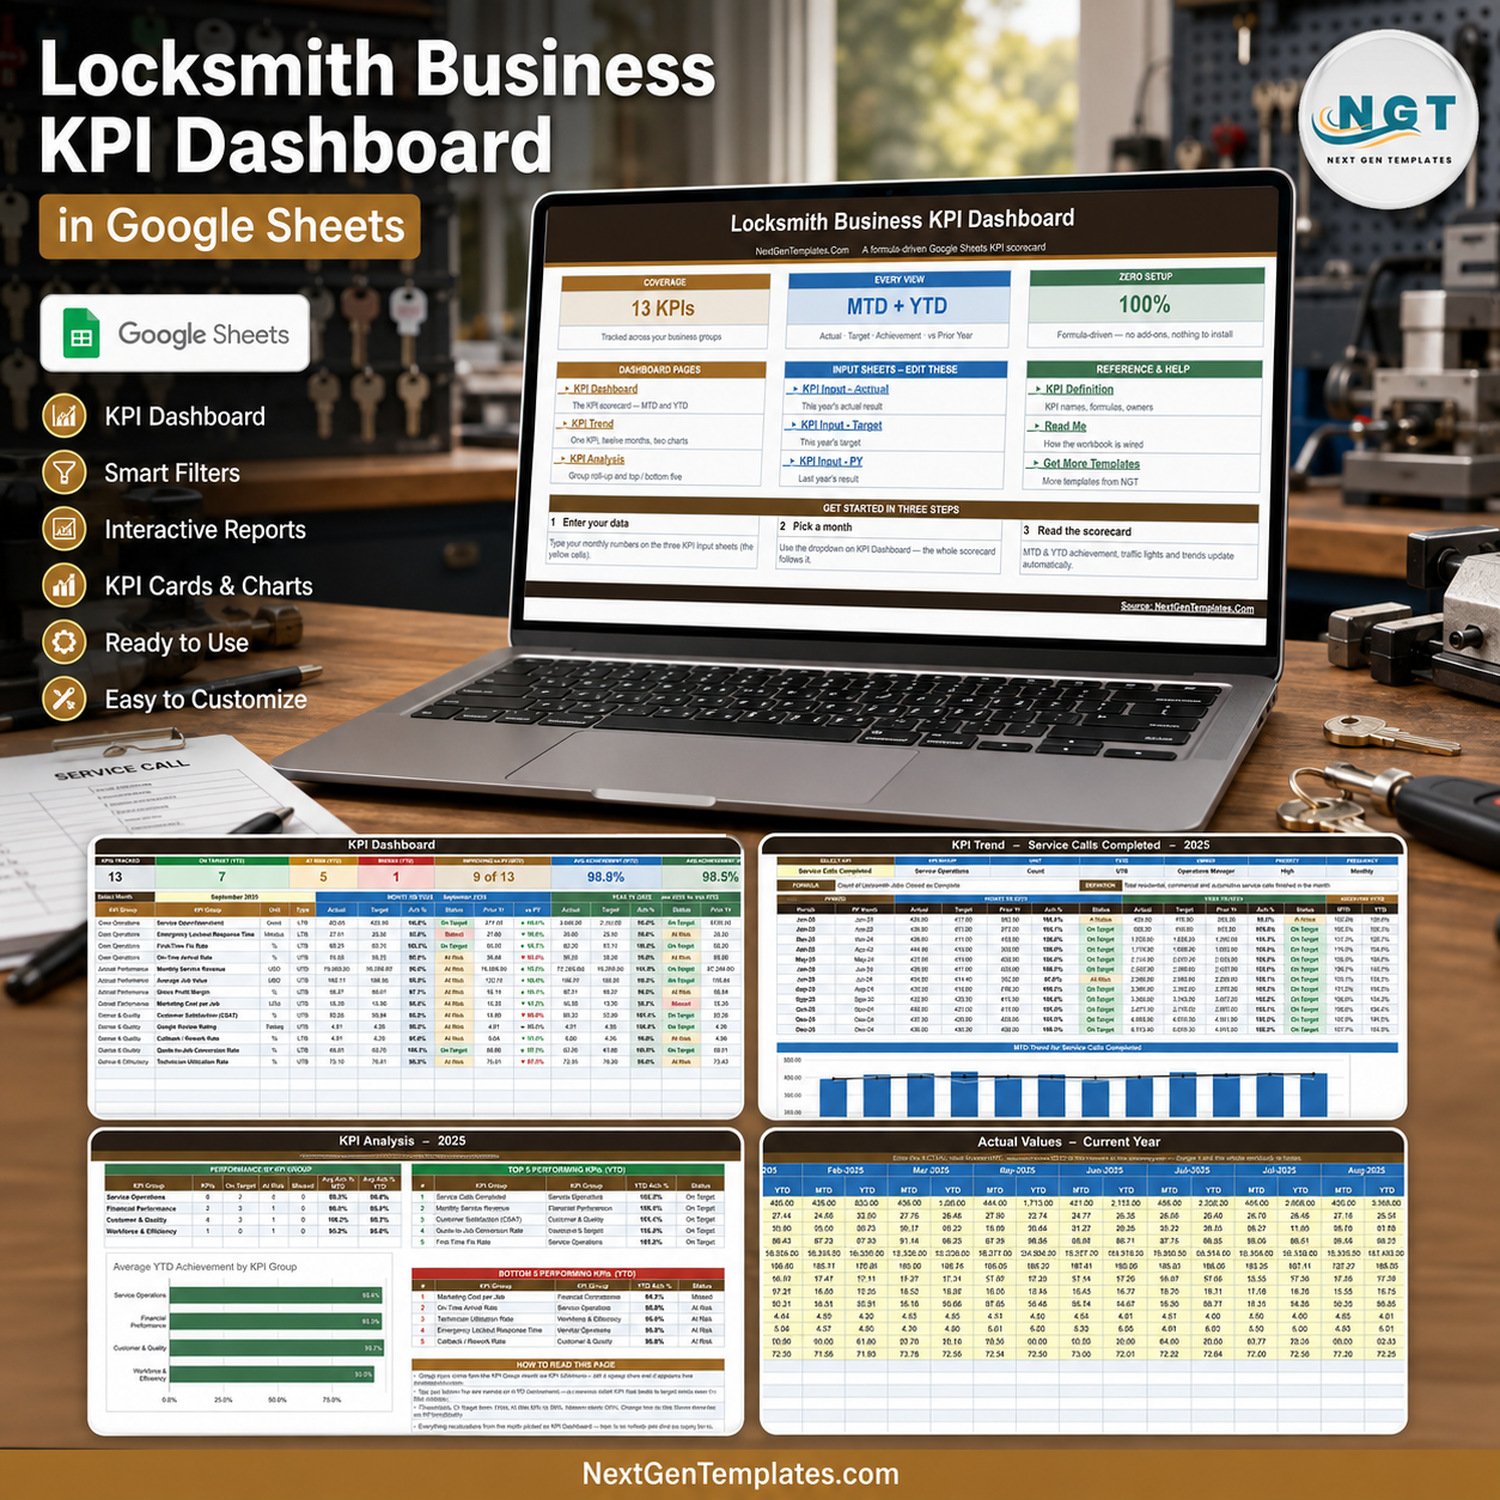

13 locksmith KPIs, 4 business groups, 12 monthly periods, and MTD plus YTD views come together in one formula-driven Google Sheets workbook. The Locksmith Business KPI Dashboard in Google Sheets compares every actual against its target and against last year, ranks the top and bottom five metrics, and shows red, amber, and green status at a glance. You pay once, receive an editable copy in your own Google Drive, and can read every formula before you rely on it. No add-on, no connector, no subscription.
Key Features of the Locksmith Business KPI Dashboard in Google Sheets
- 13 locksmith KPIs: service volume, response and reliability, revenue and margin, customer sentiment, and technician utilization on one screen.
- Month picker: pick a month on the KPI Dashboard sheet and the entire scorecard, the trend page, and the analysis page follow it.
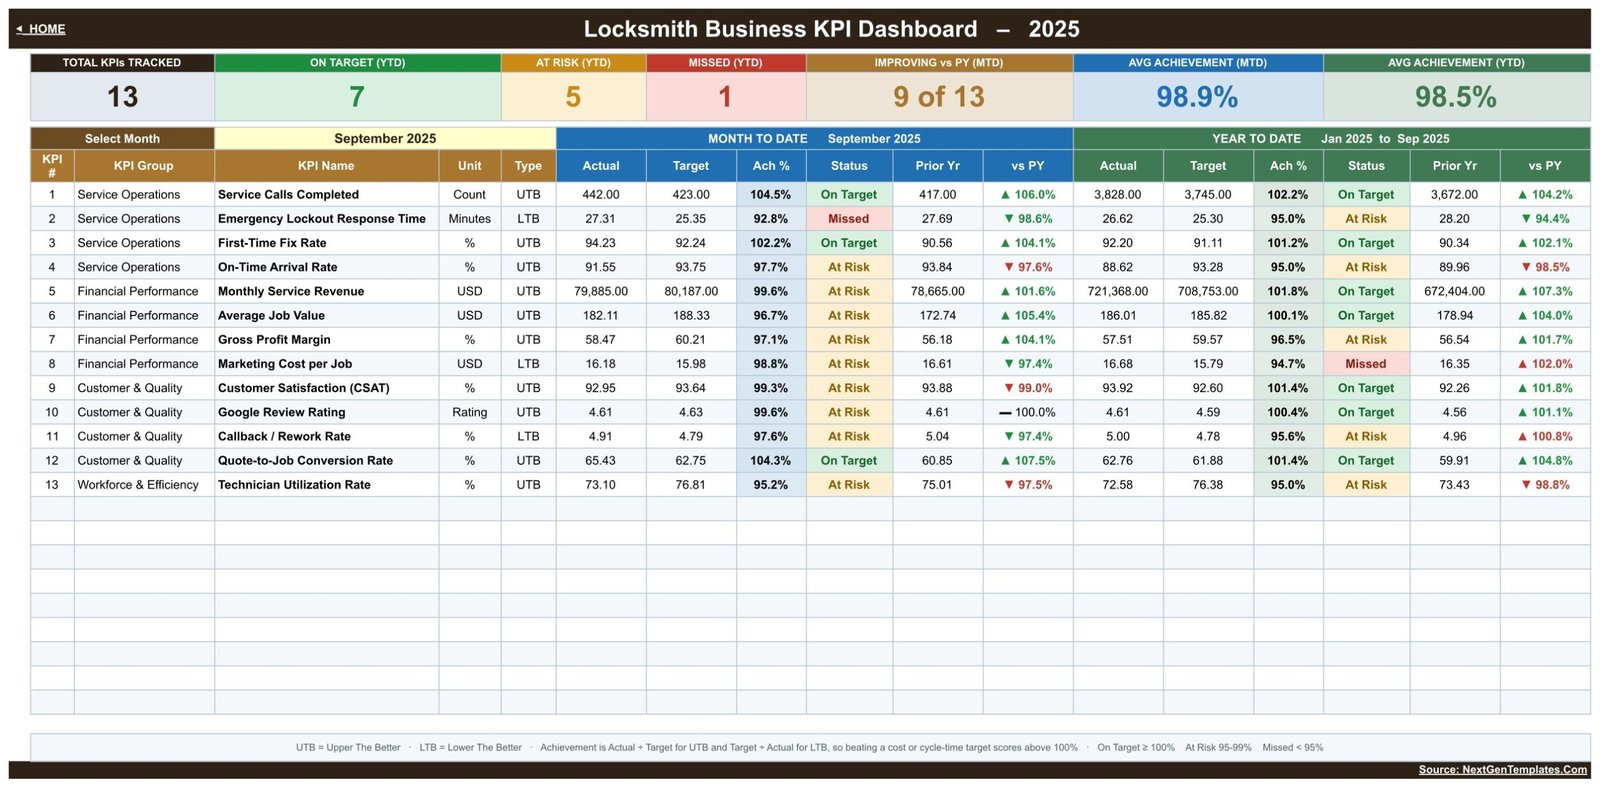
- MTD and YTD side by side: each KPI shows Actual, Target, Achievement %, Status, Prior Year, and vs PY for both the month and the year so far.
- Direction-aware scoring: 10 upper-the-better and 3 lower-the-better metrics are flagged UTB or LTB, so beating a response-time or cost target scores above 100% rather than below it.
- Traffic lights you control: On Target from 100%, At Risk 95% to 99%, Missed below 95% – thresholds sit in the Status formulas and can be changed.
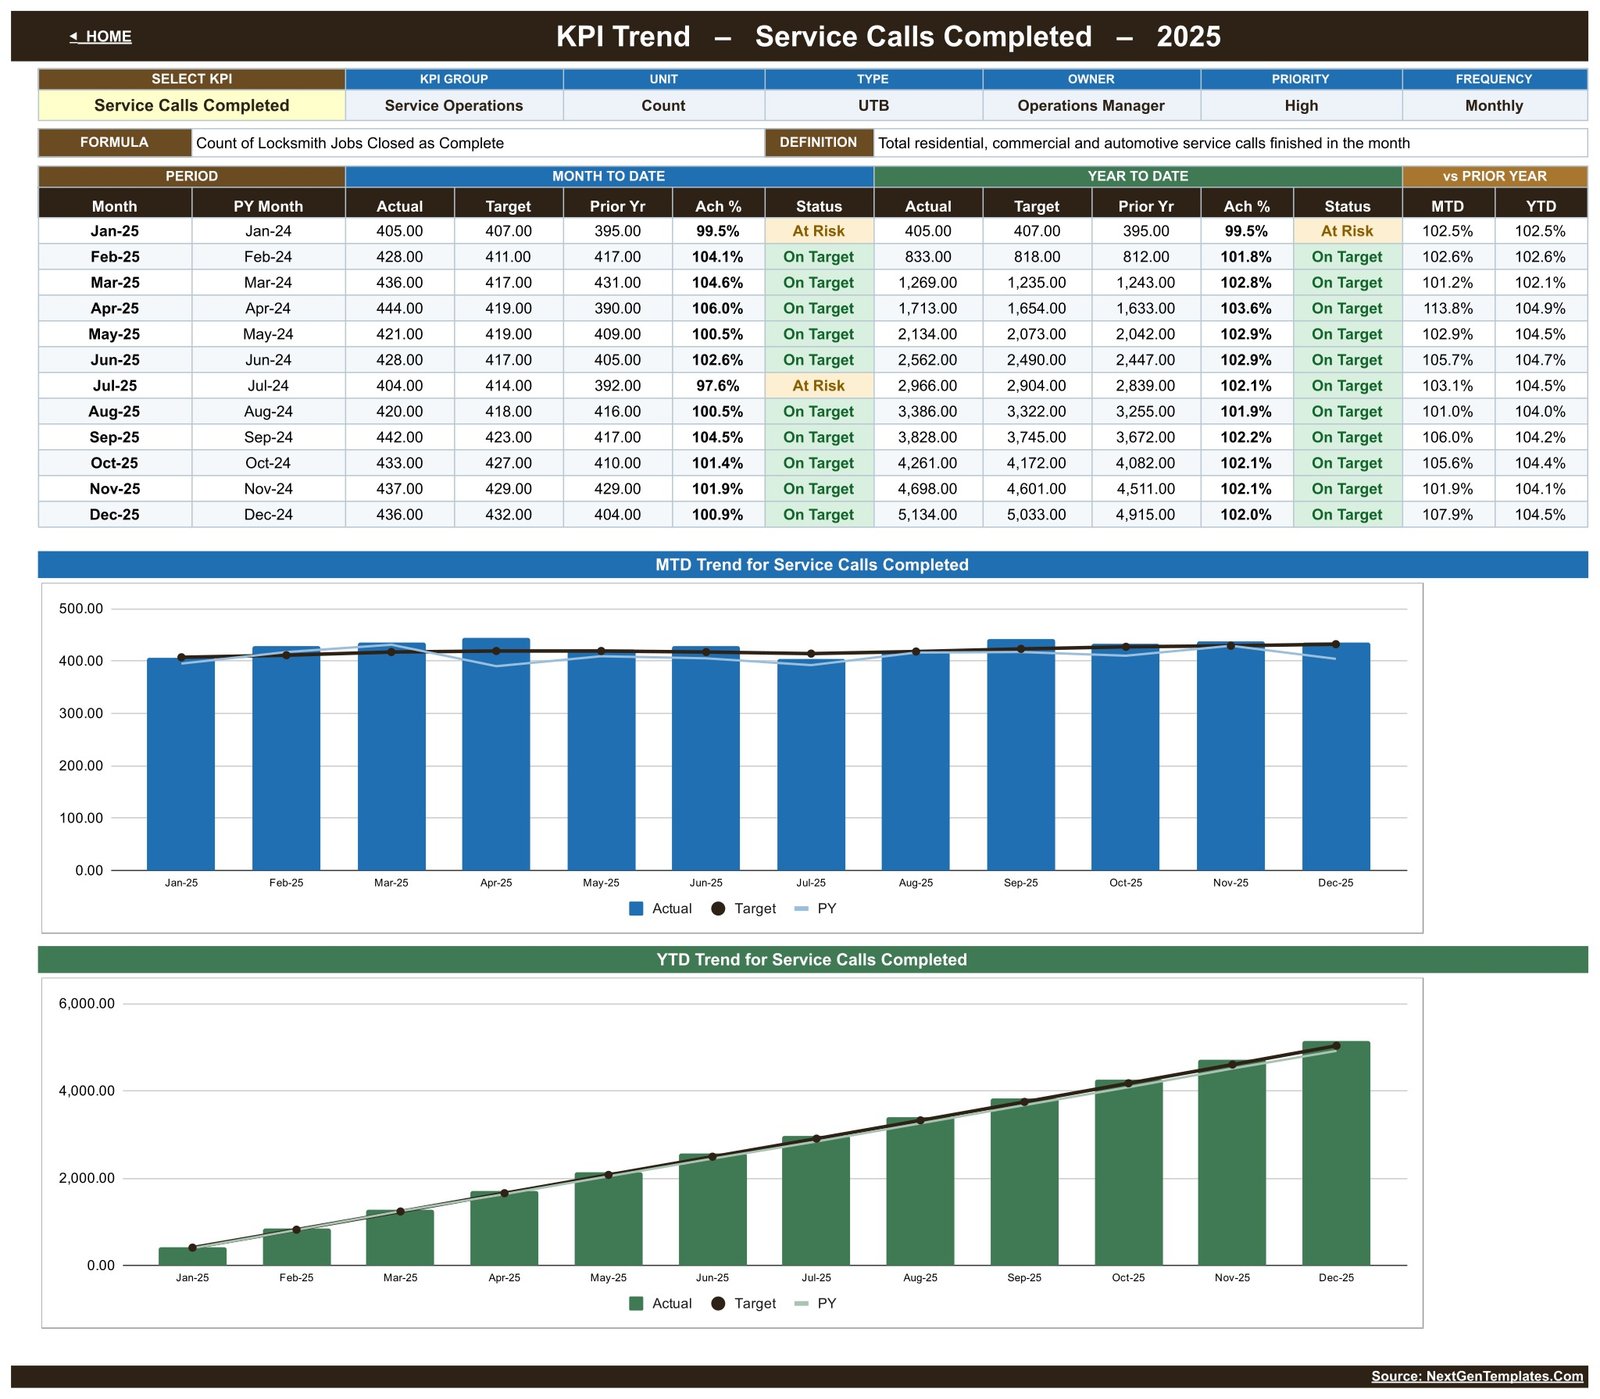
- KPI Trend page: choose one KPI and read twelve months of MTD and YTD Actual, Target and Prior Year, with two charts underneath.
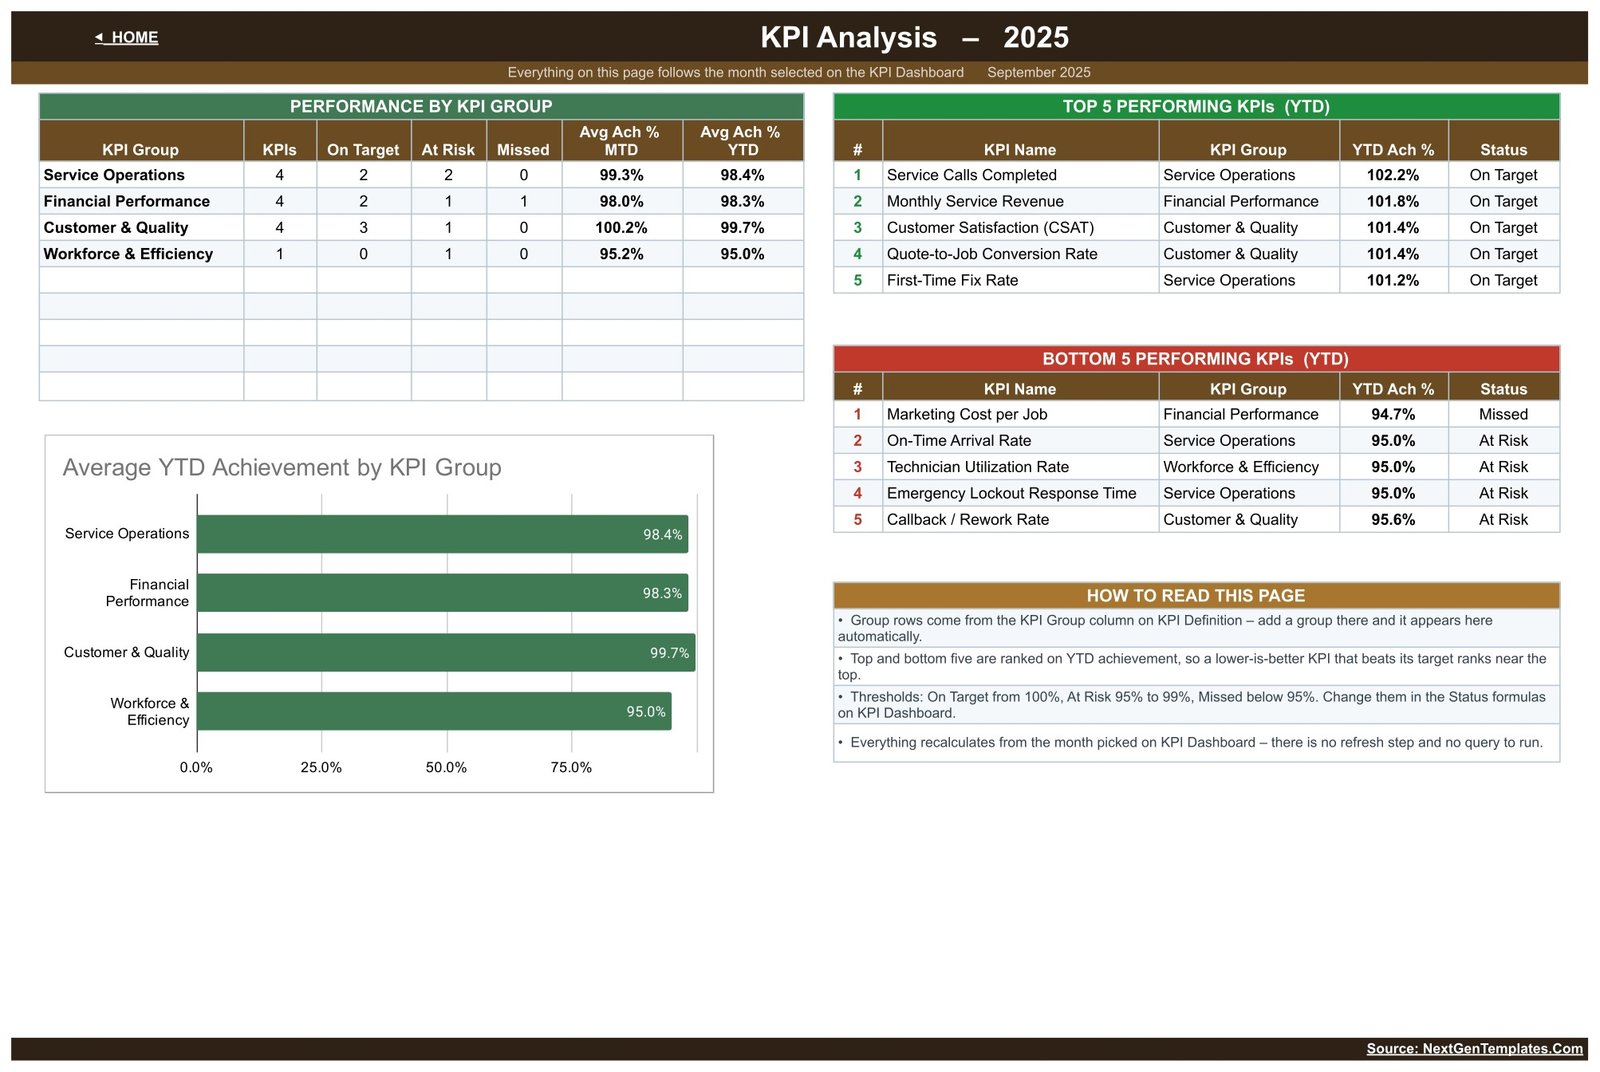
- KPI Analysis page: group roll-ups plus the top five and bottom five KPIs by YTD achievement, ranked automatically.
- Editable KPI register: names, groups, units, formulas, definitions, owners, priority and frequency are plain cells – rename a KPI and every sheet follows.
- Twelve months of sample data included: a worked September 2025 view so you can see the whole workbook running before you type anything.
What’s Inside the Locksmith Business KPI Dashboard in Google Sheets
KPI Dashboard: the main scorecard lists all 13 KPIs in their four groups. The sample September 2025 view shows 7 On Target, 5 At Risk and 1 Missed on YTD, 9 of 13 KPIs improving against prior year, and average achievement of 98.9% MTD and 98.5% YTD. Those figures are invented sample data, not industry benchmarks.
KPI Trend: pick a metric such as Service Calls Completed and read January to December – Actual, Target, Prior Year, achievement and status for both MTD and YTD, with an MTD column chart and a YTD column chart beneath the table.
KPI Analysis: group roll-ups for Service Operations, Financial Performance, Customer & Quality and Workforce & Efficiency, each with its KPI count, On Target / At Risk / Missed split and average achievement, plus a bar chart and the ranked top five and bottom five KPIs.
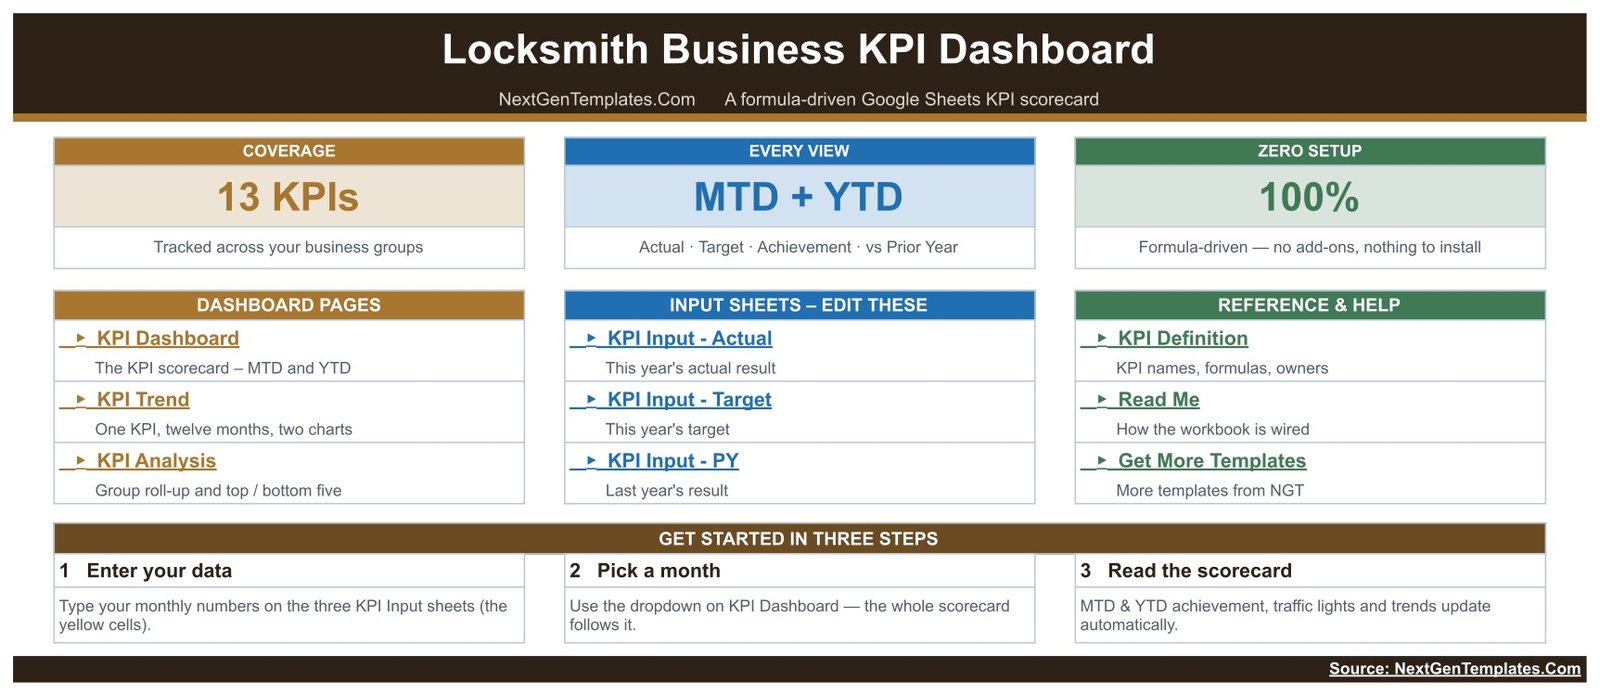
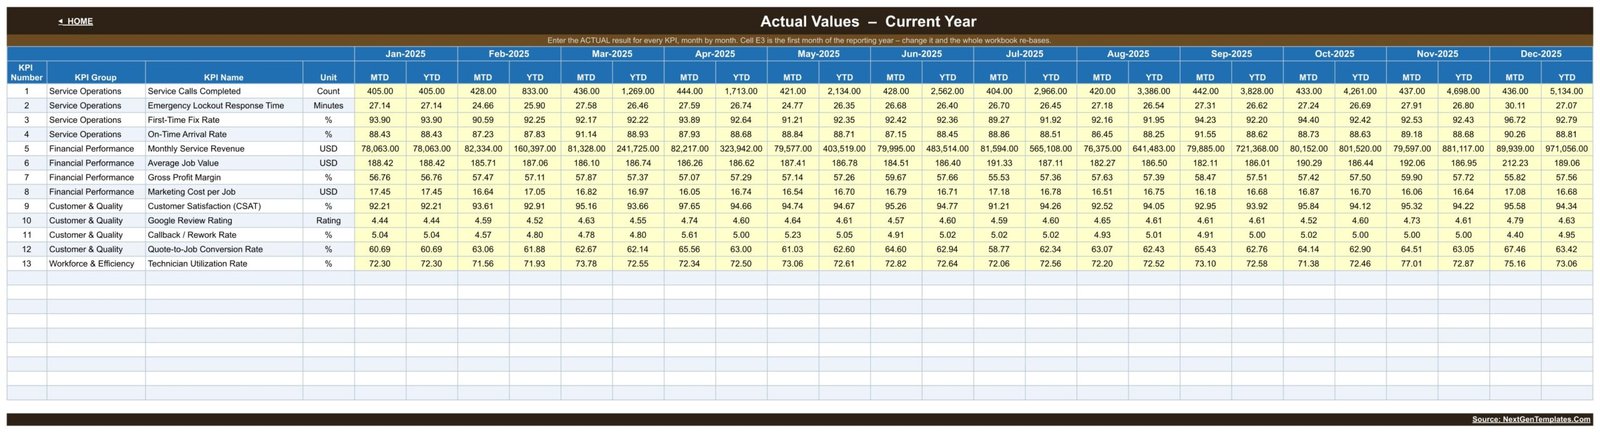
Three input sheets: KPI Input – Actual, KPI Input – Target and KPI Input – PY hold the monthly numbers in yellow cells. Everything else in the workbook is calculated from them, and the cumulative YTD column is built for you.
KPI Definition: the master list carries all 13 metrics – Service Calls Completed, Emergency Lockout Response Time, First-Time Fix Rate, On-Time Arrival Rate, Monthly Service Revenue, Average Job Value, Gross Profit Margin, Marketing Cost per Job, Customer Satisfaction (CSAT), Google Review Rating, Callback / Rework Rate, Quote-to-Job Conversion Rate and Technician Utilization Rate – each with its written formula, definition, UTB/LTB direction, owner, priority and frequency. Add or delete a row here and the rest of the workbook follows.

A Home page links every sheet, and a Read Me page explains how the workbook is wired.
Locksmith Business KPI Dashboard in Google Sheets vs. Excel vs. Paid Field Service Software – Where This Fits
| Area | This Google Sheets template | An Excel KPI workbook | Paid field service software |
|---|---|---|---|
| Cost | $8.99 sale price, one time | Template plus Microsoft 365 if needed | Recurring per-user subscription |
| Setup | Make a copy, replace the monthly numbers | Download and edit locally | Configuration and onboarding |
| Collaboration | Native browser sharing | Best through OneDrive | Native, normally seat-based |
| Custom KPIs | Editable definition register | Editable workbook | Depends on vendor plan |
| Five-user year-one cost | $8.99 total | Template plus licences | Usually hundreds or more |
| Dispatch, invoicing, job tickets | No | No | Usually yes |
| Where the numbers come from | You type monthly totals | You type monthly totals | Captured from live jobs |
Who This Template Is For – and Who It’s Not For
It is built for locksmith business owners, operations and dispatch managers, field service supervisors and the bookkeeper or office manager who already has monthly totals and wants one consistent review board instead of a fresh spreadsheet every month. It suits a single-van operator through to a small multi-technician shop that would rather share a Google Sheet than pay another per-seat subscription.
It is not dispatch, scheduling, routing, CRM, invoicing or job-management software, and it holds no customer, address, job or key records. It is a management reporting layer: you enter monthly totals and it turns them into a scorecard. It makes no statement about licensing, bonding, insurance, background checks, key control, restricted keyways or master-key security, and it is not evidence of any of them – those obligations stay with you and your local licensing authority.
How to Use the Locksmith Business KPI Dashboard in Google Sheets
- Open the downloaded PDF and click its Google Sheets link to make your own editable copy in your Drive.
- Read the KPI Definition page and adapt names, formulas, owners, priority and the UTB/LTB direction flag to how your shop measures work.
- Replace the sample figures on KPI Input – Actual, KPI Input – Target and KPI Input – PY, month by month.
- Pick your month on KPI Dashboard and read MTD and YTD achievement and status.
- Open KPI Trend for a single metric, and KPI Analysis for group roll-ups and the top and bottom five.
- Adjust the On Target / At Risk / Missed thresholds in the Status formulas if your bands are different.
Real-World Use Cases
A shop owner reviews Monthly Service Revenue, Average Job Value, Gross Profit Margin and Marketing Cost per Job together before changing call-out pricing or ad spend for the quarter.
A dispatch lead watches Emergency Lockout Response Time and On-Time Arrival Rate month over month, and can see immediately that a faster response scores above 100% because the metric is flagged lower-the-better.
A field service supervisor pairs First-Time Fix Rate with Callback / Rework Rate to see whether jobs are being finished properly on the first visit, then checks Technician Utilization Rate before adding a van.
An office manager reports Customer Satisfaction (CSAT), Google Review Rating and Quote-to-Job Conversion Rate at the monthly meeting from one page instead of three spreadsheets.
Frequently Asked Questions
Is this the KPI Dashboard or the KPI Scorecard?
This is the KPI Dashboard: 13 KPIs, a month picker, an MTD and YTD grid with traffic lights, a per-KPI Trend page, a group Analysis page and three monthly input sheets. The Locksmith Business KPI Scorecard in Google Sheets is a separate 10-KPI template built around KPI cards with sparklines and comparison dropdowns. They are different templates, not two copies of one.
Do I need a paid Google Workspace account?
No. A free Google account can copy, edit and share the workbook. It runs in the browser with no add-on, script or macro.
Can I change the 13 KPIs to my own?
Yes. The KPI Definition sheet is the master list – rename, add or delete rows there and the dashboard, trend, analysis and input sheets follow. Keep names identical across the definition and input tables so the lookups keep matching.
How are lower-is-better metrics scored?
Achievement is Actual divided by Target for UTB metrics and Target divided by Actual for LTB metrics. Emergency Lockout Response Time, Marketing Cost per Job and Callback / Rework Rate are the three LTB metrics here, so coming in under target scores above 100% and shows green.
Does it connect to my scheduling, phone or accounting system?
No. Monthly values are typed in. There is no API, import or automatic sync, which is also why nothing breaks when a vendor changes their software.
Does this cover licensing, bonding, insurance or key control?
No. It measures service and financial performance only. It contains no licensing, bonding, insurance, background-check, key-control or restricted-keyway records and is not evidence of compliance with any of them.
Are the numbers in the screenshots real?
No. Twelve months of sample data are supplied so the workbook is readable on first open. Every figure is invented for demonstration and should be replaced with yours.
Can several people use it at once?
Yes. Use normal Google Sheets sharing and give edit access only to whoever maintains the monthly inputs.
About the Author
Built by PK – Microsoft Certified Professional with 15+ years of Excel, Google Sheets, and Power BI experience. Founder of NextGenTemplates, reaching 300K+ subscribers across YouTube channels. Every template is hand-built and tested before release.
Explore Related Templates
- Locksmith Business KPI Scorecard in Google Sheets – the 10-KPI card-wall companion for the same trade.
- Swimming Pool Service KPI Dashboard in Google Sheets – the same dashboard build for a route-service business.
- Septic Tank Service KPI Dashboard in Google Sheets – another emergency call-out trade.
- Fencing Contractor KPI Dashboard in Google Sheets – the same month-picker scorecard for a contractor.
- Drywall Contractor KPI Dashboard in Google Sheets – trade KPIs with the same layout.
- Read the page-by-page walkthrough of the locksmith scorecard build on NeoTechNavigators before choosing between the two formats.
- Browse the Google Sheets KPI Dashboard category.
Turn last month’s job sheet into a review you can run in ten minutes. Get the Locksmith Business KPI Dashboard in Google Sheets for a one-time $8.99 sale price.
Watch the step-by-step video Demo:
Last updated: September 6, 2026.
Compatibility and Requirements
- Works in Google Sheets. You need a free Google account and a web browser.
- You pick the month from a dropdown on the KPI Dashboard sheet, and the KPI Trend sheet has a KPI dropdown. Google explains dropdowns in Create an in-cell dropdown list.
- The three input sheets use yellow cells for your monthly numbers. The rest of the workbook is calculated from them.
Related Templates for Service Businesses
- Locksmith Business KPI Scorecard in Excel: the locksmith scorecard for Excel users
- SaaS Business KPI Dashboard in Google Sheets: the same month-picker dashboard style for another business type
- Subscription Business KPI Dashboard in Google Sheets: another Google Sheets KPI dashboard
- Sales Business Intelligence Dashboard in Google Sheets: a sales view to use next to your service KPIs
- Google Sheets Business Pack (Pro): 14 business templates for Google Sheets in one download
Browse all Google Sheets KPI dashboards.





























Reviews
There are no reviews yet.