

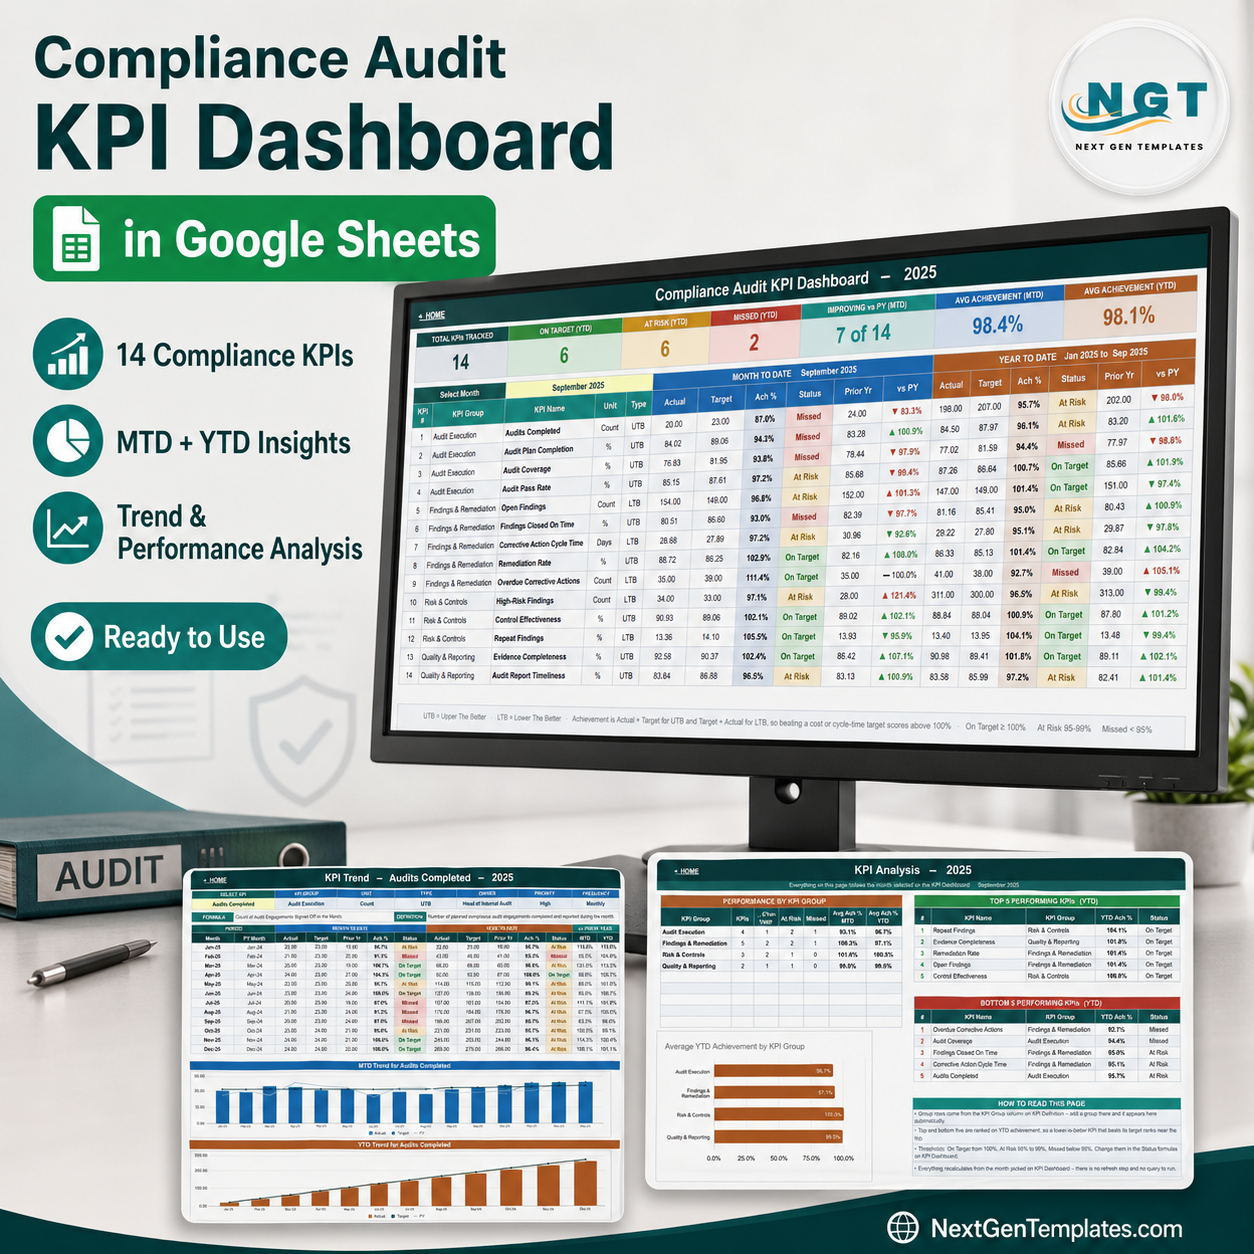

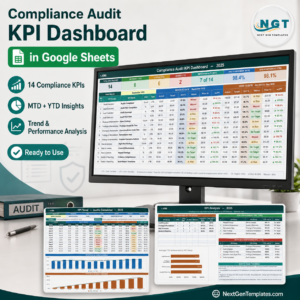
The Compliance Audit KPI Dashboard in Google Sheets turns a month of audit-function numbers into a 14-KPI scorecard across 4 KPI groups – Audit Execution, Findings & Remediation, Risk & Controls, and Quality & Reporting. Pick a month from one dropdown and every figure on the page re-calculates: month-to-date and year-to-date actual, target, achievement percentage, prior-year comparison and a traffic light. It is formula-driven only – no add-ons, no Apps Script, no connectors, nothing to install. Works in any Google account, and you keep it forever. If it is not the right fit, tell us within 30 days and we will refund it.
Read this before you buy. This is a spreadsheet for tracking audit KPIs. It is not an audit management system: it holds no workpapers, no evidence files and no engagement records, and it does not route or assign corrective actions. It certifies nothing, it is not evidence of compliance with any standard or regulation, and it offers no legal or regulatory advice. The numbers in it are the numbers you type in.
Key Features of the Compliance Audit KPI Dashboard in Google Sheets
- 14 named audit KPIs in 4 groups – Audit Execution (4), Findings & Remediation (5), Risk & Controls (3), Quality & Reporting (2). Rename, add or delete any of them on the KPI Definition sheet and every other sheet follows.
- One month dropdown drives the whole workbook – the sample file opens on September 2025. Change it and the KPI Dashboard, KPI Trend and KPI Analysis pages all re-base together.
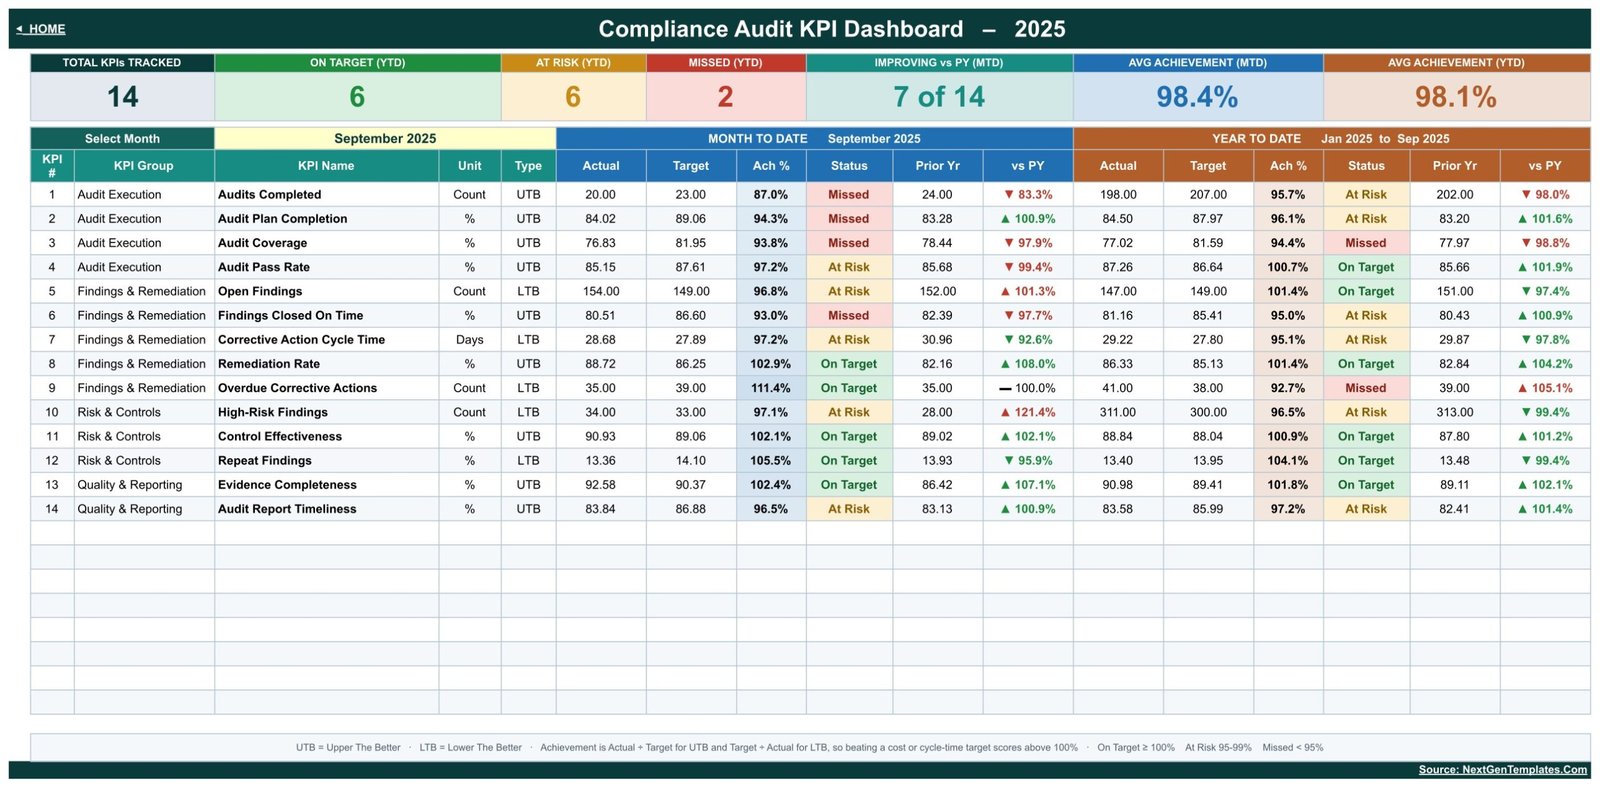
- MTD and YTD side by side – each KPI row carries Actual, Target, Achievement %, Status, Prior Yr and vs PY for the month, then the same six columns again for the year to date.
- Traffic lights with published thresholds – On Target from 100%, At Risk 95% to 99%, Missed below 95%. The thresholds live in the Status formulas on the KPI Dashboard, so you can move them.
- Upper-the-better and lower-the-better handled properly – Achievement is Actual ÷ Target for UTB KPIs and Target ÷ Actual for LTB KPIs, so beating a target on Open Findings, Overdue Corrective Actions, Repeat Findings, High-Risk Findings or Corrective Action Cycle Time scores above 100% instead of below it.
- Seven summary tiles across the top – Total KPIs Tracked, On Target (YTD), At Risk (YTD), Missed (YTD), Improving vs PY (MTD), Avg Achievement (MTD) and Avg Achievement (YTD). In the sample month those read 14, 6, 6, 2, 7 of 14, 98.4% and 98.1%.
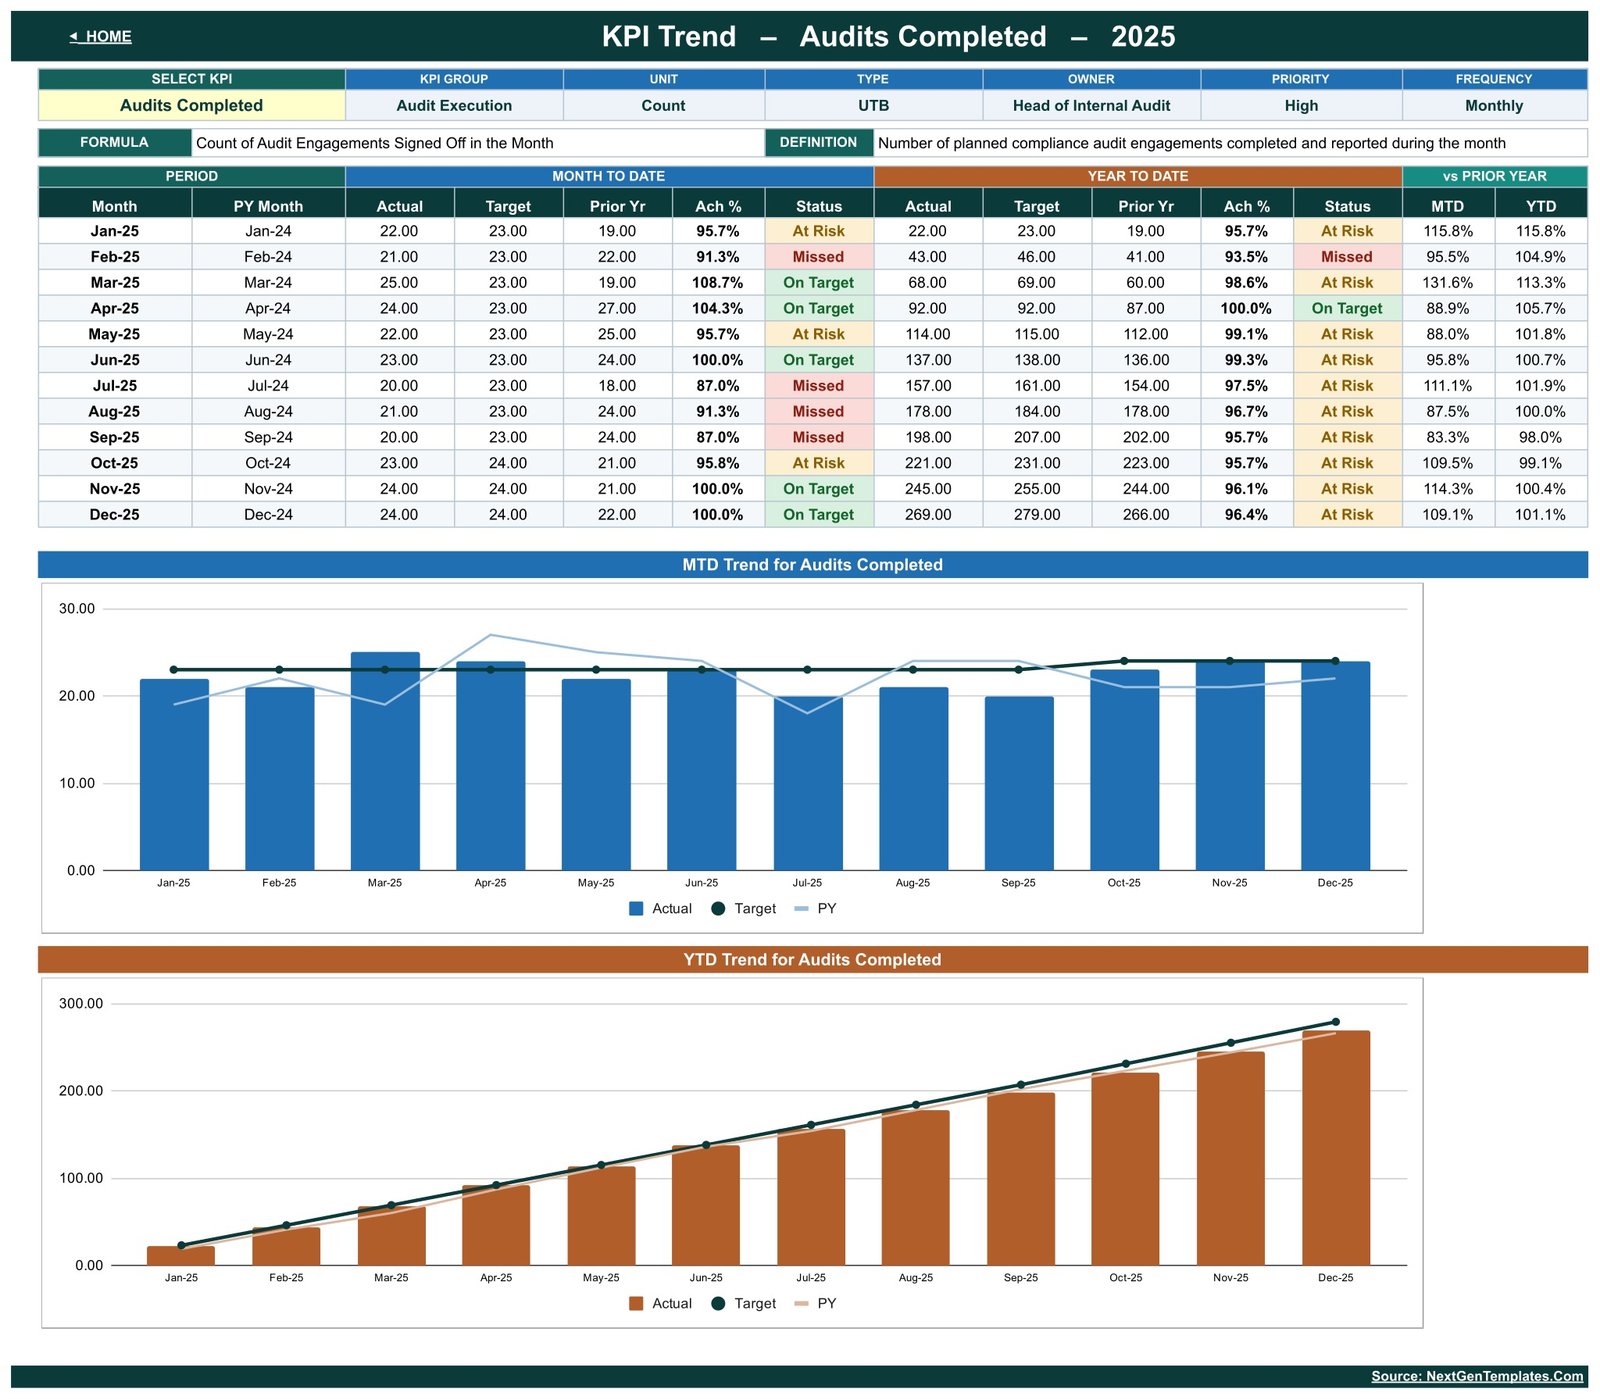
- A dedicated KPI Trend page – pick one KPI, get all twelve months in a table plus an MTD chart and a YTD chart, each with Actual bars, a Target line and a prior-year line.
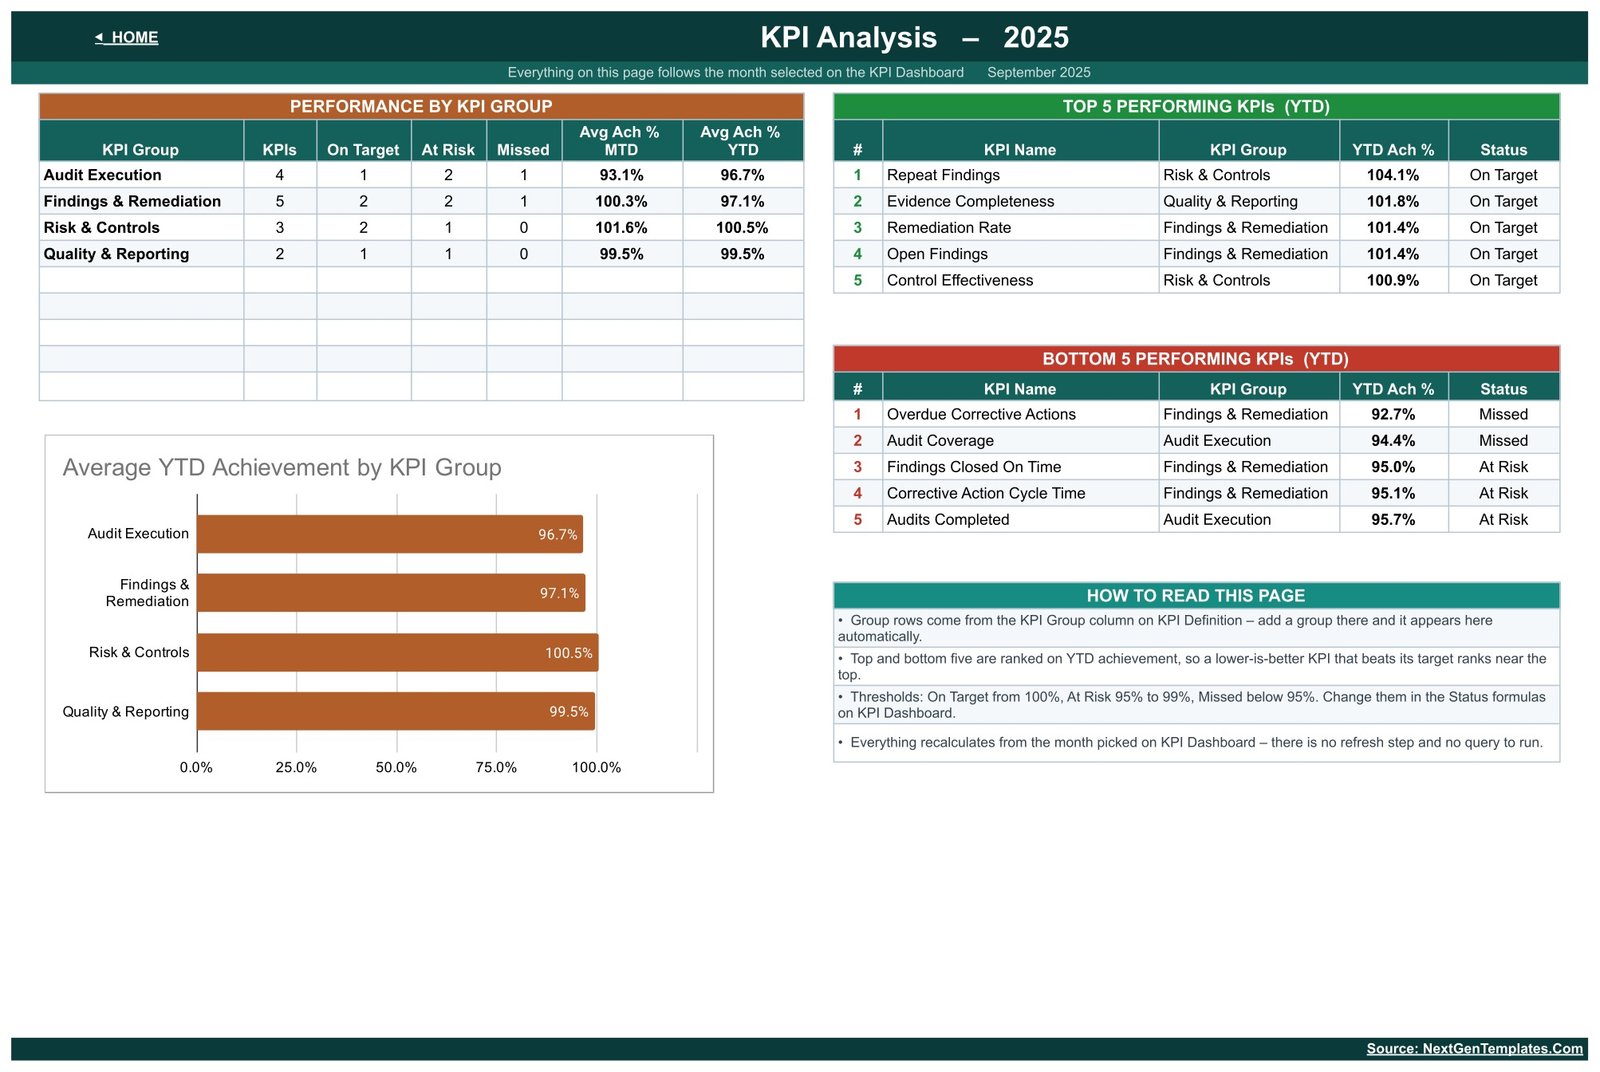
- A KPI Analysis page – Performance by KPI Group, Top 5 and Bottom 5 performing KPIs on YTD achievement, and an Average YTD Achievement by KPI Group bar chart.
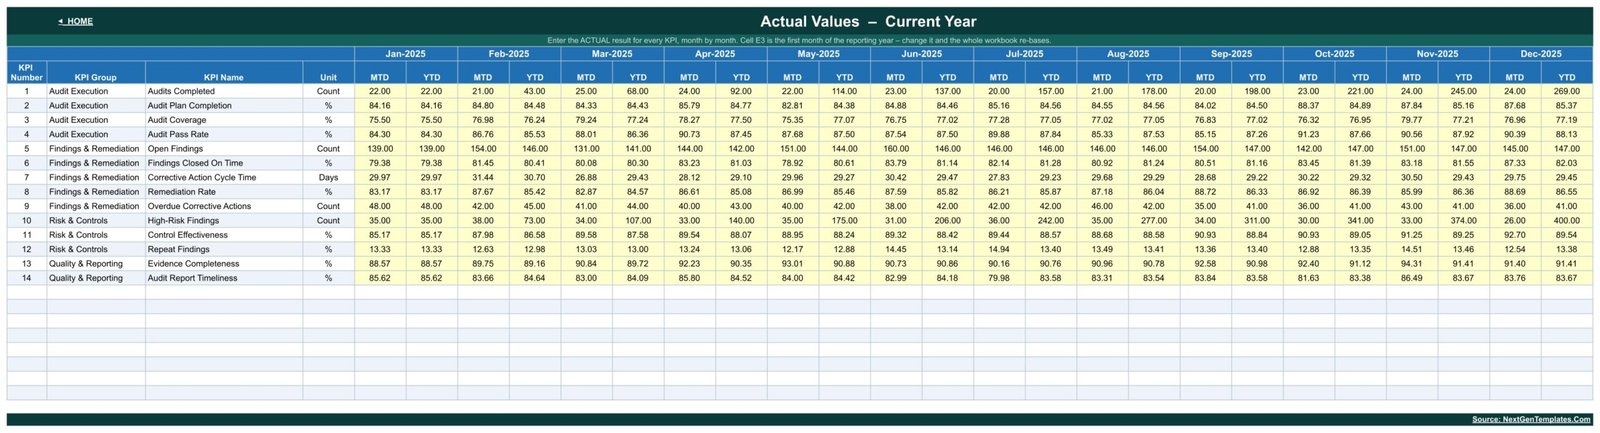
- Three plain input sheets – KPI Input – Actual, KPI Input – Target and KPI Input – PY. You type into yellow cells, month by month, and nothing else.
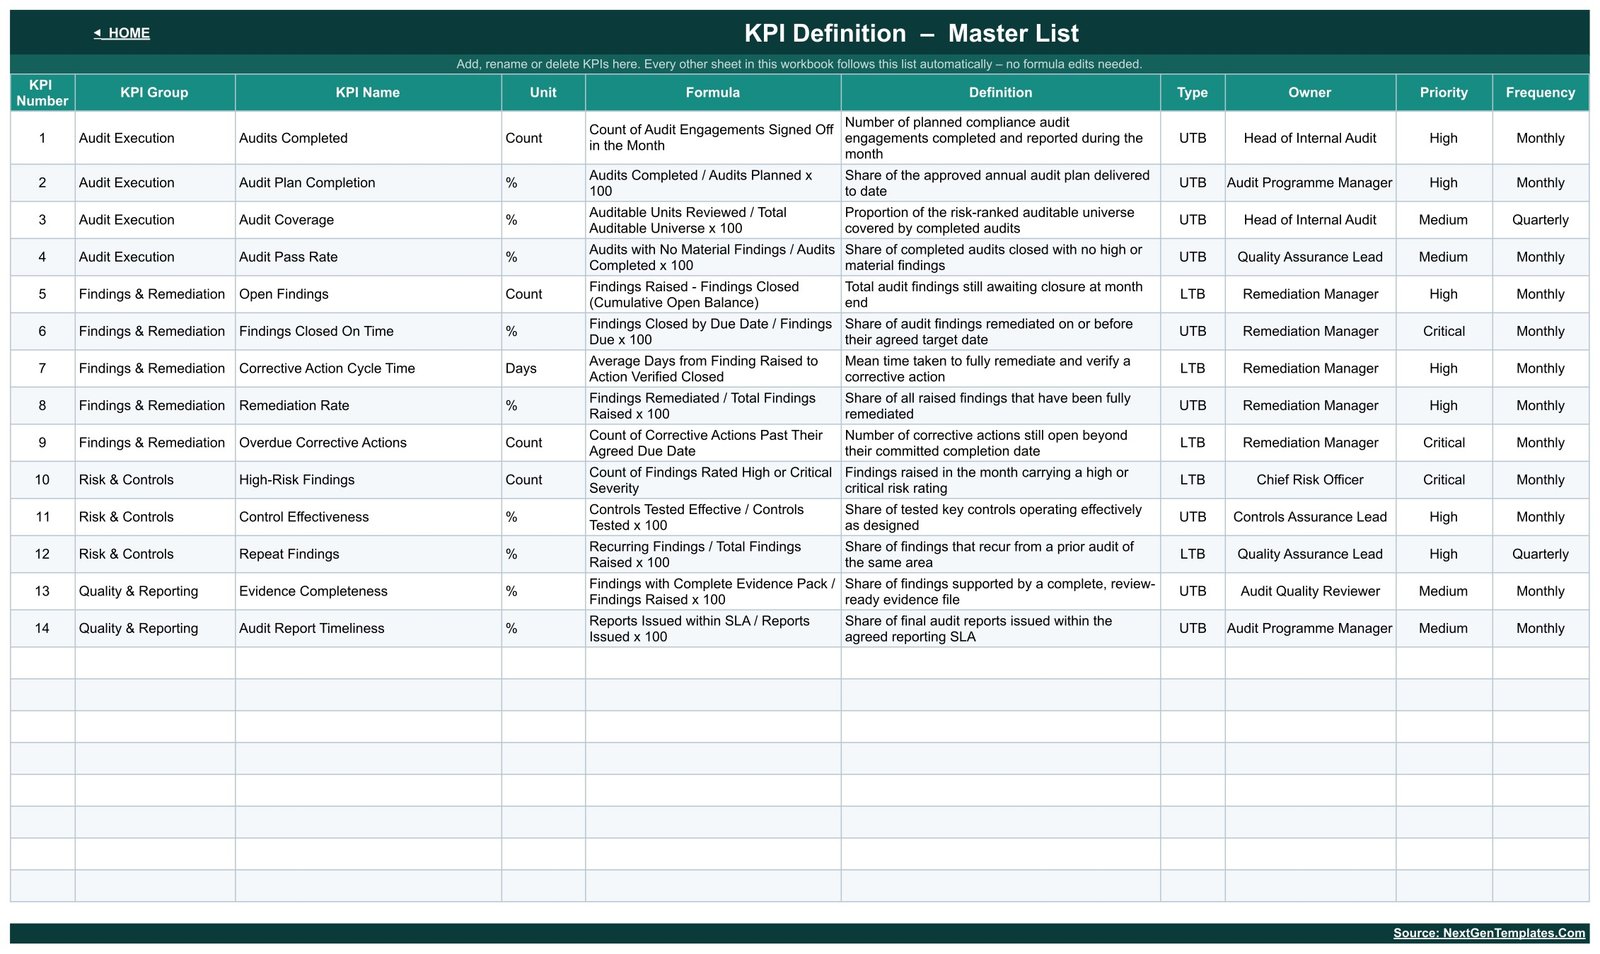
- A documented KPI Definition sheet – formula, definition, unit, type, owner, priority and reporting frequency for all 14 KPIs, so the person who inherits the file knows what each number means.
What’s Inside the Compliance Audit KPI Dashboard in Google Sheets
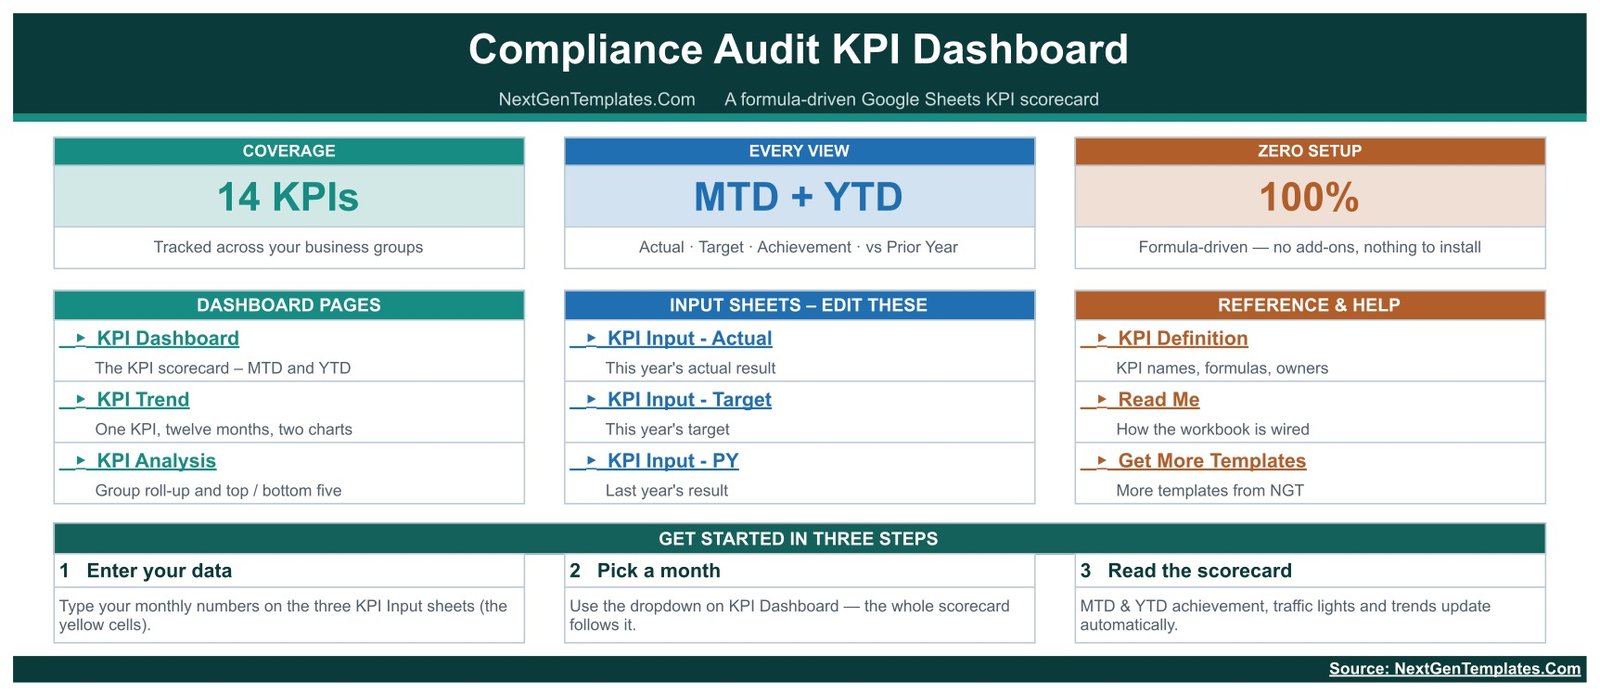
Home. A launcher with three coverage tiles, links to the three dashboard pages, links to the three input sheets, links to KPI Definition and Read Me, and a three-step start guide.
KPI Dashboard. The scorecard. Seven tiles on top, the month dropdown below them, then one row per KPI: KPI number, group, name, unit, type, then the Month-To-Date block (Actual, Target, Ach %, Status, Prior Yr, vs PY) and the Year-To-Date block (the same six columns, with the YTD span labelled – Jan 2025 to Sep 2025 in the sample).
KPI Trend. One KPI at a time. The header repeats its group, unit, type, owner, priority, frequency, formula and definition, then twelve monthly rows with MTD and YTD actual, target, prior year, achievement and status, plus MTD-vs-PY and YTD-vs-PY columns. Two charts sit underneath.
KPI Analysis. Group roll-up – KPI count, On Target / At Risk / Missed counts and average MTD and YTD achievement per group – alongside Top 5 and Bottom 5 tables ranked on YTD achievement, a horizontal bar chart, and a How To Read This Page panel that explains the ranking and the thresholds.
KPI Input – Actual, Target and PY. Three identical grids: one row per KPI, twelve month columns, MTD and YTD side by side. Cell E3 sets the first month of the reporting year, so a July-to-June financial year is a one-cell change.
KPI Definition. The master list. Add a row here and it appears on every other sheet with no formula edits.
Read Me explains how the workbook is wired, and Get More Templates links back to the NextGenTemplates library.
Compliance Audit KPI Dashboard in Google Sheets vs. Excel vs. Paid GRC Software – Where This Fits
| This template (Google Sheets) | Excel KPI dashboard | Paid GRC / audit software | |
|---|---|---|---|
| Cost | 8.99 one time | 14.99 one time | 3,000 – 30,000+ per year |
| Platform | Google Sheets, any browser | Microsoft Excel, desktop | Vendor-hosted web application |
| Setup time | Make a copy, type your numbers – under an hour | Download, enable editing, type your numbers | Weeks of implementation and configuration |
| Real-time team collaboration | Yes, native Google Sheets sharing | Only via OneDrive co-authoring | Yes, with roles and permissions |
| Mobile access | Google Sheets mobile app | Excel mobile app | Vendor mobile app |
| Customizable KPIs and fields | Yes – edit the KPI Definition sheet | Yes | Usually configurable, sometimes chargeable |
| Share with a link | Yes | No, files are emailed around | Yes, inside the platform |
| Year-1 cost at 5 users | 8.99 total | 14.99 total | 15,000 – 150,000+ |
| Stores audit evidence and workpapers | No | No | Yes |
| Routes and assigns corrective actions | No – owners are named text, not workflow | No | Yes |
| Produces a compliance certificate or attestation | No | No | No – certification comes from an accredited body, not software |
The honest position: if your audit function needs evidence storage, an approval workflow and an access-controlled audit trail, buy GRC software. If what you actually need is a monthly KPI page the audit committee can read in five minutes, this costs 8.99 and is finished this afternoon.
Who This Template Is For – and Who It’s Not For
It is for internal audit and compliance teams who already run their audits somewhere else and want a clean monthly scorecard on top; heads of internal audit reporting to an audit committee; quality and assurance leads tracking control effectiveness and repeat findings; and small teams who cannot justify a GRC licence.
It is not for you if you need the workbook to store evidence packs, hold engagement workpapers, generate audit reports, notify action owners, or enforce segregation of duties. It is not for you if you expect it to pull numbers automatically from a GRC or ERP system – there is no connector, and every figure is typed. And it is not for you if you are looking for something that will make an organisation compliant. A spreadsheet cannot do that; it can only show you the numbers you feed it.
How to Use the Compliance Audit KPI Dashboard in Google Sheets
- Make your own copy. Open the shared file and use File > Make a copy. The original stays read-only for everyone else.
- Review the KPI Definition sheet. Keep the 14 KPIs that suit you, rename the ones that do not, delete the rest and add your own. Set each one’s group, unit, type (UTB or LTB), owner, priority and frequency.
- Set your reporting year. Cell E3 on each KPI Input sheet is the first month. Change it and the whole workbook re-bases.
- Clear the sample data and enter yours. Type monthly figures into the yellow cells on KPI Input – Actual, then your targets on KPI Input – Target, then last year’s results on KPI Input – PY.
- Pick a month on the KPI Dashboard. The dropdown drives the tiles, the traffic lights, the KPI Trend page and the KPI Analysis page at once.
- Adjust the thresholds if you want. On Target from 100%, At Risk 95-99% and Missed below 95% are set in the Status formulas on the KPI Dashboard sheet.
- Share it. Give the audit committee view access and your team edit access – the usual Google Sheets sharing rules apply, and you control them.
Real-World Use Cases
Priya, Head of Internal Audit at a mid-size manufacturer. She reports to the audit committee quarterly and to the CFO monthly. Audits Completed, Audit Plan Completion and Audit Coverage go straight onto her one-page pack; the Bottom 5 table on the KPI Analysis page tells her which two KPIs she will be asked about before anybody asks.
Daniel, Remediation Manager at a financial services firm. He owns five of the 14 KPIs. Open Findings, Findings Closed On Time, Corrective Action Cycle Time, Remediation Rate and Overdue Corrective Actions are all lower-the-better or upper-the-better with the maths already the right way round, so his 35 overdue actions against a target of 39 reads as 111.4% and On Target rather than a red number he has to explain.
Meera, Quality Assurance Lead in a hospital group. She uses the KPI Trend page on Repeat Findings and Audit Pass Rate to show a twelve-month direction rather than a single month, because a compliance conversation about one month is rarely a useful one.
Frequently Asked Questions
Does this make my organisation compliant, or certify anything?
No. It is a spreadsheet that displays KPI numbers you enter. It certifies nothing, it is not evidence of compliance with any standard or regulation, and it does not constitute legal or regulatory advice. Certification comes from an accredited body assessing your organisation, never from a template.
Is this an audit management system?
No. It does not store evidence, hold workpapers, manage engagements or route corrective actions. It sits on top of whatever you already use to run audits and summarises the results.
Is it aligned to a particular audit or compliance standard?
It is deliberately standard-neutral. The 14 KPIs are common audit-function measures, not a mapping to any named framework. If your framework requires particular metrics, replace ours with yours on the KPI Definition sheet.
Do I need any add-ons or Apps Script?
No. Every calculation is a native Google Sheets formula. Nothing to install, nothing to authorise, no macros to enable.
Can I change the KPIs?
Yes, and it is a first-class operation rather than a workaround. The KPI Definition sheet is the master list – add, rename or delete rows there and the dashboard, trend, analysis and input sheets all follow.
Will it pull numbers from my GRC or ERP system automatically?
No. There is no connector and no import routine. You type the monthly figures, or paste them from an export.
What is the sample data in the file?
Twelve months of illustrative 2025 figures so every page shows its behaviour on arrival. Clear it and enter your own – it is invented sample data, not benchmark data, and it is not drawn from any real organisation.
About the Author
Built by PK – Microsoft Certified Professional with 15+ years of Excel, Google Sheets, and Power BI experience. Founder of NextGenTemplates, reaching 300K+ subscribers across YouTube channels. Every template is hand-built and tested before release.
Explore Related Templates
- Compliance Audit KPI Dashboard in Excel – the same subject built as an Excel workbook. Buy that one if your audit committee pack lives in Excel and you do not want a browser-based file.
- Compliance Audit Tracker in Google Sheets – a record-level tracker for individual audits, findings and corrective actions. Different job: that one lists the items, this one measures the function. They pair well.
- Audit & Internal Controls Dashboard in Google Sheets – the analytical dashboard family, with slicers and charts over a data table rather than a month-picker scorecard.
- Corporate Governance KPI Dashboard in Google Sheets – the same scorecard structure for board and governance measures.
- Workplace Safety KPI Dashboard in Google Sheets – the same structure again for EHS teams.
- Browse the full Google Sheets KPI Dashboard category or the wider Google Sheets template library.
Get the Compliance Audit KPI Dashboard in Google Sheets
One purchase, one PDF, one “Make a copy” link, and a 14-KPI audit scorecard that recalculates from a single dropdown. No subscription, no add-ons, no implementation project. Add it to your cart and make your copy today.
Watch the step-by-step video Demo:
Last updated: 26 August 2026.





























Reviews
There are no reviews yet.