

Hypermarkets KPI Dashboard in Excel
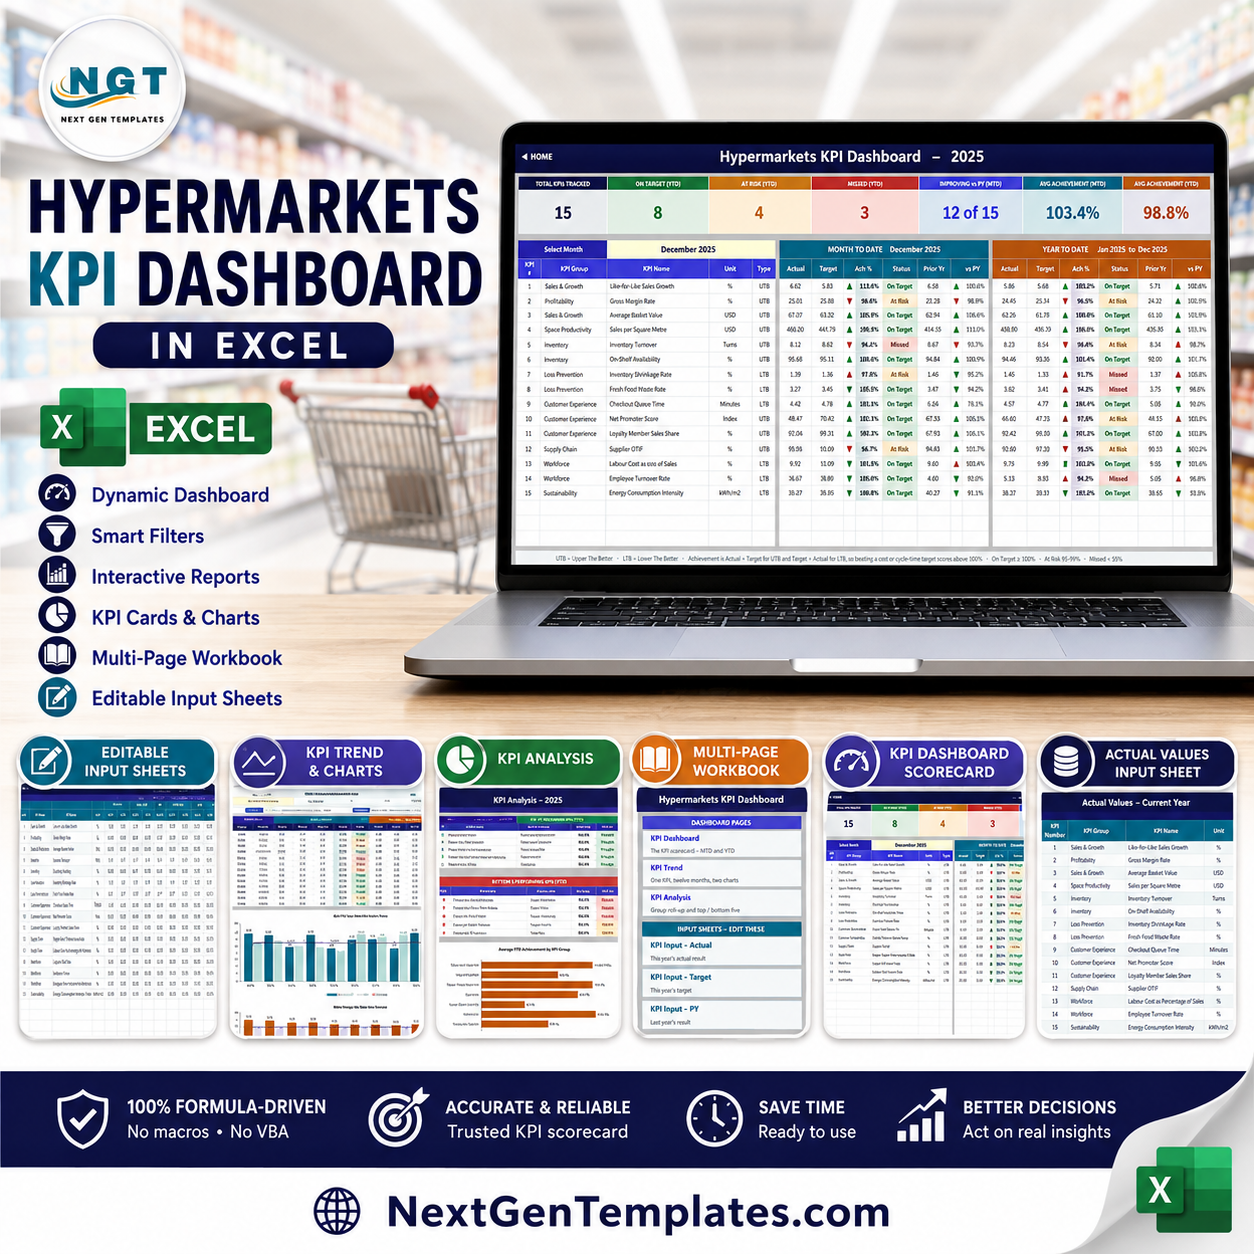
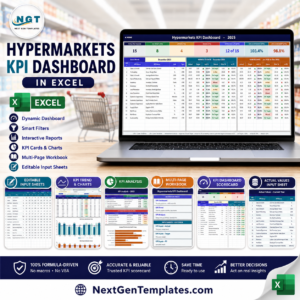
A hypermarket is judged on a handful of numbers that pull in opposite directions. Push basket value and you can bruise margin. Cut labour cost and the checkout queue grows. Squeeze inventory and on-shelf availability slips. The Hypermarkets KPI Dashboard in Excel puts all of those numbers on one page, for one month at a time, with a target beside each one and a colour that tells you immediately whether it was hit.
This is a KPI scorecard, not an analytical dashboard. There is no transaction table, no pivot cache and no data model. You type a monthly result, a monthly target and last year’s monthly result for each KPI, and the workbook does the achievement maths, the direction logic, the traffic lights, the year-to-date roll-up and the charts. Every cell is an ordinary worksheet formula – VLOOKUP, MATCH, INDEX, COUNTIF – so anyone on your team can trace it, extend it or audit it.
Key Features
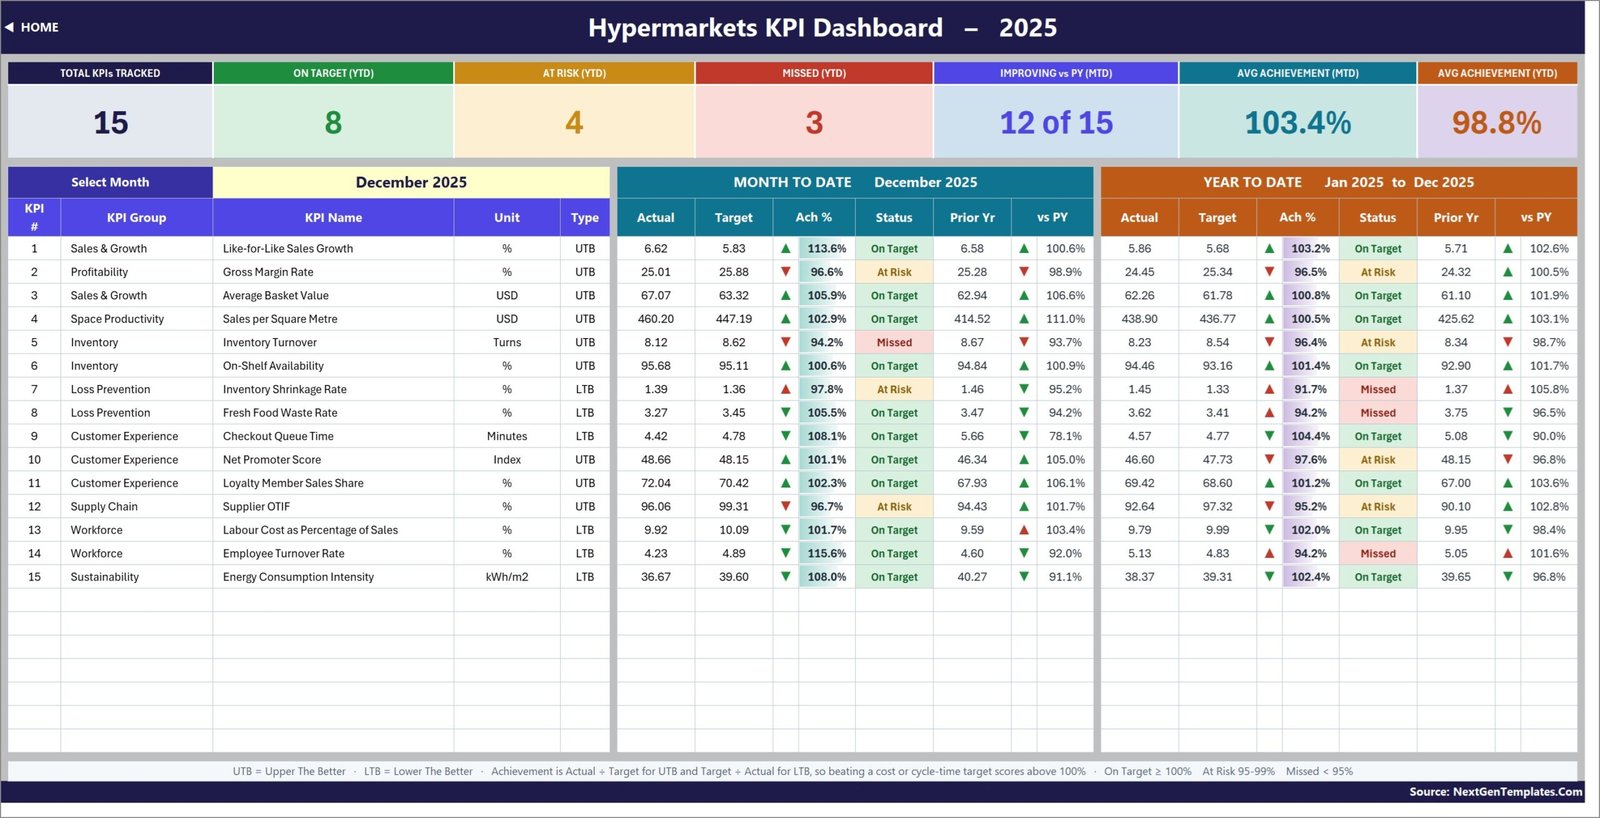
- One dropdown drives everything. Choose the month on the KPI Dashboard sheet and the MTD block, the YTD block, the seven summary cards and the whole KPI Analysis page re-read from that single cell.
- 15 hypermarket KPIs across 9 groups – Sales & Growth, Profitability, Space Productivity, Inventory, Loss Prevention, Customer Experience, Supply Chain, Workforce and Sustainability.
- Direction-aware achievement. Each KPI is flagged UTB (upper the better) or LTB (lower the better). Achievement is Actual / Target for UTB and Target / Actual for LTB, so beating a shrinkage or queue-time target scores above 100% instead of looking like a miss.
- Traffic-light status. On Target from 100%, At Risk from 95% to 99%, Missed below 95%. The thresholds live in visible formulas on the dashboard – change them to match your own governance.
- Prior-year comparison on every row, MTD and YTD, with a coloured arrow that already knows whether the movement is good news for that particular KPI.
- Seven summary cards at the top: Total KPIs Tracked, On Target (YTD), At Risk (YTD), Missed (YTD), Improving vs PY (MTD), Avg Achievement (MTD) and Avg Achievement (YTD).
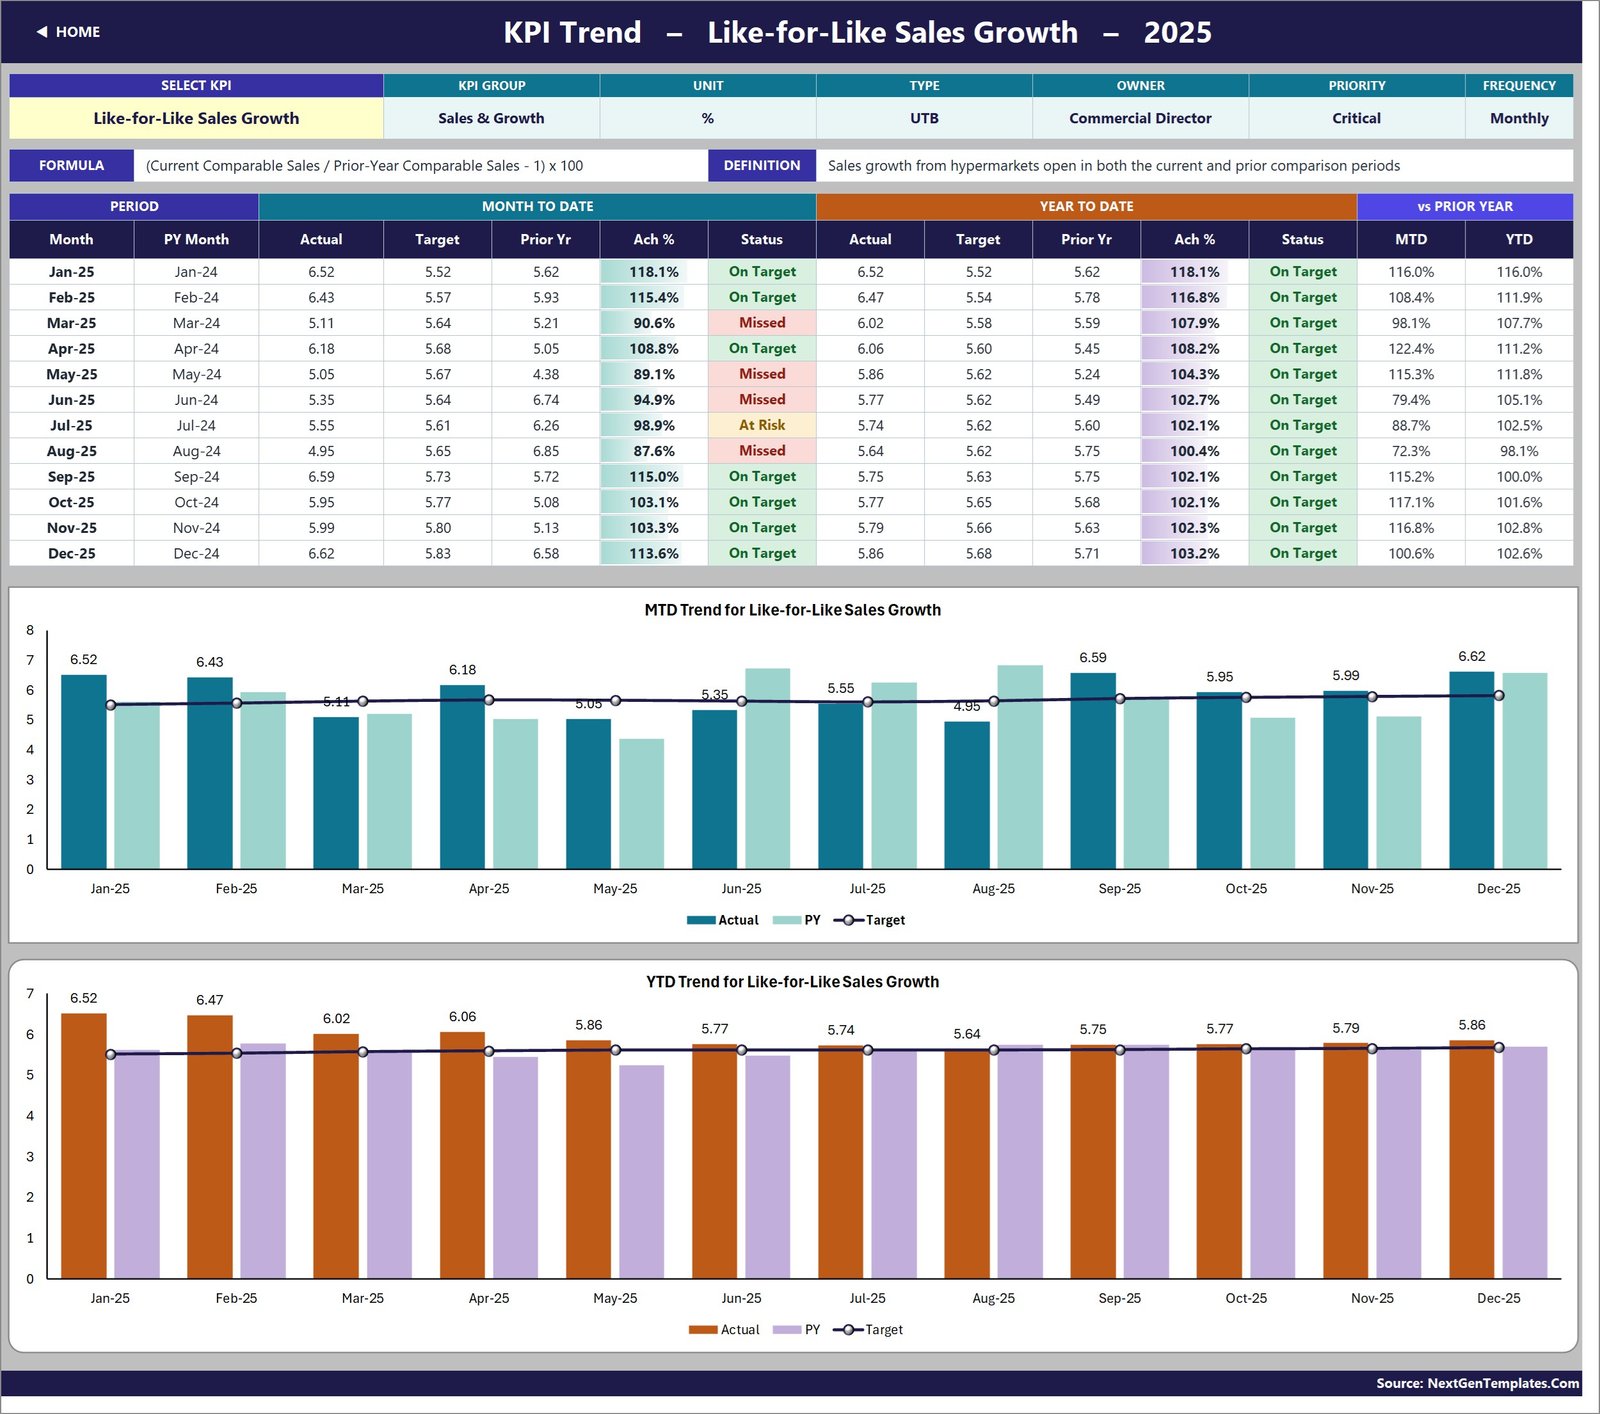
- KPI Trend page – pick any KPI and get its attribute strip, formula, definition, a twelve-month table and two combo charts (Actual and PY columns with a Target line) for MTD and YTD.
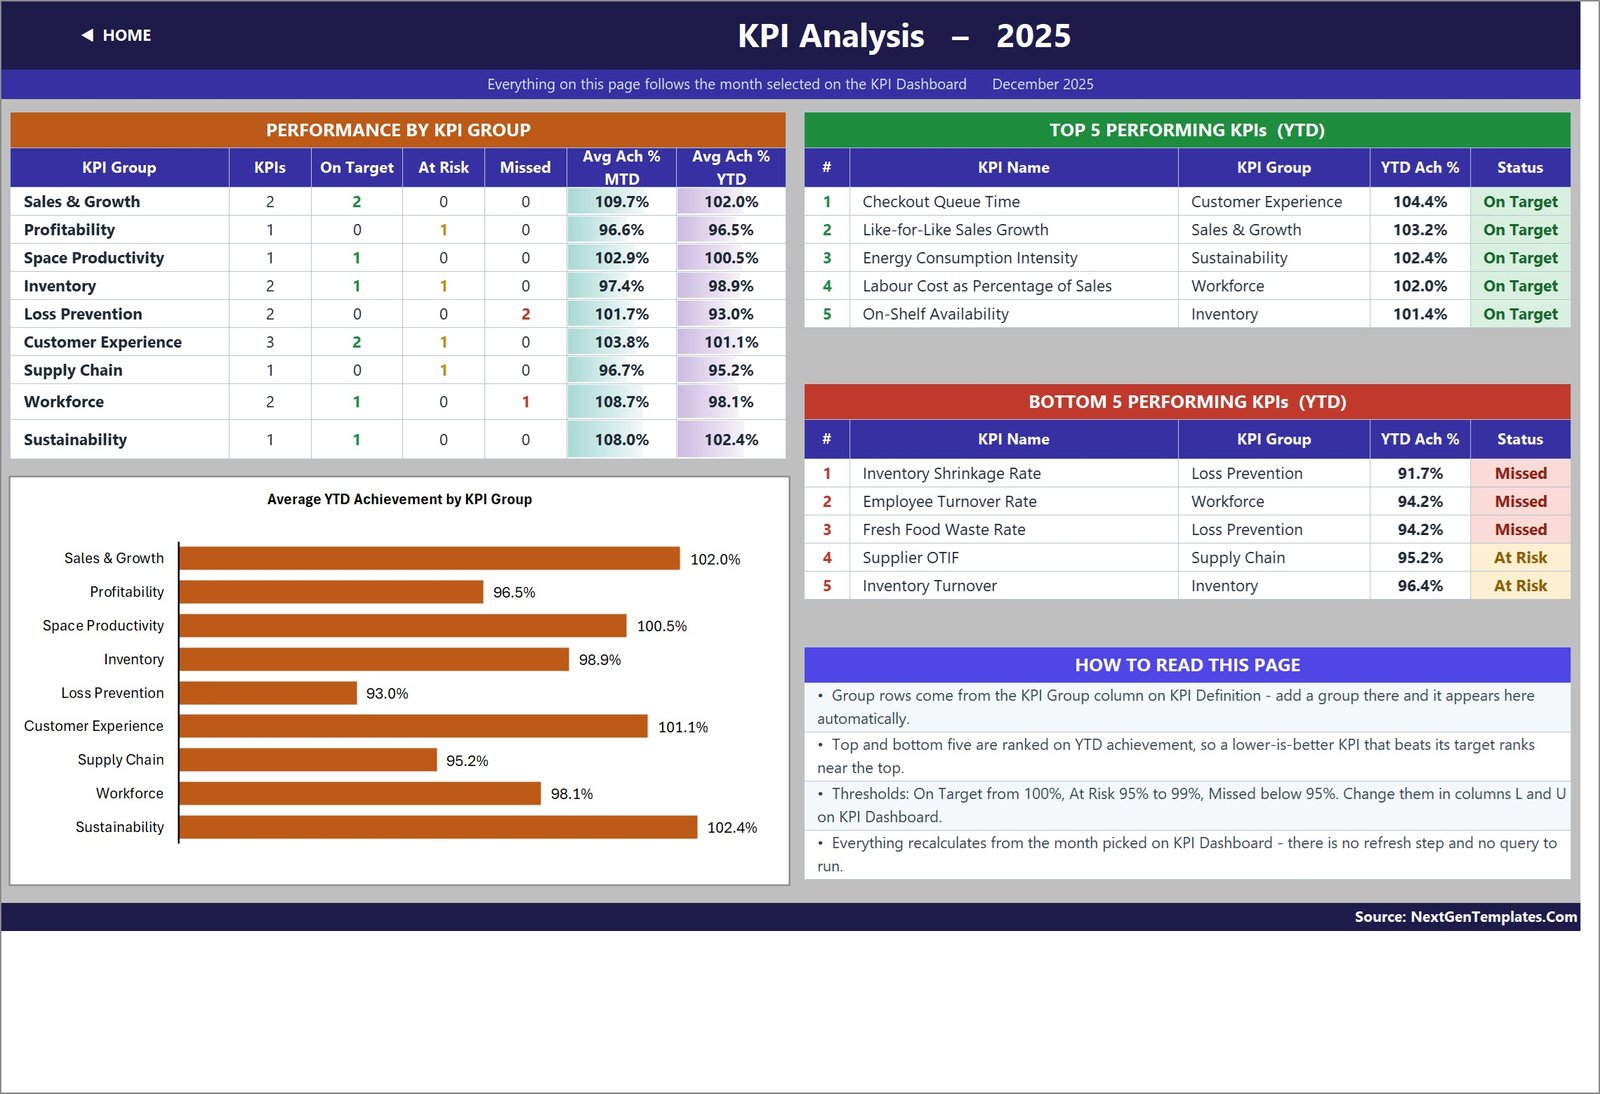
- KPI Analysis page – achievement rolled up by KPI group with a bar chart, plus Top 5 and Bottom 5 performing KPIs for the year to date.
- Add or rename KPIs without touching a formula. The sheets are wired for 22 KPIs; 15 are filled in and the rest are live and empty. Type a new KPI on KPI Definition and it flows through the input sheets, the scorecard, the trend page and the analysis page.
- Re-base the year in one cell. Cell E3 on KPI Input – Actual is the first month of the reporting year. Change it and the Target sheet, the Prior Year sheet, the month dropdown and every sheet title follow.
- Nothing to install. No Power Query, no Power Pivot, no data model, no macros, no add-ins. Opens in Excel 2013 and later and in Excel for the web.
The 15 KPIs You Get Out of the Box
| # | KPI Group | KPI Name | Unit | Type | Owner |
|---|---|---|---|---|---|
| 1 | Sales & Growth | Like-for-Like Sales Growth | % | UTB | Commercial Director |
| 2 | Profitability | Gross Margin Rate | % | UTB | Finance Director |
| 3 | Sales & Growth | Average Basket Value | USD | UTB | Head of Store Operations |
| 4 | Space Productivity | Sales per Square Metre | USD | UTB | Retail Performance Manager |
| 5 | Inventory | Inventory Turnover | Turns | UTB | Inventory Planning Director |
| 6 | Inventory | On-Shelf Availability | % | UTB | Replenishment Manager |
| 7 | Loss Prevention | Inventory Shrinkage Rate | % | LTB | Loss Prevention Director |
| 8 | Loss Prevention | Fresh Food Waste Rate | % | LTB | Fresh Food Director |
| 9 | Customer Experience | Checkout Queue Time | Minutes | LTB | Front-End Operations Manager |
| 10 | Customer Experience | Net Promoter Score | Index | UTB | Customer Experience Director |
| 11 | Customer Experience | Loyalty Member Sales Share | % | UTB | CRM and Loyalty Director |
| 12 | Supply Chain | Supplier OTIF | % | UTB | Supply Chain Director |
| 13 | Workforce | Labour Cost as Percentage of Sales | % | LTB | Retail HR Director |
| 14 | Workforce | Employee Turnover Rate | % | LTB | Retail HR Director |
| 15 | Sustainability | Energy Consumption Intensity | kWh/m2 | LTB | Facilities and Sustainability Director |
Every one of these ships with its formula, a plain-English definition, an owner, a priority and a reporting frequency on the KPI Definition sheet – so the pack doubles as a KPI dictionary you can hand to a store team.
What Is Inside the Workbook
1. Home
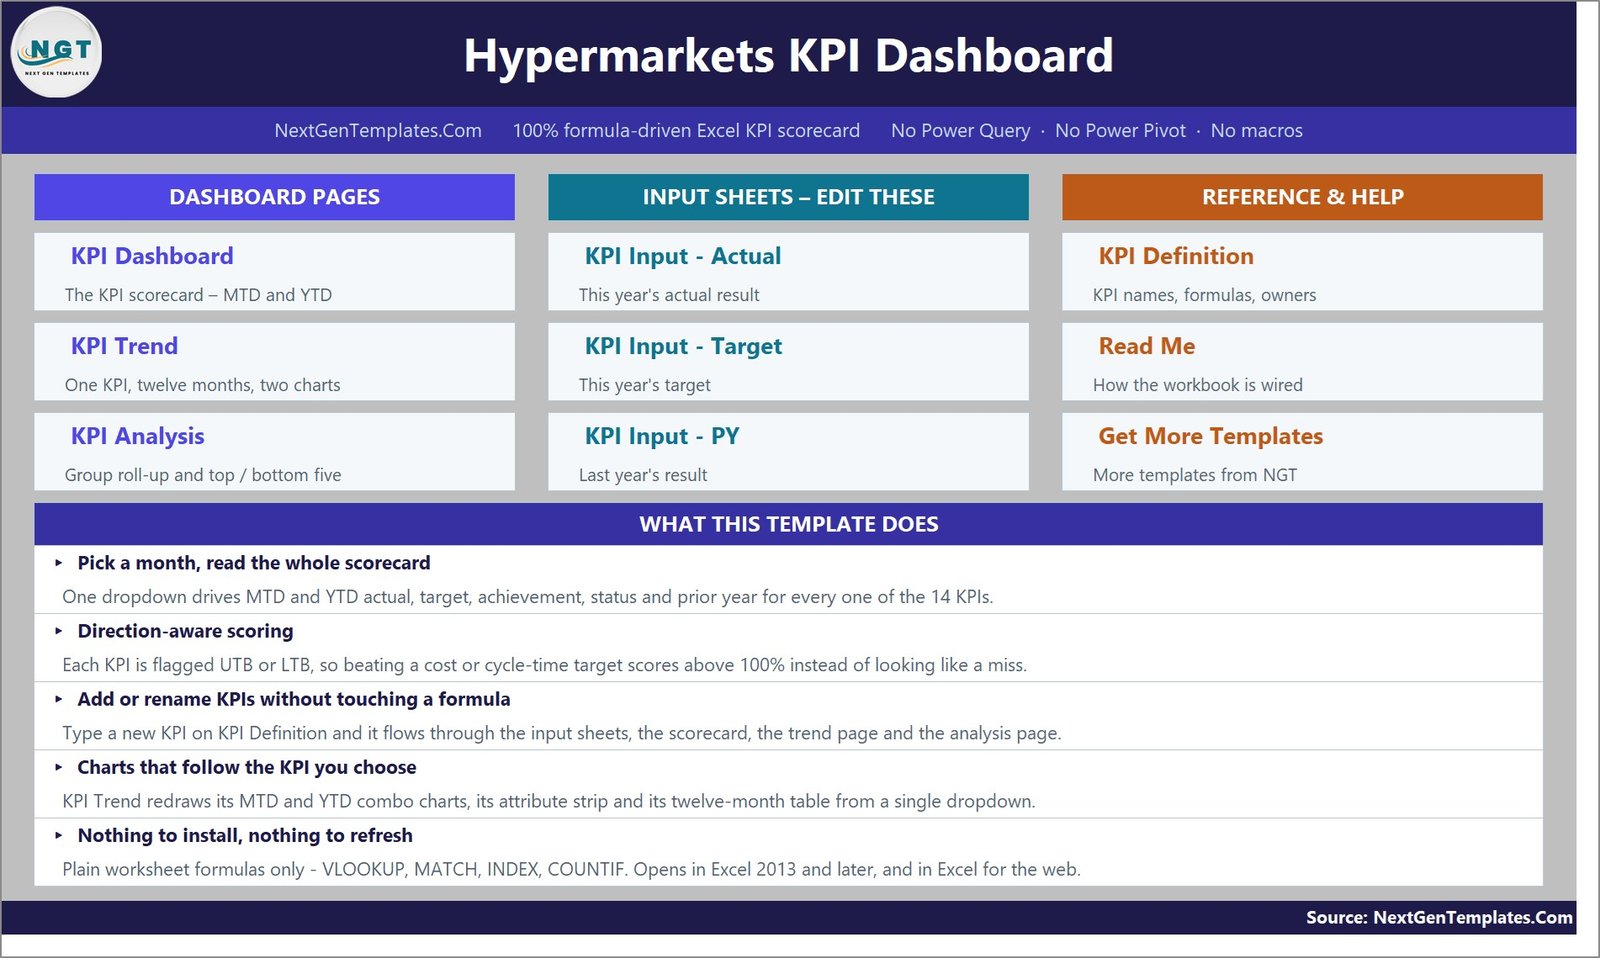
A navigation page with buttons to every sheet, grouped into Dashboard Pages, Input Sheets and Reference & Help, plus a short summary of what the template does.
2. KPI Dashboard – the scorecard
The month picker, the seven summary cards and one row per KPI. Each row carries MTD actual, target, achievement %, status, prior year and vs PY, and then the same six columns again for year to date. In the sample data for December 2025 the scorecard reads 15 KPIs tracked, 8 on target, 4 at risk, 3 missed, 12 of 15 improving versus prior year, 103.4% average MTD achievement and 98.8% average YTD achievement.
3. KPI Trend
Choose one KPI from a dropdown. You get its group, unit, type, owner, priority and frequency, its formula and definition, a twelve-month table of MTD and YTD actual / target / prior year with achievement and status, and two combo charts – MTD Trend for the selected KPI and YTD Trend for the selected KPI – each plotting Actual and PY as columns against a Target line.
4. KPI Analysis
Performance by KPI Group – count of KPIs, on target, at risk, missed and average MTD / YTD achievement per group – with an Average YTD Achievement by KPI Group bar chart, plus ranked Top 5 and Bottom 5 KPIs for the year to date. Everything on this page follows the month chosen on the KPI Dashboard.
5-7. KPI Input – Actual, Target and Prior Year
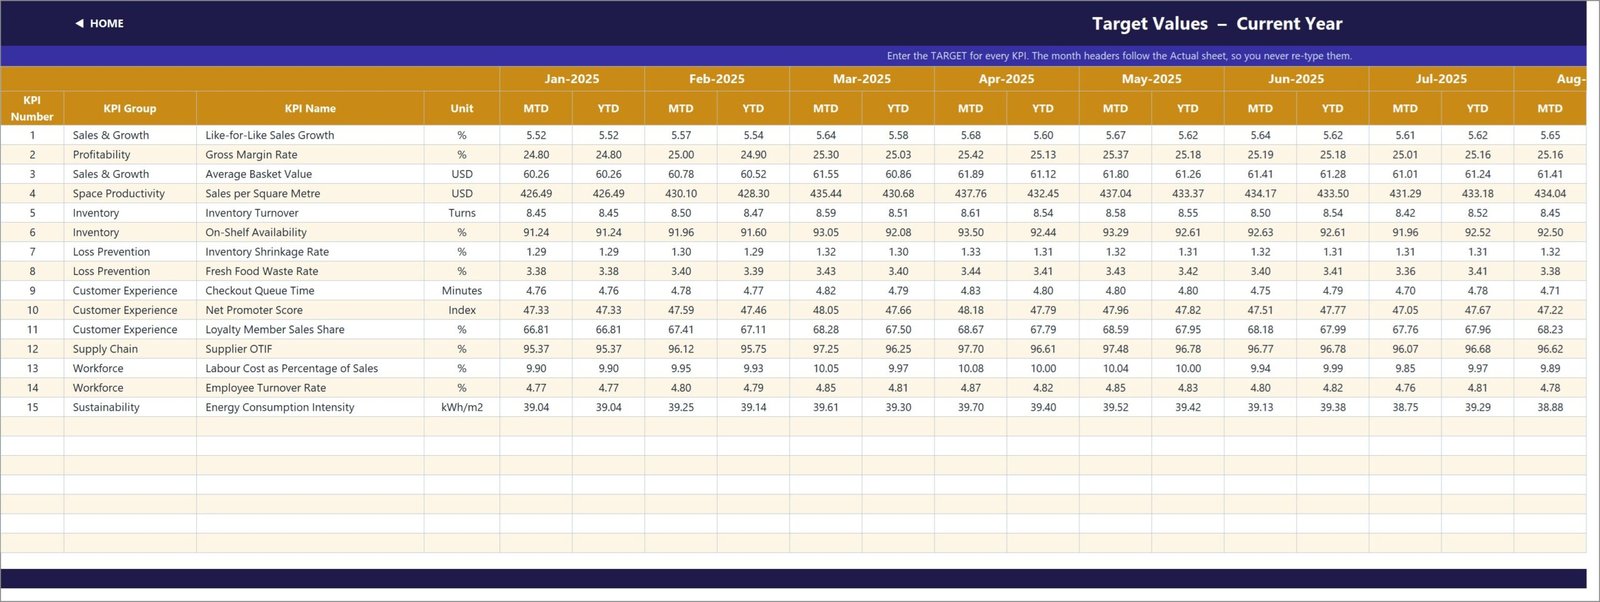
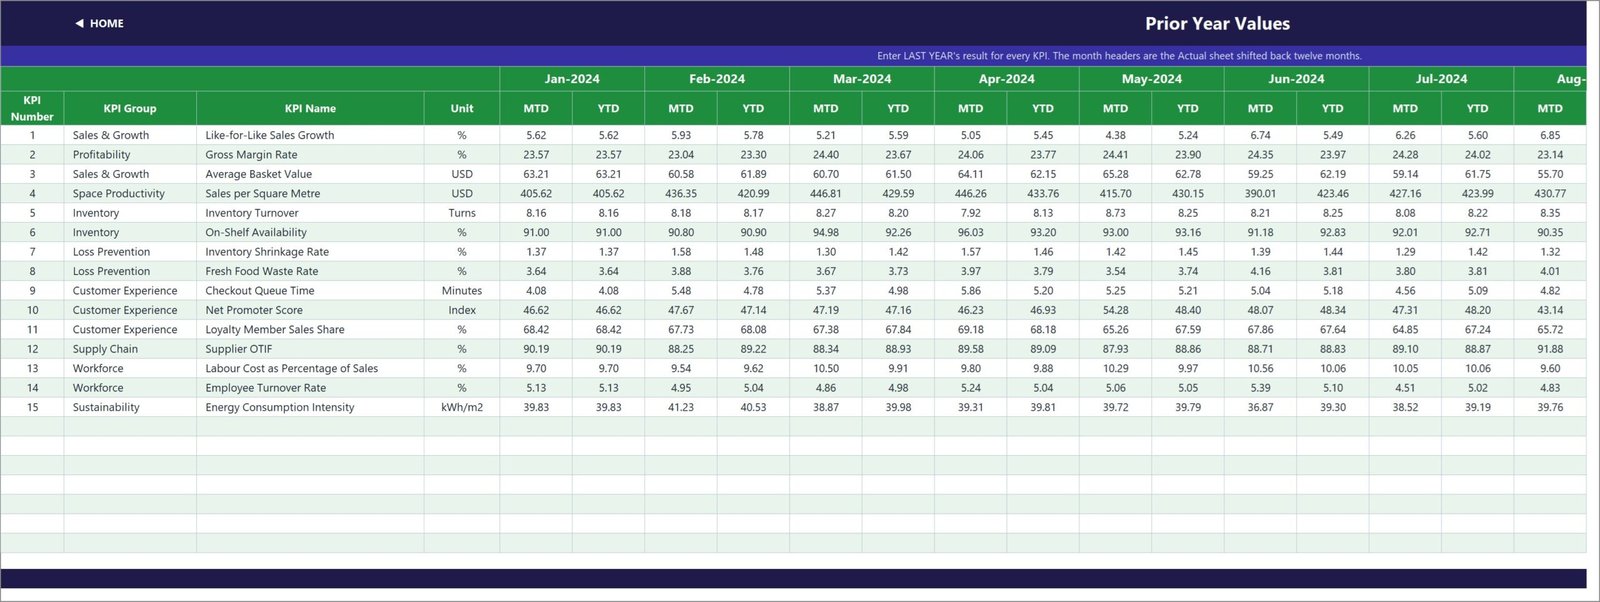
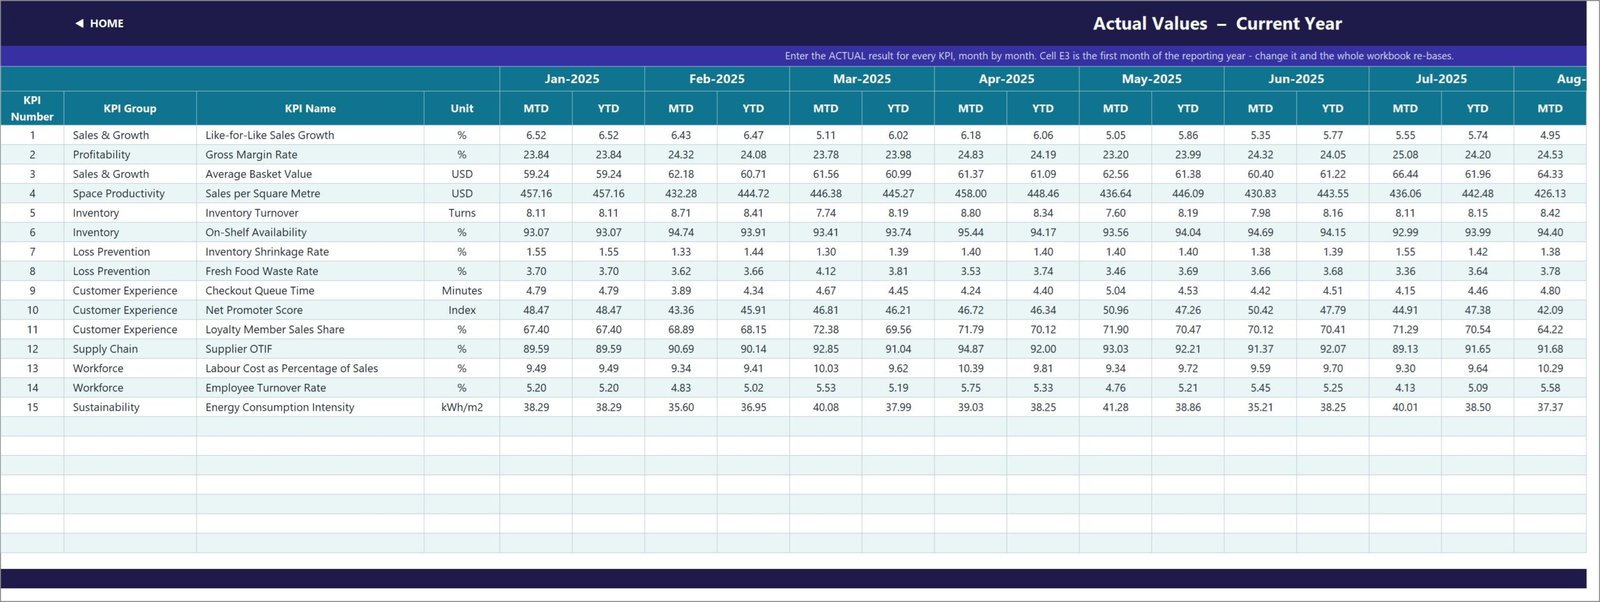
The only three sheets you normally type into. Each holds an MTD and a YTD column for every month of the reporting year, with the KPI rows driven by KPI Definition so all three always line up. The Target and Prior Year sheets take their month headers from the Actual sheet, so you never re-type a date.
8. KPI Definition – the master list
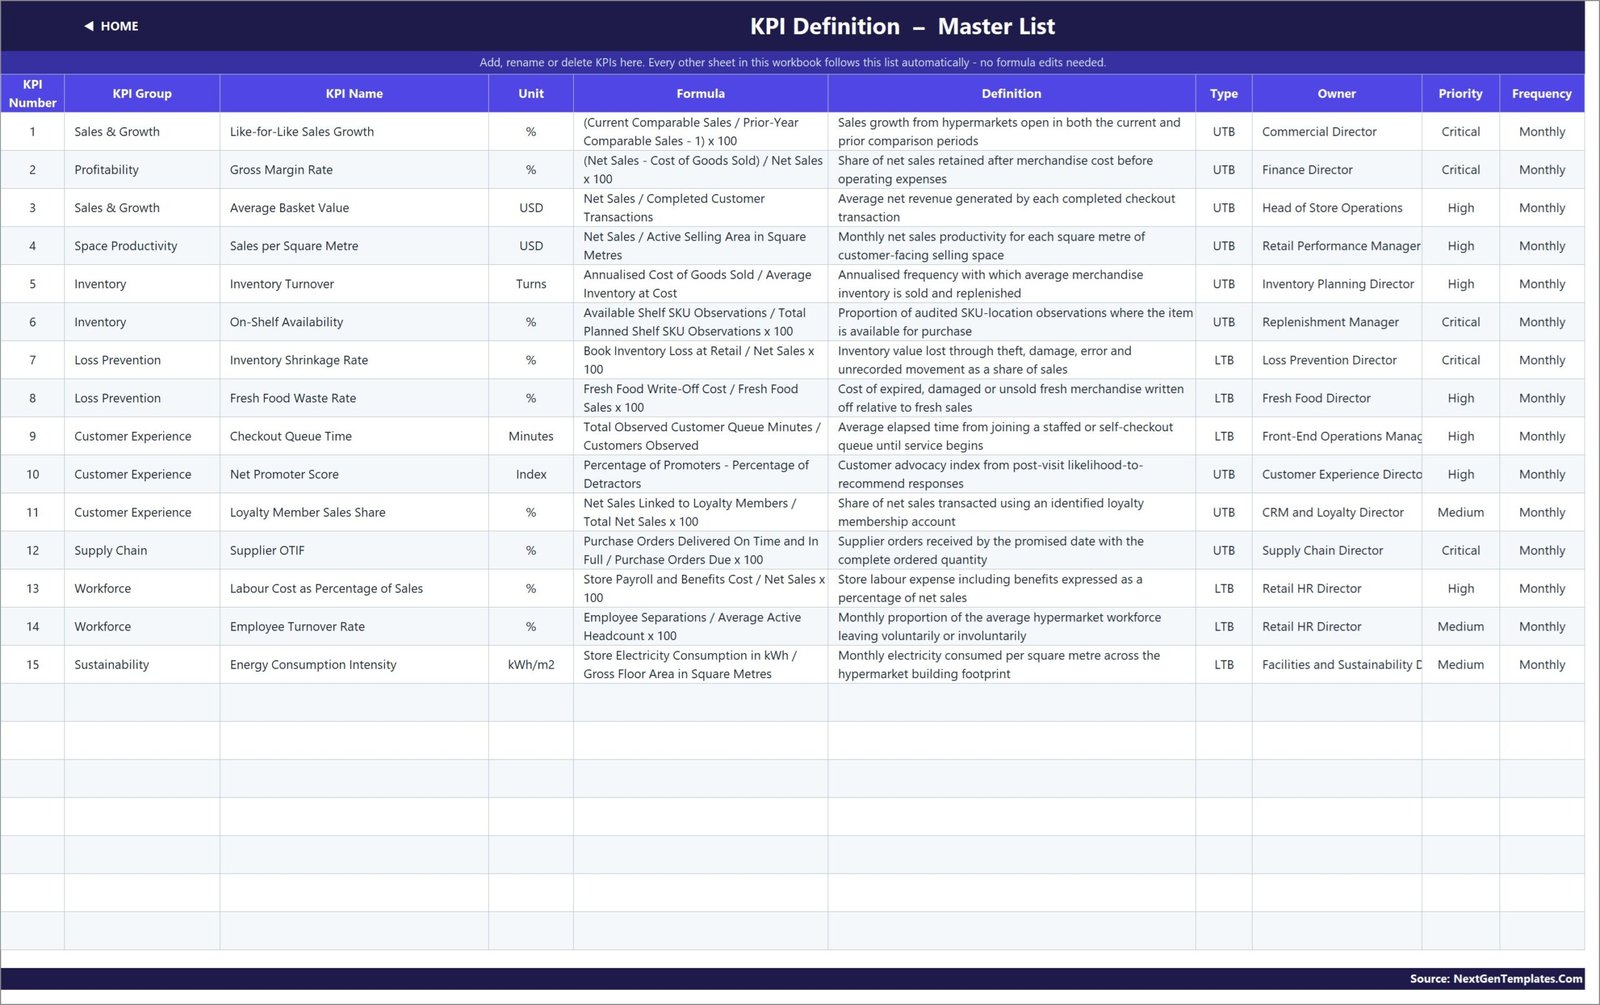
Number, group, name, unit, formula, definition, type (UTB / LTB), owner, priority and frequency. Add, rename or clear a KPI here and every other sheet follows automatically.
9. Read Me
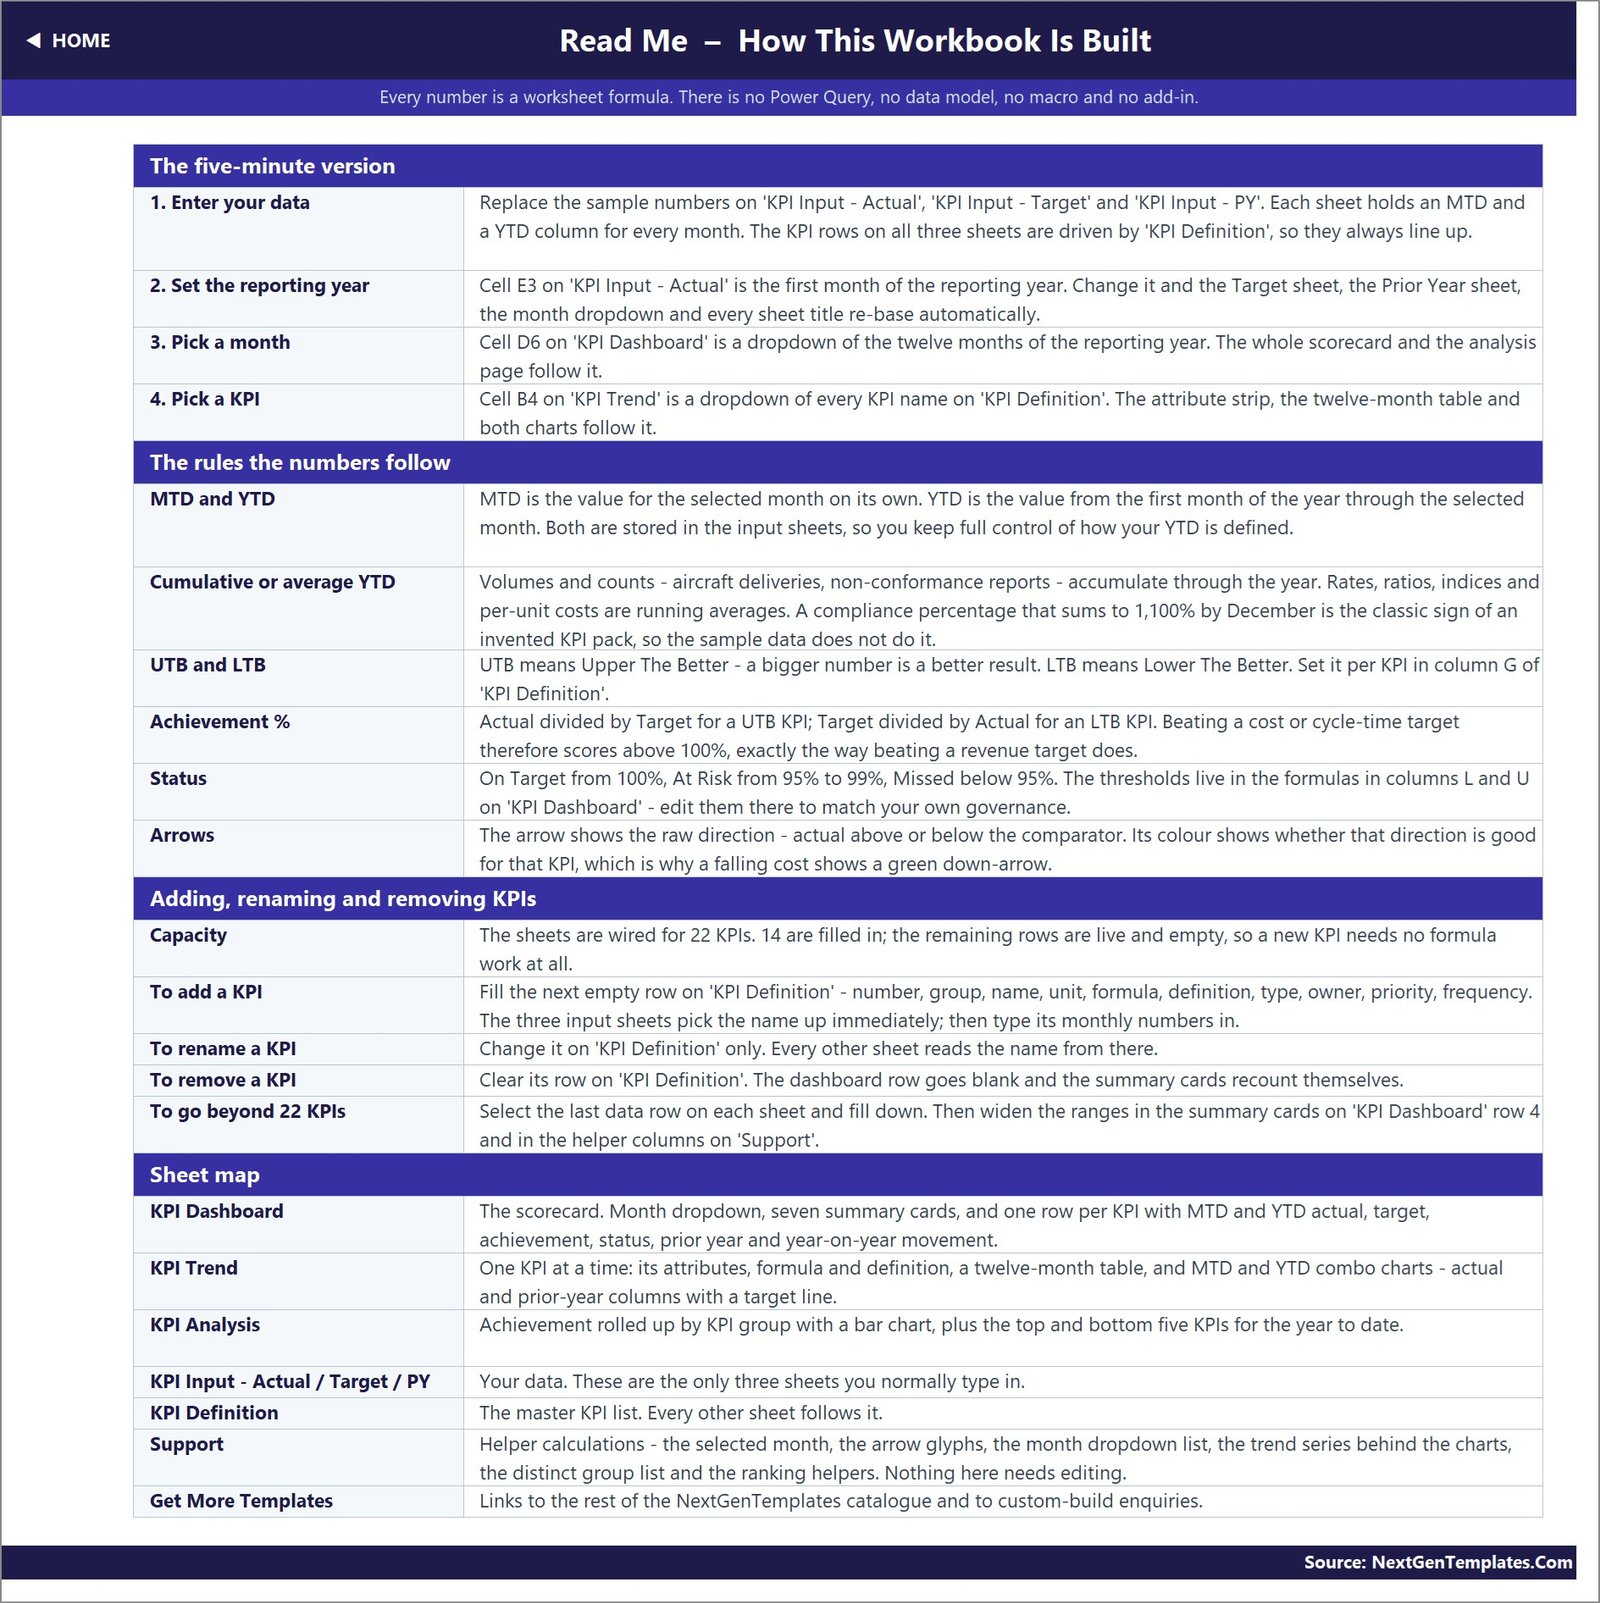
A five-minute setup guide, the rules the numbers follow (MTD vs YTD, cumulative vs average YTD, UTB and LTB, achievement, status thresholds, arrow colouring), how to add or remove KPIs, and a sheet-by-sheet map.
10. Get More Templates
Links back to the rest of the NextGenTemplates catalogue and to custom-build enquiries.
Scorecard or Analytical Dashboard – Which One Is This?
NextGenTemplates publishes two different families of Excel dashboards and they are often confused because the names are similar. This product is the scorecard.
| This template – KPI Scorecard | Analytical Excel Dashboard | |
|---|---|---|
| What you type in | One monthly number per KPI (actual, target, prior year) | A transaction-level data table |
| Main control | Month dropdown + KPI dropdown | Slicers and filters |
| Core output | Achievement %, traffic-light status, MTD vs YTD, vs prior year | Charts, breakdowns and cuts of the raw data |
| Engine | Plain worksheet formulas only | Pivot tables / Power Query in some builds |
| Best for | Monthly management review and board packs | Exploring what is driving a number |
| Pages | 10 (scorecard, trend, analysis, 3 inputs, definition, read me, home, catalogue) | Varies by topic |
They complement each other rather than compete. The scorecard tells you which KPI missed; an analytical dashboard on the same topic tells you why.
Who It Is For
- Hypermarket and superstore general managers preparing a monthly performance review.
- Regional and area retail managers comparing this month against target and against last year.
- Retail finance and FP&A teams who need a margin, labour-cost and shrink view beside the sales numbers.
- Category, replenishment and supply chain managers tracking on-shelf availability, inventory turns and supplier OTIF.
- Loss prevention and fresh food teams reporting shrinkage and waste against a target rather than in isolation.
- Retail consultants and analysts who need a presentable client-ready scorecard without building one from scratch.
How to Use It
- Download and unzip. Open the .xlsx file – there is nothing to install and no security prompt to accept, because there are no macros.
- Set your reporting year. Type the first month of your year into cell E3 on KPI Input – Actual. Every other sheet re-bases itself.
- Review the KPI list. On KPI Definition, keep the 15 supplied KPIs, rename them, or add your own into the empty live rows. Set each one’s UTB / LTB type in the Type column.
- Enter your numbers. Replace the sample data on KPI Input – Actual, KPI Input – Target and KPI Input – PY, one MTD and one YTD figure per KPI per month.
- Pick a month. Use the dropdown on KPI Dashboard. The scorecard, the summary cards and the whole KPI Analysis page follow it.
- Drill into a KPI. Go to KPI Trend, pick the KPI from the dropdown and read its twelve-month story with both charts.
- Tune your thresholds. If your governance is not 100 / 95, edit the status formulas on the KPI Dashboard sheet – they are visible, not hidden in a macro.
Specifications
| File format | .xlsx (delivered inside a .zip) |
| Compatibility | Excel 2013, 2016, 2019, 2021, Microsoft 365, Excel for the web |
| Sheets | 10 visible pages plus a Support helper sheet |
| KPIs supplied | 15, in 9 KPI groups; wired for up to 22 with no formula work |
| Charts | 3 (MTD trend, YTD trend, average YTD achievement by KPI group) |
| Technology | Worksheet formulas only – no macros, no Power Query, no Power Pivot, no add-ins |
| Sample data | Included – twelve months of actual, target and prior-year figures |
| Editable | Fully – nothing is locked, hidden or password protected |
| Licence | Single-user commercial use; lifetime access to the file |
Frequently Asked Questions
Is this the same as your Hypermarkets analytical Excel dashboard?
No. This is the month-picker KPI scorecard – you enter one number per KPI per month and read achievement, status and trend. An analytical dashboard is driven by a transaction table and slicers. Many customers use both: the scorecard for the monthly review, the analytical dashboard to investigate a miss.
Do I need Power Query, Power Pivot or macros?
None of them. Every number is a plain worksheet formula. The file is a .xlsx, so there is no macro warning and it opens on locked-down corporate machines and in Excel for the web.
Can I change the KPIs to my own?
Yes. Rename or replace any KPI on the KPI Definition sheet and every other sheet follows – the input sheets, the scorecard, the trend page and the analysis page. The workbook is wired for 22 KPIs, of which 15 are filled in, so you can add seven more without editing a single formula.
Why does a lower-is-better KPI score above 100%?
Because achievement is direction-aware. For an LTB KPI such as Inventory Shrinkage Rate or Checkout Queue Time, achievement is Target / Actual – so coming in under target correctly scores above 100%, exactly the way beating a sales target does.
Can I track more than one store?
The workbook is designed as a single scorecard. Most customers keep one copy per store or per region and a consolidated copy for the group. If you need a multi-store version with a store selector, ask us about a custom build.
Does it come with data?
Yes – twelve months of realistic sample data for all 15 KPIs, on all three input sheets, so you can see the whole thing working before you type anything of your own.
Can I change the colours and add my logo?
Yes. Nothing is locked. Recolour the headers and cards, drop your logo into the banner and the file is yours.
Related Templates
- Grocery Delivery Services KPI Dashboard in Excel – the online fulfilment side of the same basket.
- Container Tracking Dashboard in Excel – upstream inbound logistics for a retail supply chain.
- Robo Advisors KPI Dashboard in Excel – the same scorecard engine applied to a very different industry.
Start Measuring the Month That Matters
Stop rebuilding the same monthly retail pack in a fresh spreadsheet. Download the Hypermarkets KPI Dashboard in Excel, drop in your numbers, pick a month, and hand your team a scorecard that shows sales, margin, availability, shrink, service, supply chain, labour and energy on a single page – with a target beside every one of them.
Instant download. Fully editable. Lifetime access. Built by NextGenTemplates.Com.























Reviews
There are no reviews yet.