

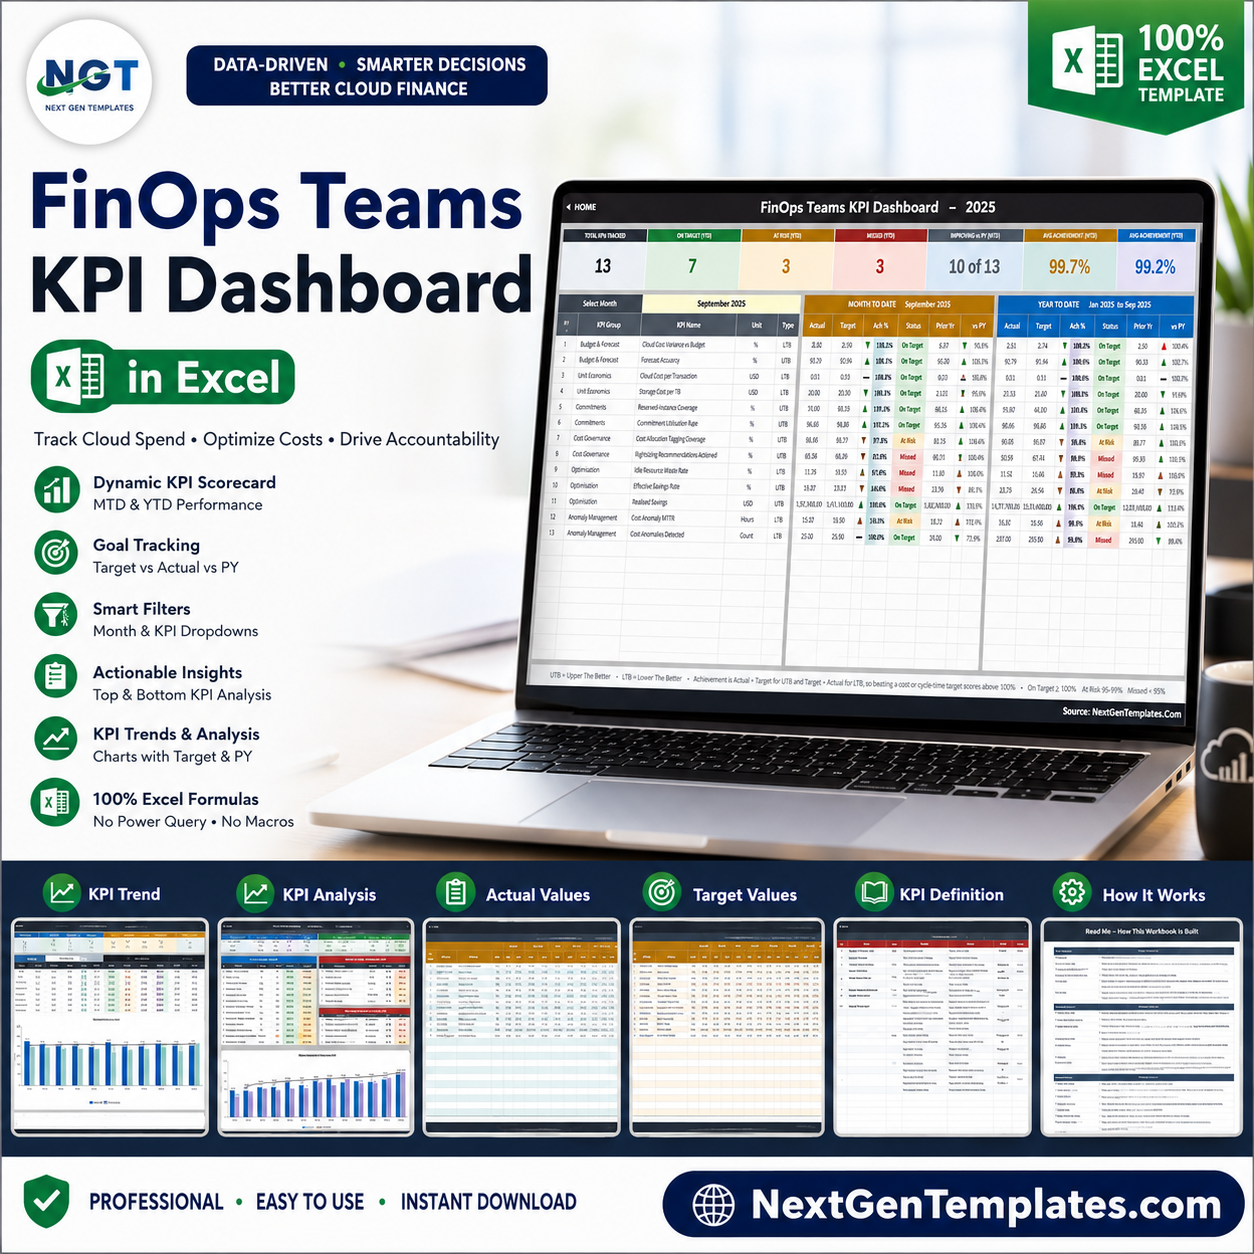
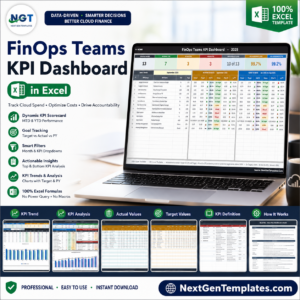
FinOps Teams KPI Dashboard in Excel is a formula-driven scorecard for 13 cloud-finance KPIs across budget and forecast, unit economics, commitments, cost governance, optimisation, and anomaly management. It includes 10 documented workbook pages, seven summary cards, month-to-date and year-to-date comparisons, prior-year movement, traffic-light status, two KPI trend charts, and capacity for 22 KPIs. For a one-time sale price of $12.99, you receive an editable Excel workbook with sample data; there is no macro, add-in, Power Query model, or recurring dashboard fee.
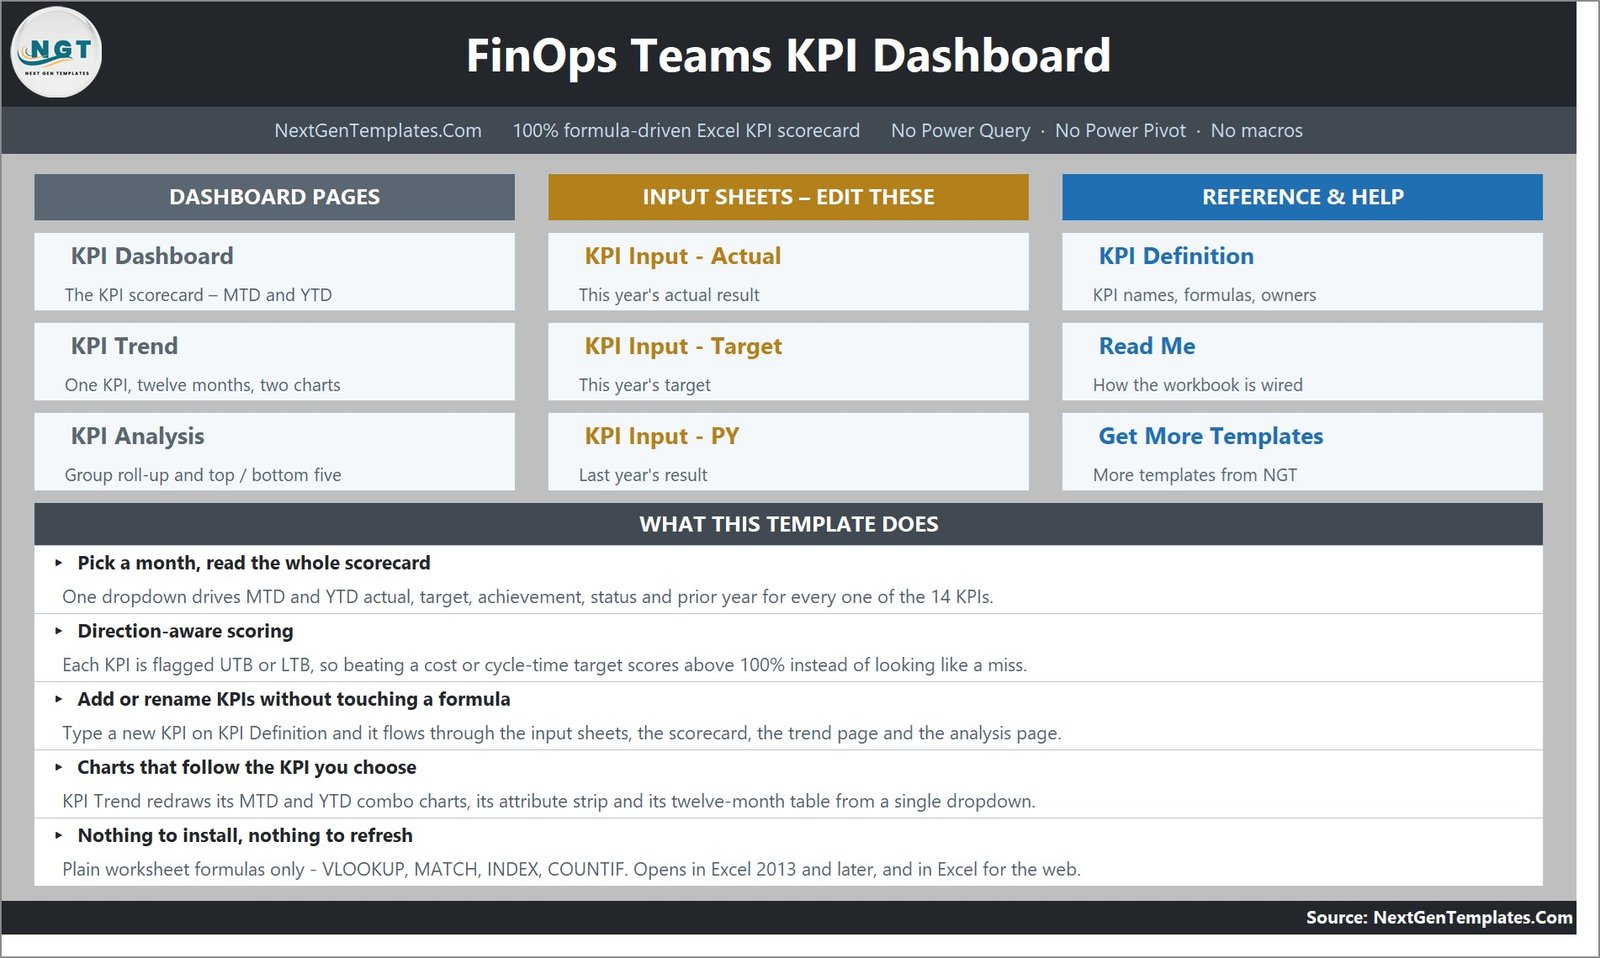
Key Features of FinOps Teams KPI Dashboard in Excel
- 13 ready FinOps KPIs with formulas, definitions, units, owners, priorities, frequencies, and direction rules.
- One month selector drives every MTD and YTD score, status, prior-year comparison, and analysis view.
- UTB and LTB scoring handles higher-is-better and lower-is-better metrics without reversing cost performance.
- Seven executive cards show tracked, on-target, at-risk, missed, improving, and average-achievement results.
- KPI Trend page shows 12 months of MTD and YTD actual, target, prior year, achievement, and status.
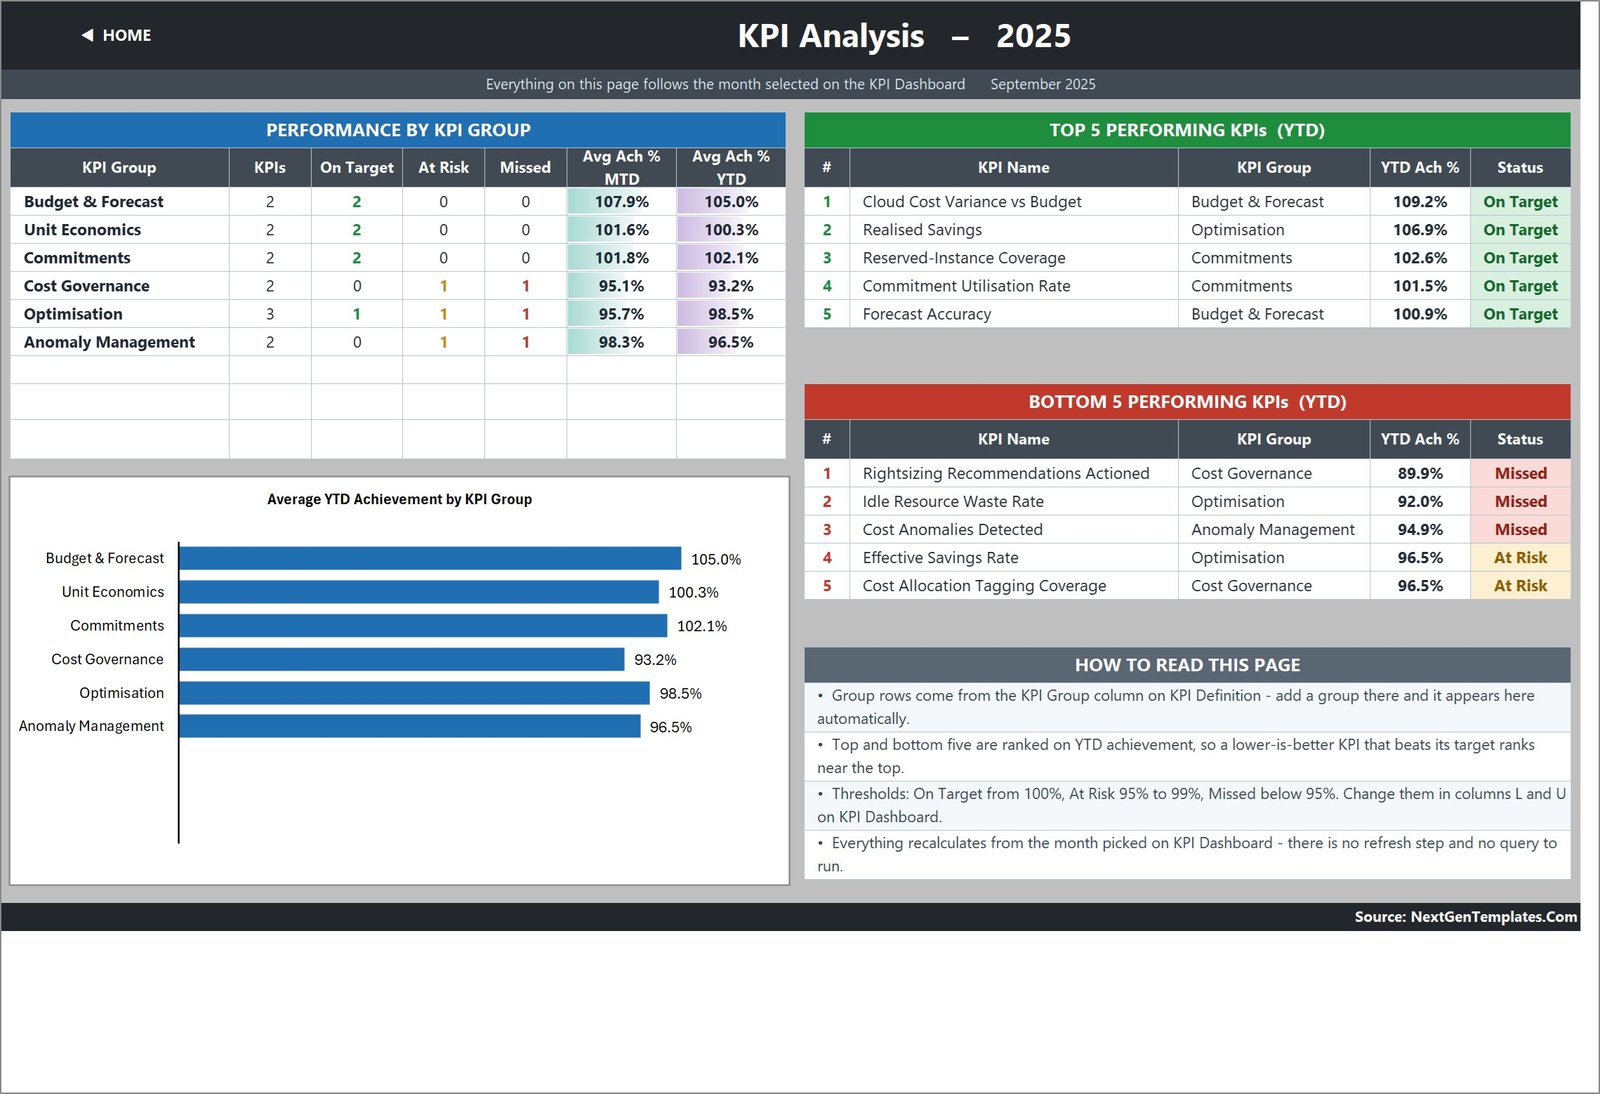
- KPI Analysis page rolls up achievement by group and ranks the top and bottom five KPIs.
- Three input sheets separate actual, target, and prior-year values.
- Formula-only design works in Excel 2013 and later and Excel for the web.
What’s Inside the FinOps Teams KPI Dashboard in Excel
KPI Dashboard
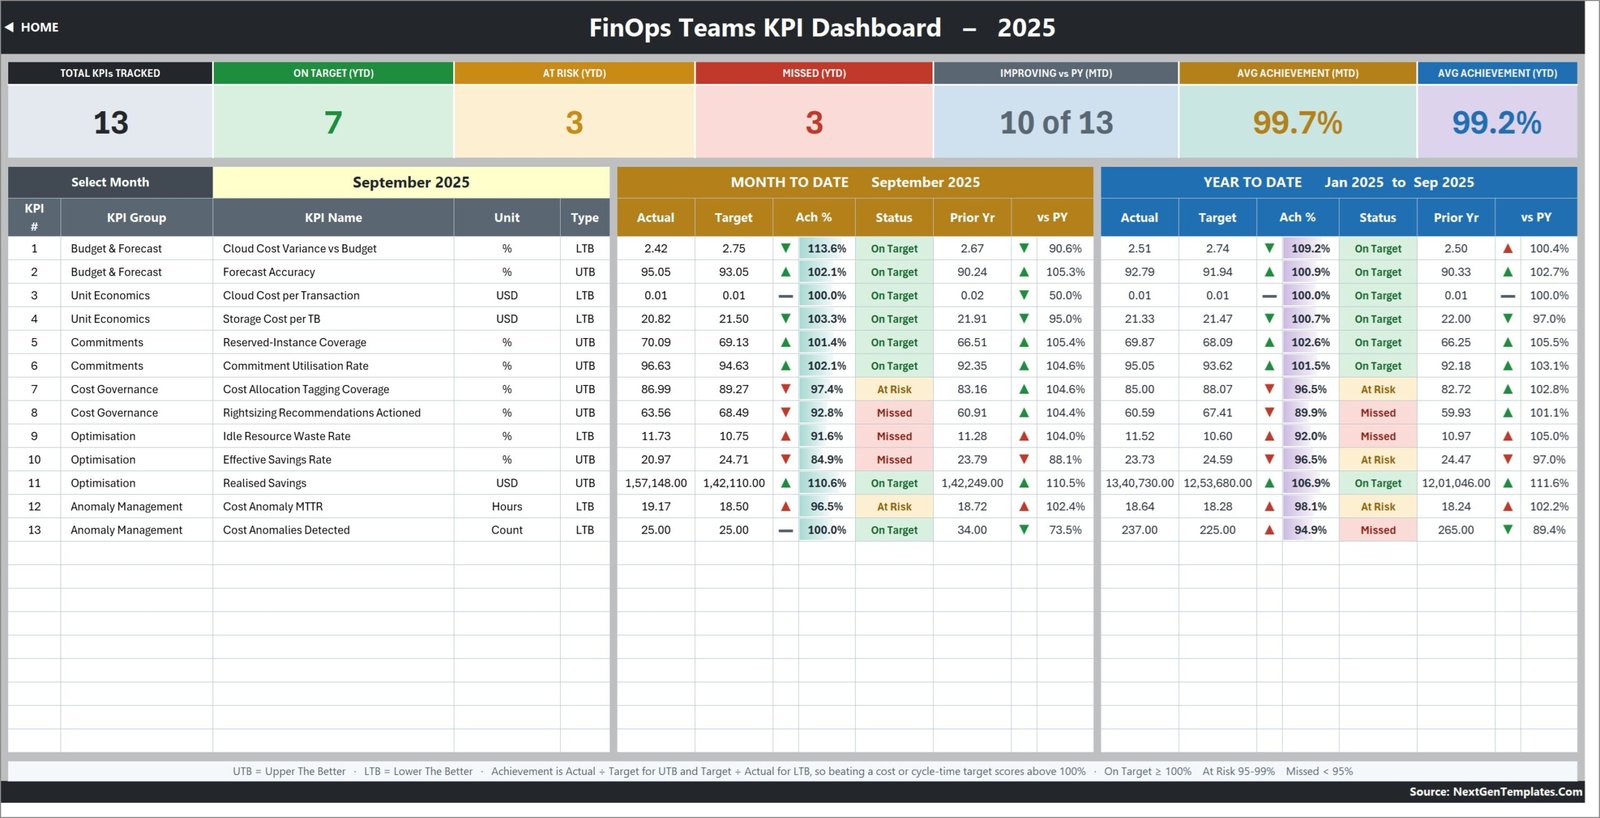
The main scorecard tracks 13 KPIs for the selected month. Its sample September 2025 view shows seven on target, three at risk, and three missed, with MTD and YTD actual, target, achievement, status, prior year, and movement columns.
KPI Trend
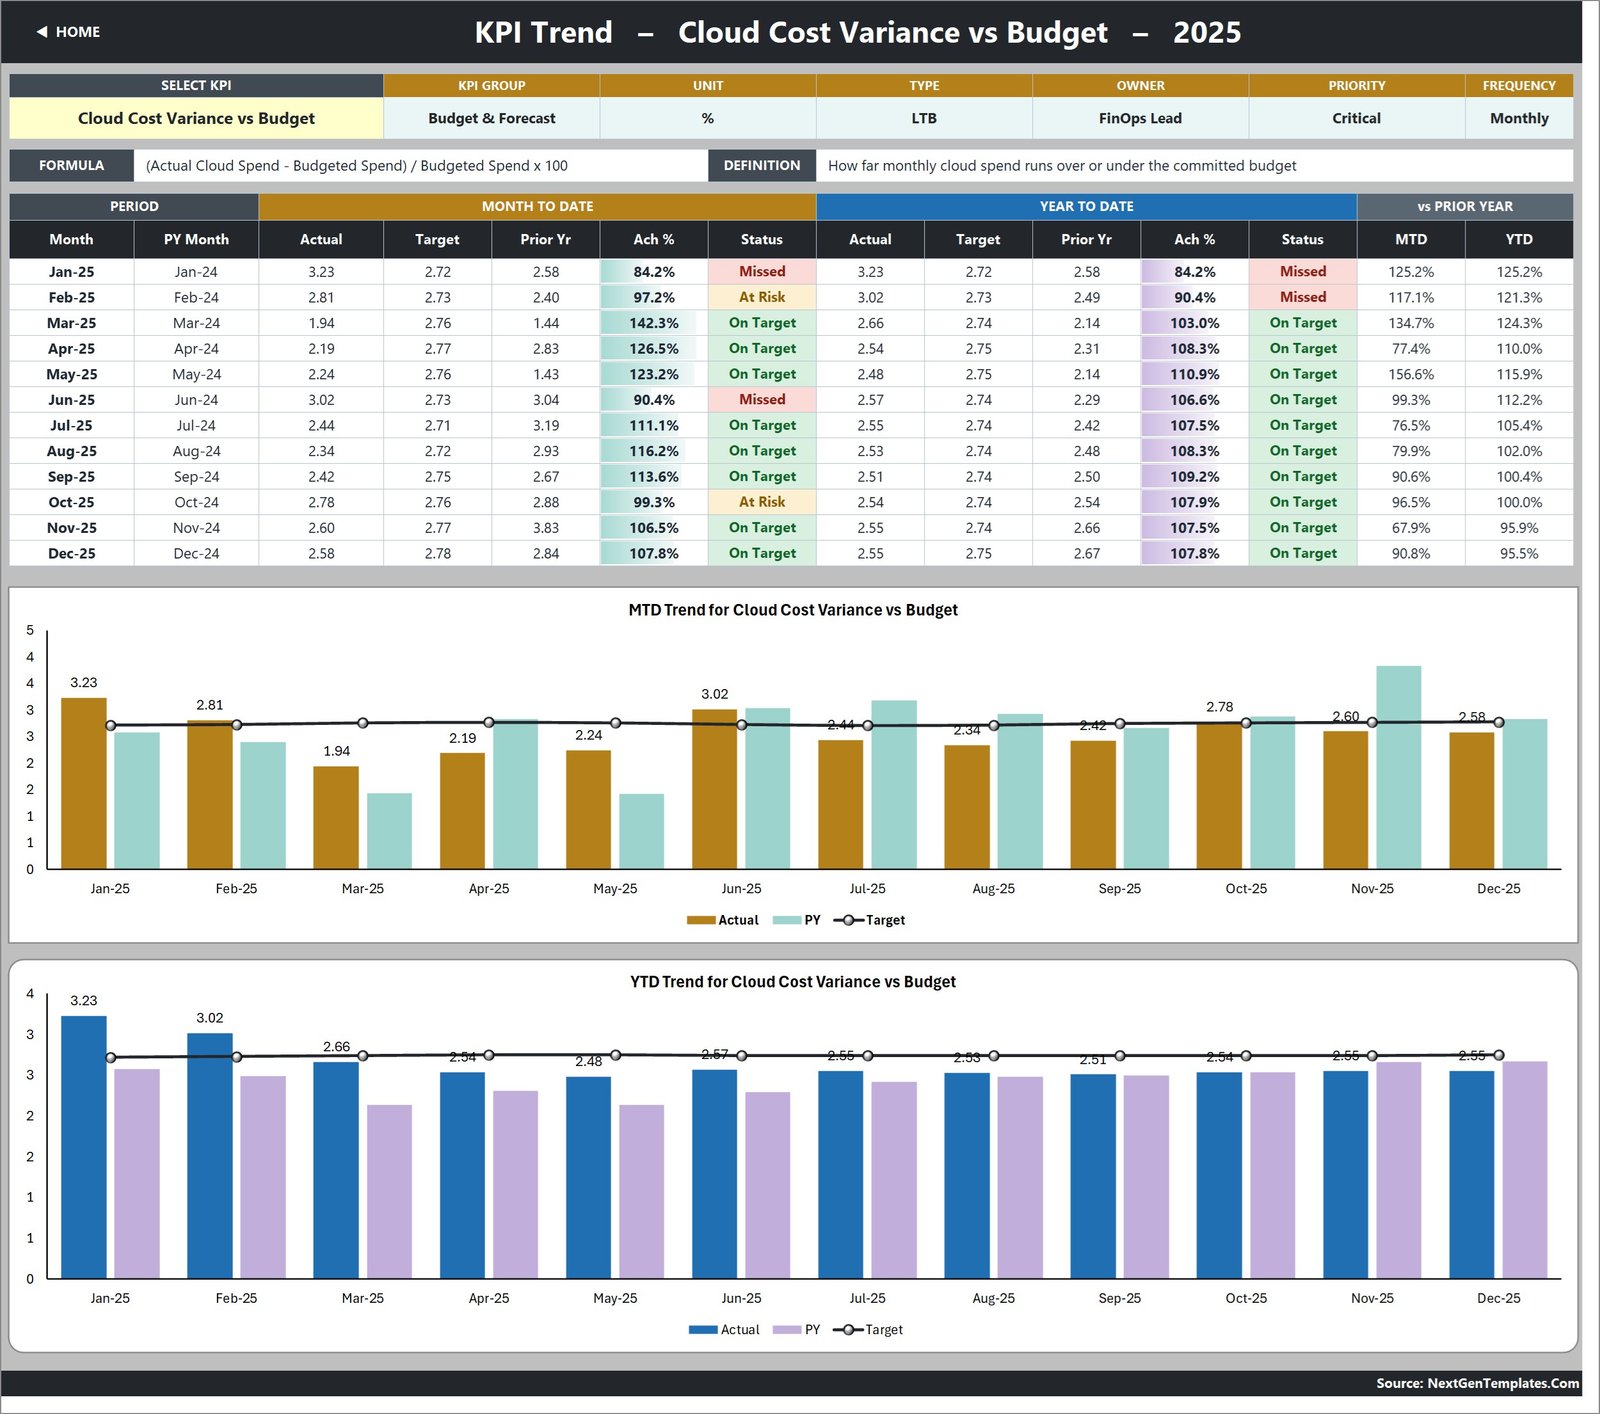
Select one KPI to see its group, unit, direction, owner, priority, formula, definition, 12-month table, and separate MTD and YTD actual-versus-target charts.
KPI Analysis
This page compares average achievement by KPI group, then lists the five strongest and five weakest YTD KPIs. It follows the month selected on the scorecard.
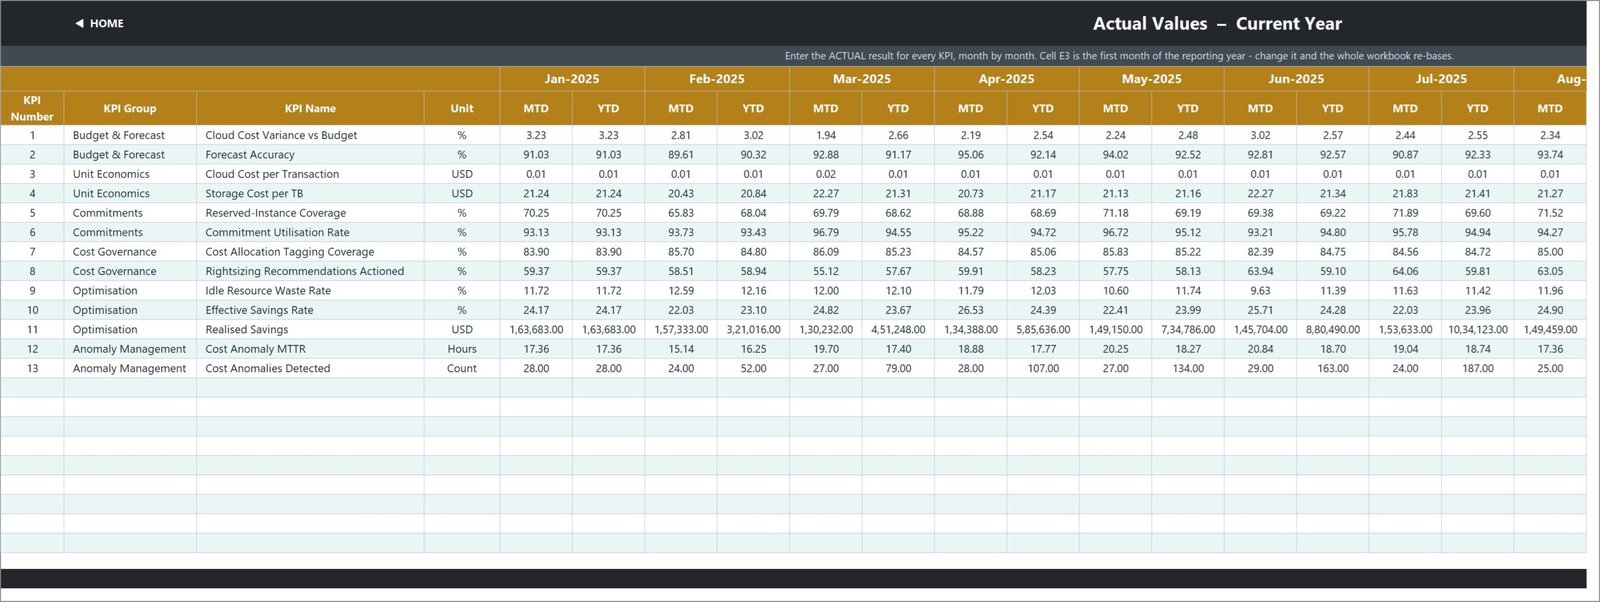
KPI Input – Actual
Enter current-year actual results month by month. Changing the first reporting month rebases the year throughout the workbook.
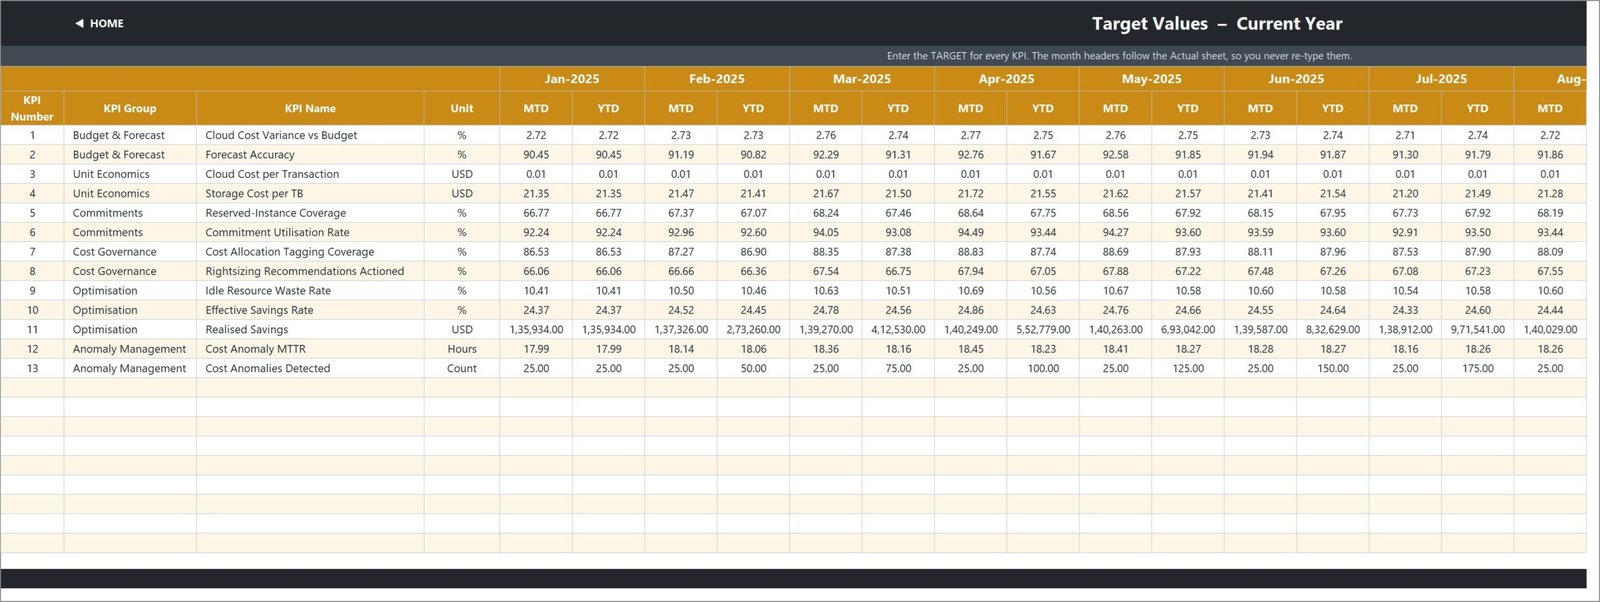
KPI Input – Target
Enter monthly targets in a separate sheet whose headers follow the Actual sheet automatically.
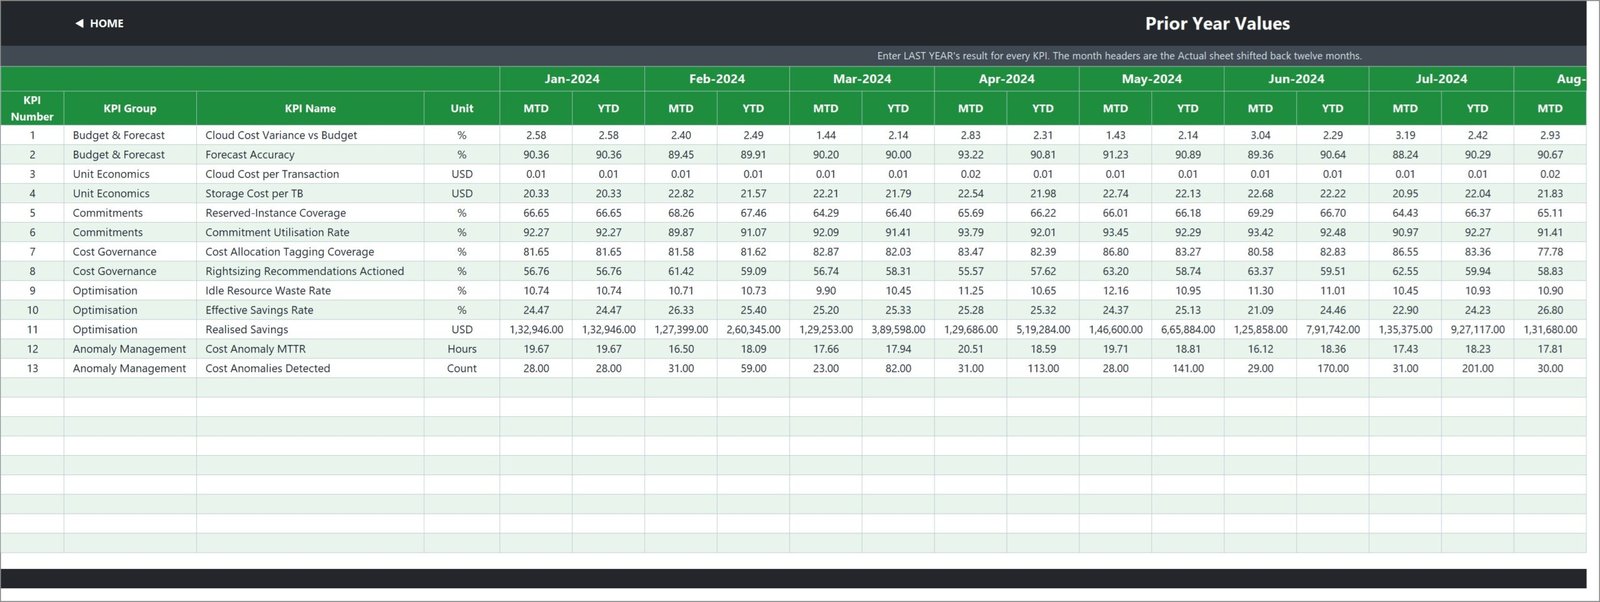
KPI Input – Prior Year
Store last year’s MTD and YTD comparators so the scorecard and trend view can evaluate movement against the prior period.
KPI Definition
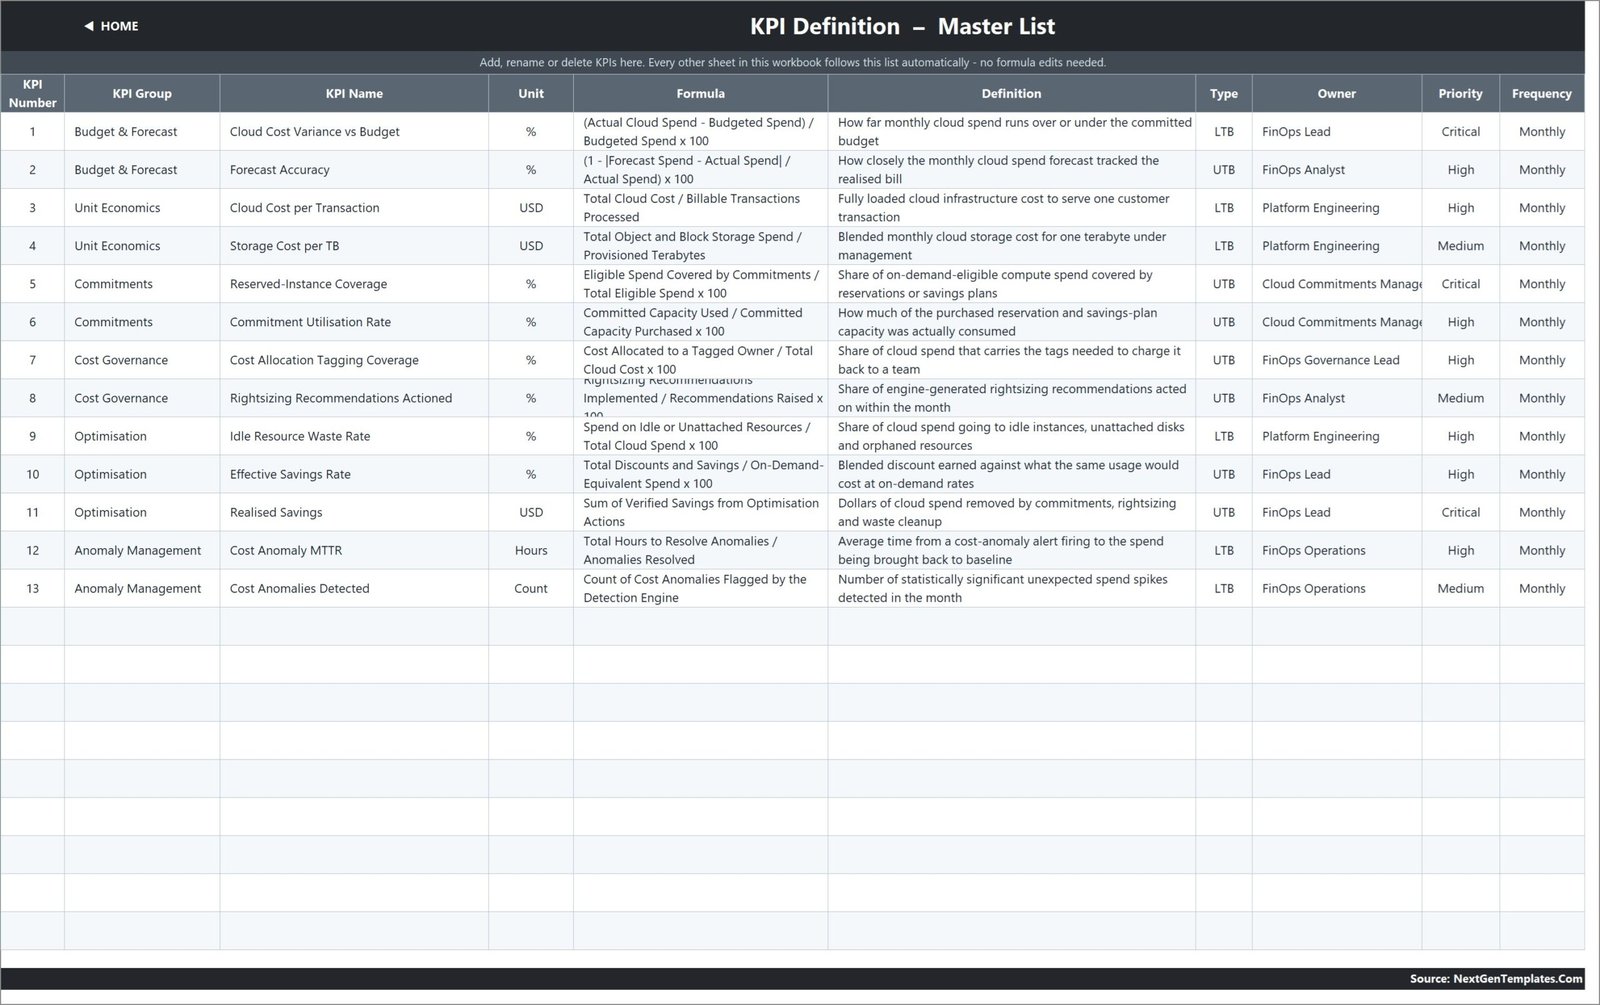
The master list contains the KPI group, name, unit, formula, definition, UTB/LTB type, owner, priority, and frequency. Rename or add a KPI here and the other working sheets follow the list.
Read Me
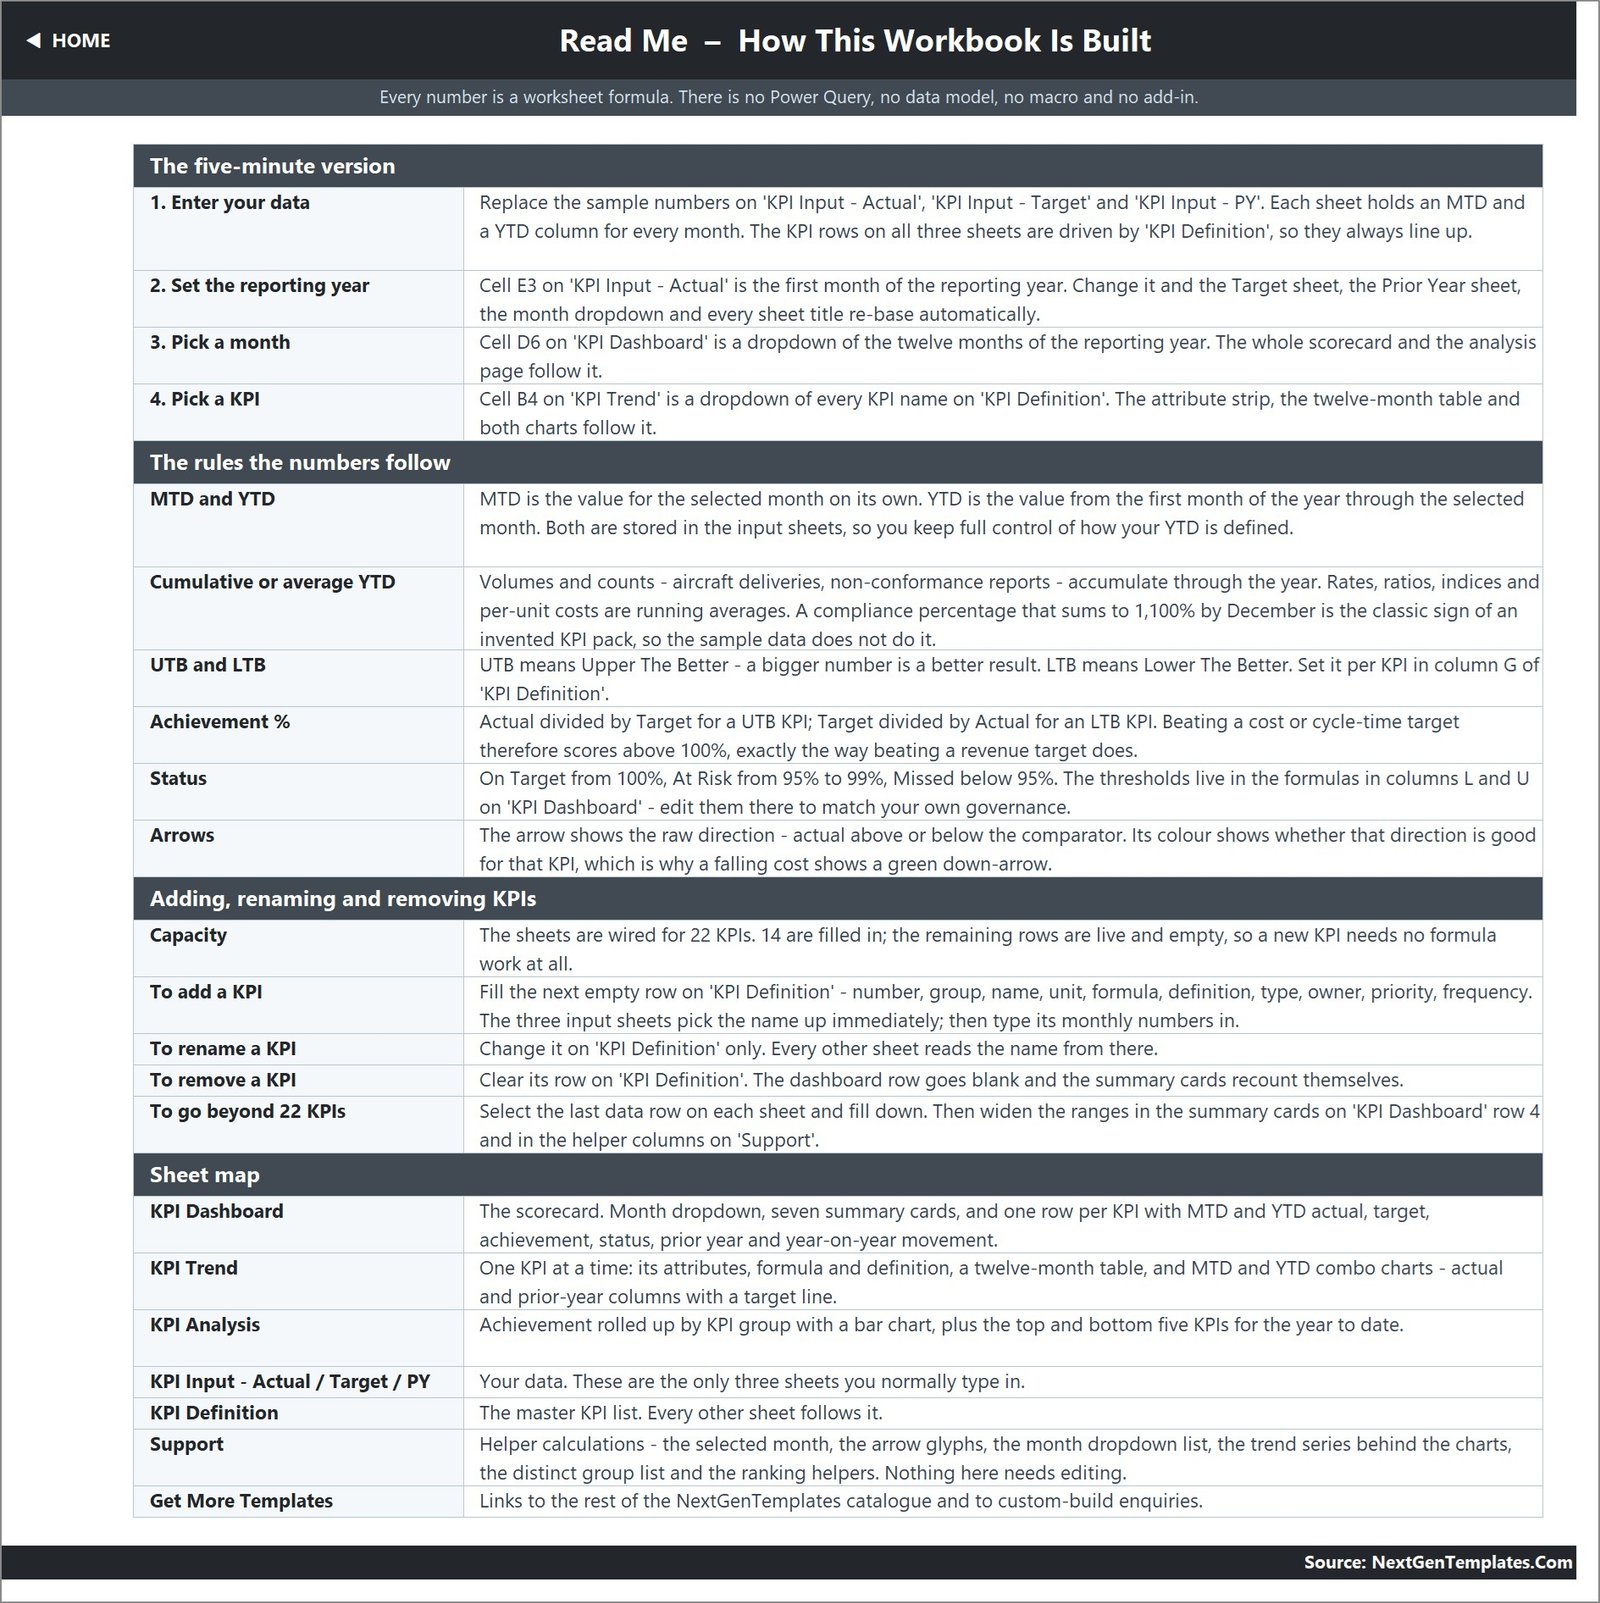
The guide explains data entry, reporting-year setup, selectors, achievement rules, thresholds, and how to extend beyond the 22 wired rows.
Get More Templates
The catalogue page points to other KPI scorecards, analytical dashboards, bundles, and custom dashboard services.
FinOps Teams KPI Dashboard in Excel vs. Google Sheets vs. Paid FinOps SaaS – Where This Fits
| Feature | This Excel KPI Dashboard | Google Sheets Alternative | Paid FinOps SaaS |
|---|---|---|---|
| Cost | $12.99 one-time sale price | Build or adapt a sheet | Recurring subscription |
| Platform | Excel 2013+, desktop or web | Browser spreadsheet | Vendor cloud service |
| Setup | Replace three monthly input tables | Requires equivalent scorecard logic | Account, billing and tagging integrations |
| Collaboration | OneDrive or SharePoint | Native link sharing | Role-based access by plan |
| Custom fields | Editable KPI master list and formulas | Editable cells and formulas | Limited by product configuration |
| FinOps scope | 13 sample KPIs, capacity for 22 | Depends on the build | May include allocation and automation |
| Live cloud connection | No | No unless engineered | Often available |
Who This Template Is For – and Who It’s Not For
It is built for FinOps leads, cloud finance analysts, platform engineering managers, cost-governance owners, and finance partners who run a monthly KPI review from prepared numbers. It is a good fit when you want transparent formulas and a portable file.
It is not a billing connector, anomaly-detection service, cloud resource optimizer, approval workflow, forecasting engine, or replacement for AWS Cost Explorer, Azure Cost Management, Google Cloud Billing, Apptio, or VMware CloudHealth. The sample data is illustrative, not financial advice or a benchmark.
How to Use the FinOps Teams KPI Dashboard in Excel
- Download and unzip the package.
- Open the workbook in Excel.
- Review KPI Definition and replace names, formulas, owners, units, priorities, or direction types where needed.
- Enter Actual, Target, and Prior Year monthly values.
- Choose a month on KPI Dashboard.
- Use KPI Trend to inspect one metric and KPI Analysis to review groups and rankings.
- Validate all formulas and thresholds against your governance policy before circulation.
Real-World Use Cases
Priya, FinOps Lead: Priya brings the scorecard to a monthly cloud cost review and uses the missed/at-risk summary to assign follow-up actions.
Marcus, Platform Engineering Manager: Marcus tracks commitment utilisation, rightsizing recommendations, idle-resource waste, and cost per transaction.
Ana, Finance Business Partner: Ana compares actual, target, and prior-year results before preparing a leadership pack.
Frequently Asked Questions
How many KPIs are included?
The sample master list contains 13 FinOps KPIs across six groups, and the wired sheets have capacity for 22 rows.
Does it use macros or Power Query?
No. The workbook uses standard worksheet formulas and does not require macros, Power Query, Power Pivot, or an add-in.
Can I change the KPI list?
Yes. Edit KPI Definition, then enter matching monthly values in the three input sheets.
What do UTB and LTB mean?
UTB means upper the better; LTB means lower the better. The achievement formula accounts for the selected direction.
Does it connect directly to AWS, Azure, or Google Cloud?
No. Enter prepared monthly KPI values manually or from your own export workflow.
Is this the same as the FinOps Teams analytical dashboard?
No. This product is the KPI scorecard family with month and KPI selectors, traffic-light status, trends, and a KPI master list. The separate analytical dashboard uses record-level data, pivots, slicers, and multiple analysis pages.
Can teams collaborate?
Yes, subject to your Microsoft 365 setup. Store the file in OneDrive or SharePoint and apply your own access controls.
About the Author
Built by PK – Microsoft Certified Professional with 15+ years of Excel, Google Sheets, and Power BI experience. Founder of NextGenTemplates, reaching 300K+ subscribers across YouTube channels. Every template is hand-built and tested before release.
Explore Related Templates
- FinOps Teams Dashboard in Excel – the separate record-level analytical dashboard.
- FinOps Teams Dashboard in Power BI.
- Mobile Banking KPI Dashboard in Excel.
- WealthTech KPI Dashboard in Excel.
- Browse Excel KPI Dashboard templates.
- Browse all Excel templates.
Read the detailed FinOps Teams KPI Dashboard guide, then download the workbook to turn prepared cloud-cost measures into a repeatable monthly review.
Last updated: August 18, 2026.































Reviews
There are no reviews yet.