

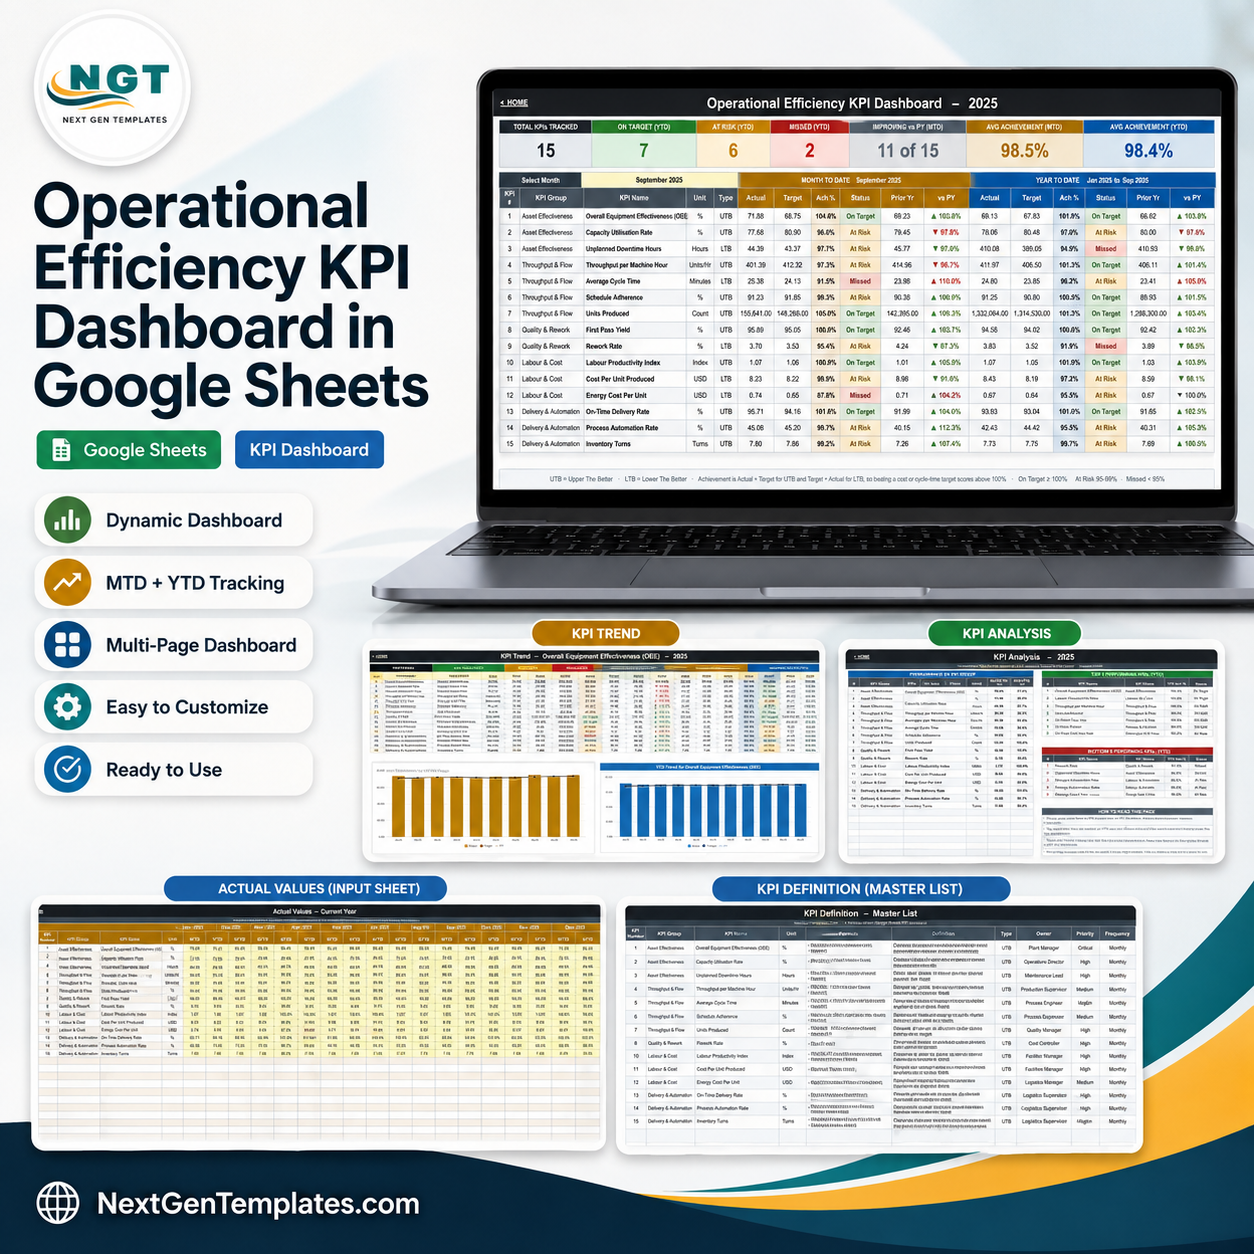

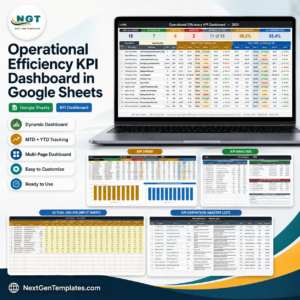
The Operational Efficiency KPI Dashboard in Google Sheets tracks 15 operations KPIs across 5 KPI groups on one month-picker scorecard, showing month-to-date and year-to-date actual, target, achievement percentage and prior-year comparison side by side. Every figure is formula-driven – no add-ons, no Apps Script, no refresh button. Pick a month from the dropdown and all ten tabs re-calculate. Instant download, lifetime access and free bug fixes: the PDF in your download carries the “Make a copy” link, so an editable copy lands in your own Google Drive in under a minute.
Which family is this? This is the NextGenTemplates KPI scorecard line – a month picker, traffic lights, a KPI Trend page and a KPI Analysis page. It is not the analytical operations dashboard line, which uses pivot-and-slicer charts sliced by region, customer and product. Both exist and the names sit close together, so if you want the analytical style instead, look at the Transportation Operations Dashboard in Google Sheets. Different product, different page layout, and worth owning alongside rather than instead of this one.
Key Features of the Operational Efficiency KPI Dashboard
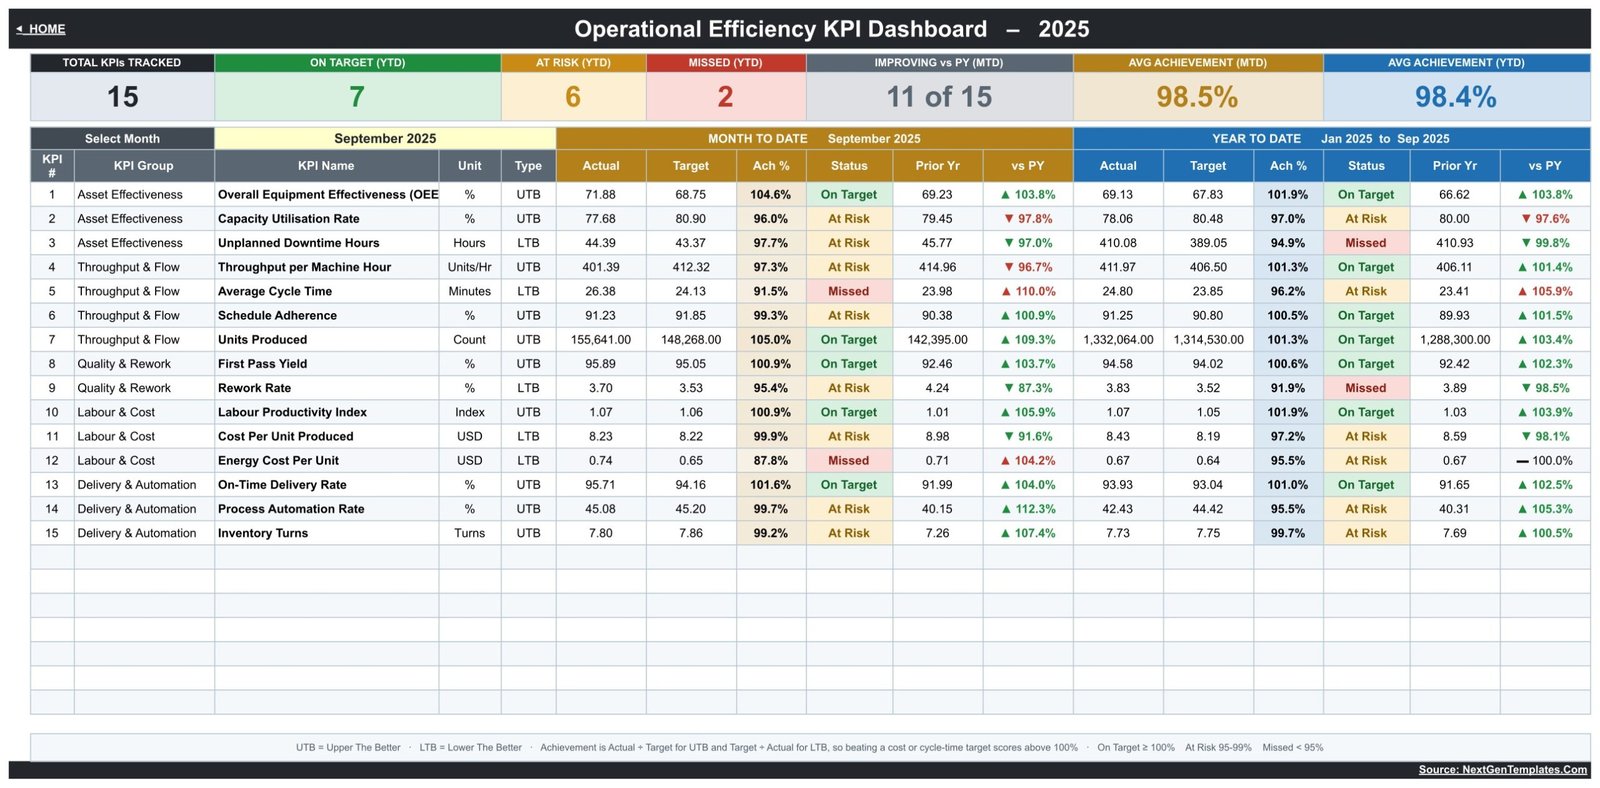
- 15 KPIs, 5 groups. Asset Effectiveness (3), Throughput & Flow (4), Quality & Rework (2), Labour & Cost (3) and Delivery & Automation (3).
- One month dropdown. Select September 2025 and the scorecard, the trend page and the analysis page all follow it.
- Seven header cards. Total KPIs Tracked, On Target (YTD), At Risk (YTD), Missed (YTD), Improving vs PY (MTD), Avg Achievement (MTD) and Avg Achievement (YTD).
- MTD and YTD in the same row. Each KPI shows Actual, Target, Ach %, Status, Prior Yr and vs PY twice – once for the month, once for the year to date.
- Direction-aware scoring. UTB (upper the better) and LTB (lower the better) are set per KPI, so beating a cost or cycle-time target scores above 100% instead of below it.
- Editable thresholds. On Target from 100%, At Risk 95% to 99%, Missed under 95% – all sitting in plain Status formulas you can change.
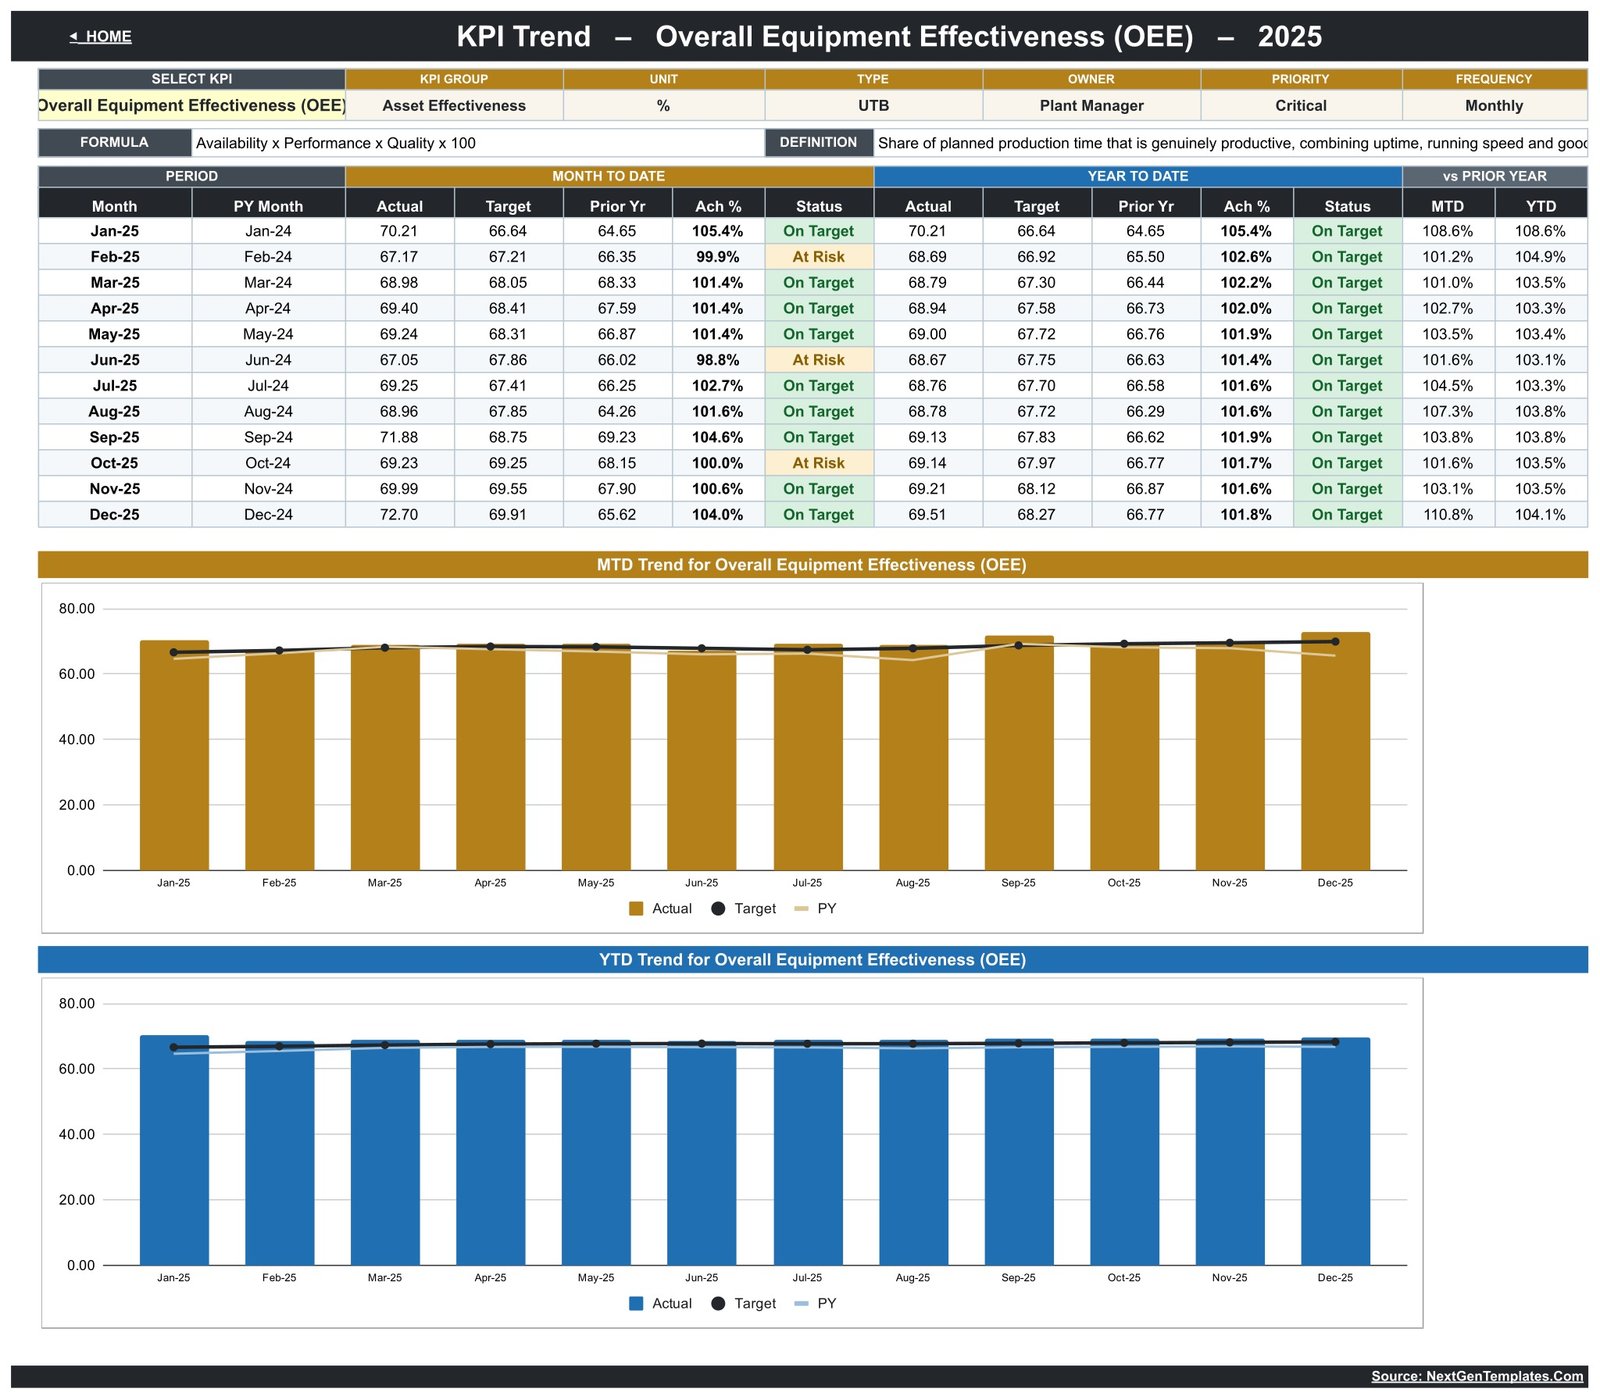
- KPI Trend page. Choose any KPI and read twelve months of MTD and YTD actual, target, prior year, achievement and status, with two charts underneath.
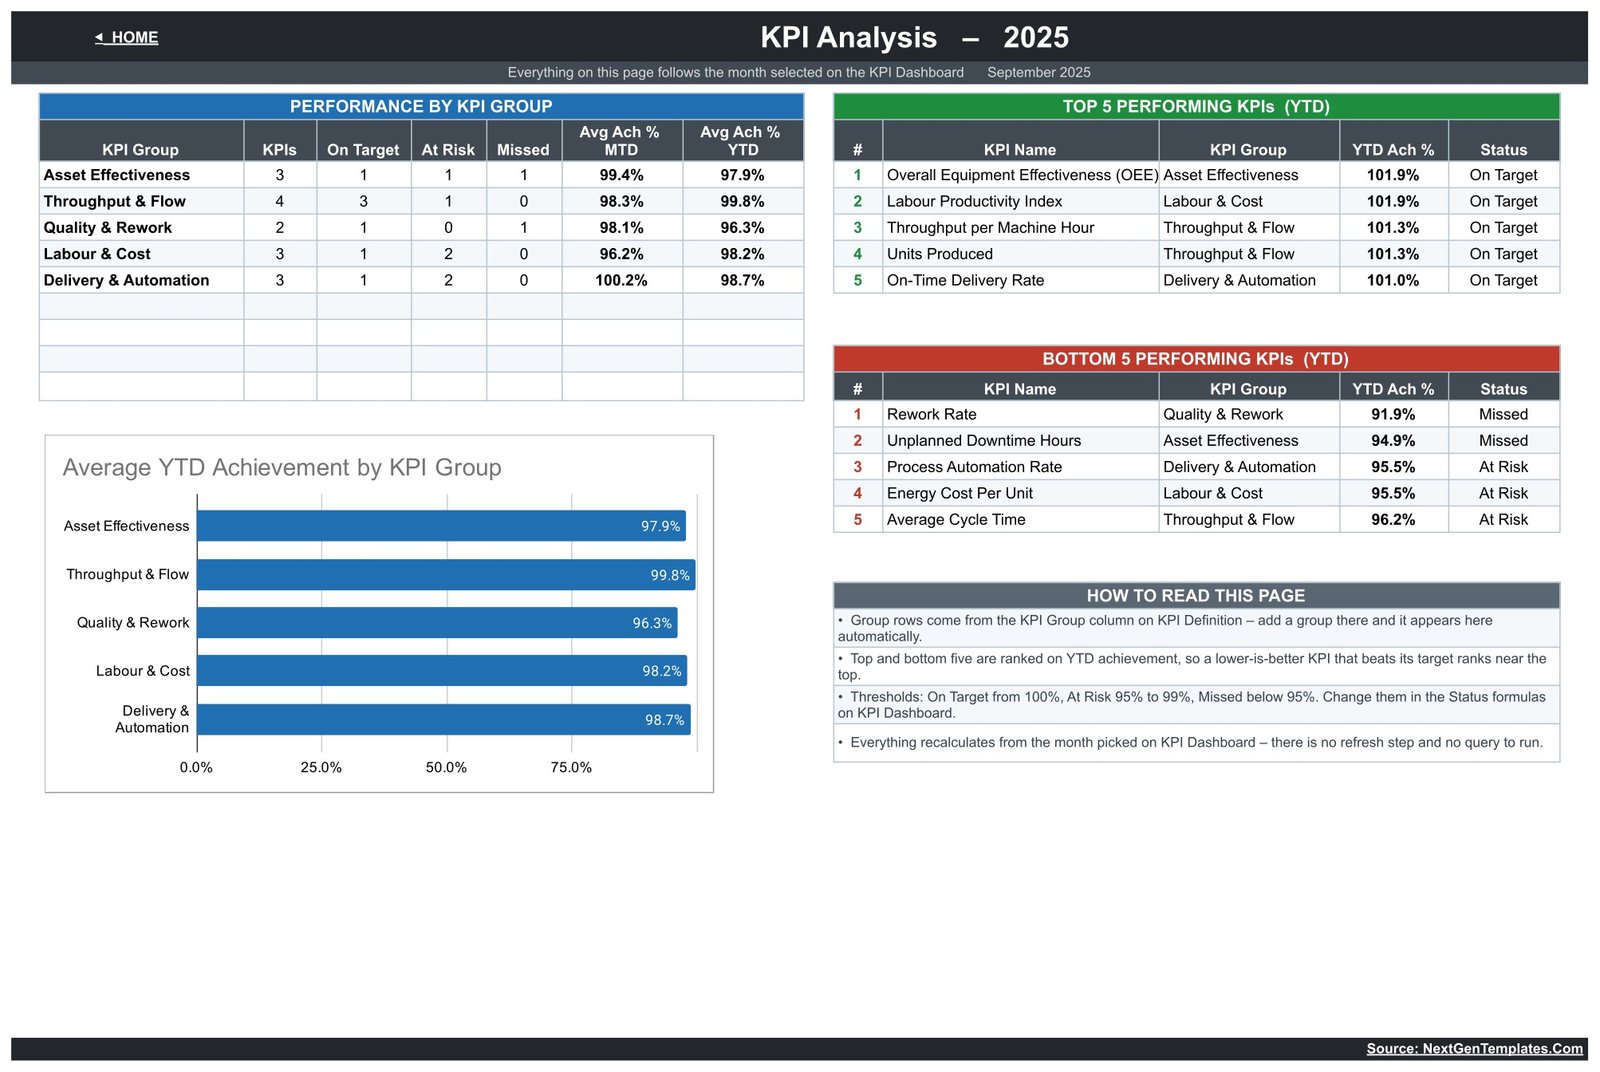
- KPI Analysis page. Group roll-up counts, average achievement per group, and ranked top five and bottom five KPIs for the year to date.
- Three plain input sheets. Actual, Target and Prior Year – type into the yellow cells, nothing else.
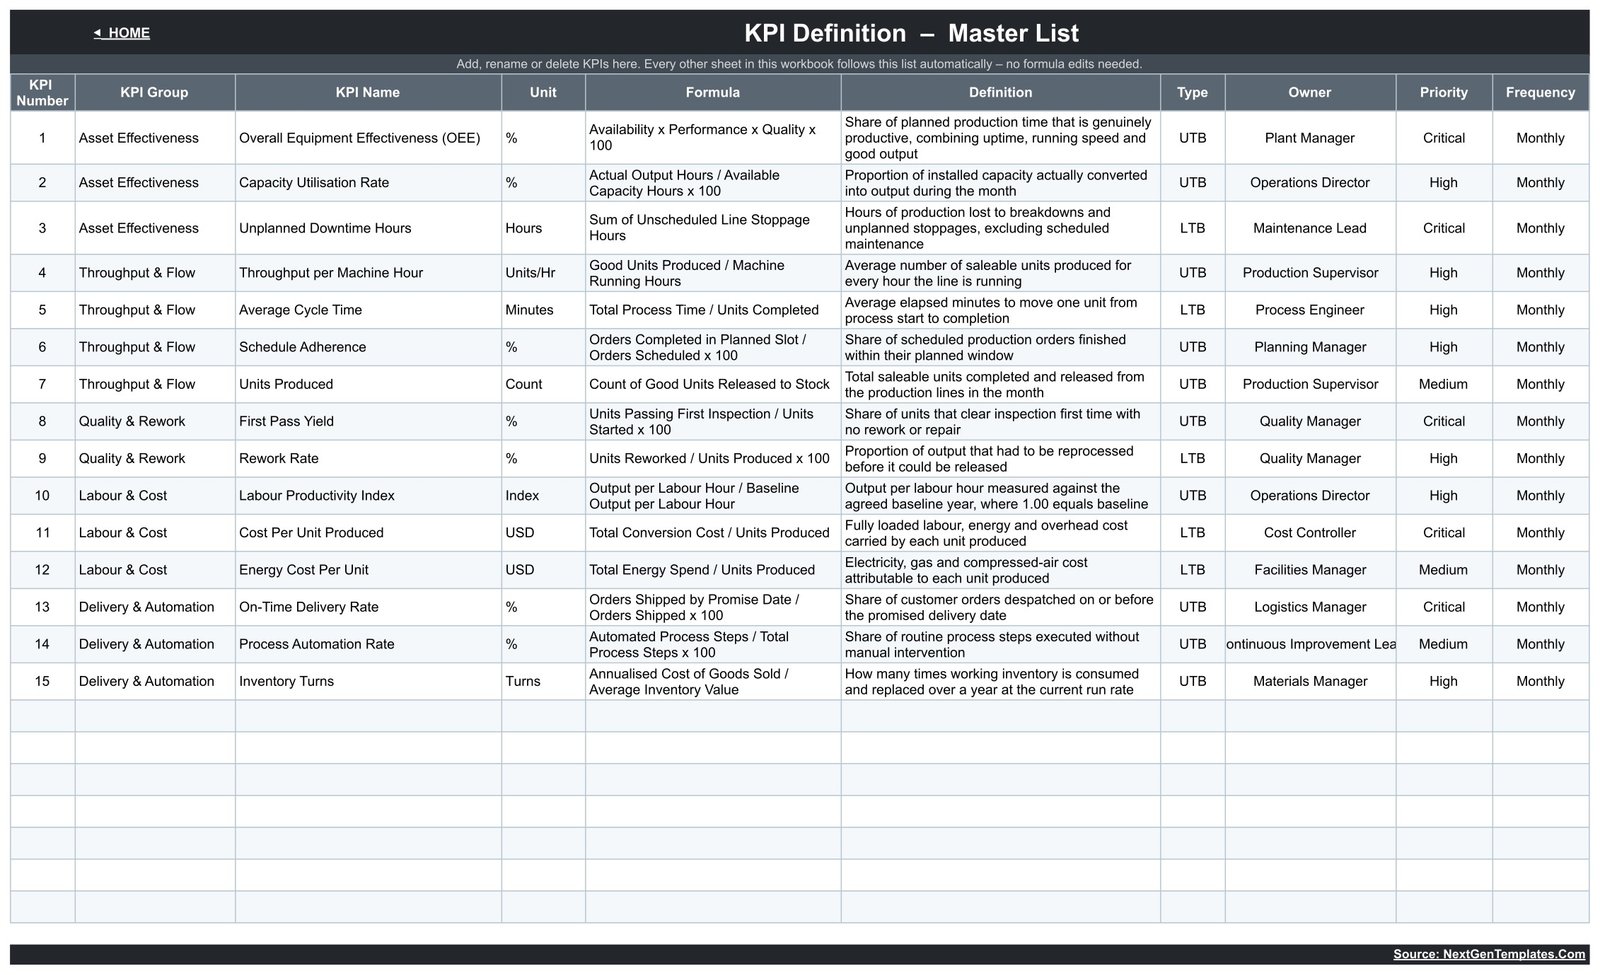
- KPI master list. Rename, add or delete a KPI on the KPI Definition sheet and every other sheet follows it automatically.
What’s Inside the Operational Efficiency KPI Dashboard
Home. A navigation page with three coverage cards (15 KPIs, MTD + YTD, 100% formula-driven), links to the three dashboard pages, the three input sheets and the reference sheets, plus a three-step start guide.
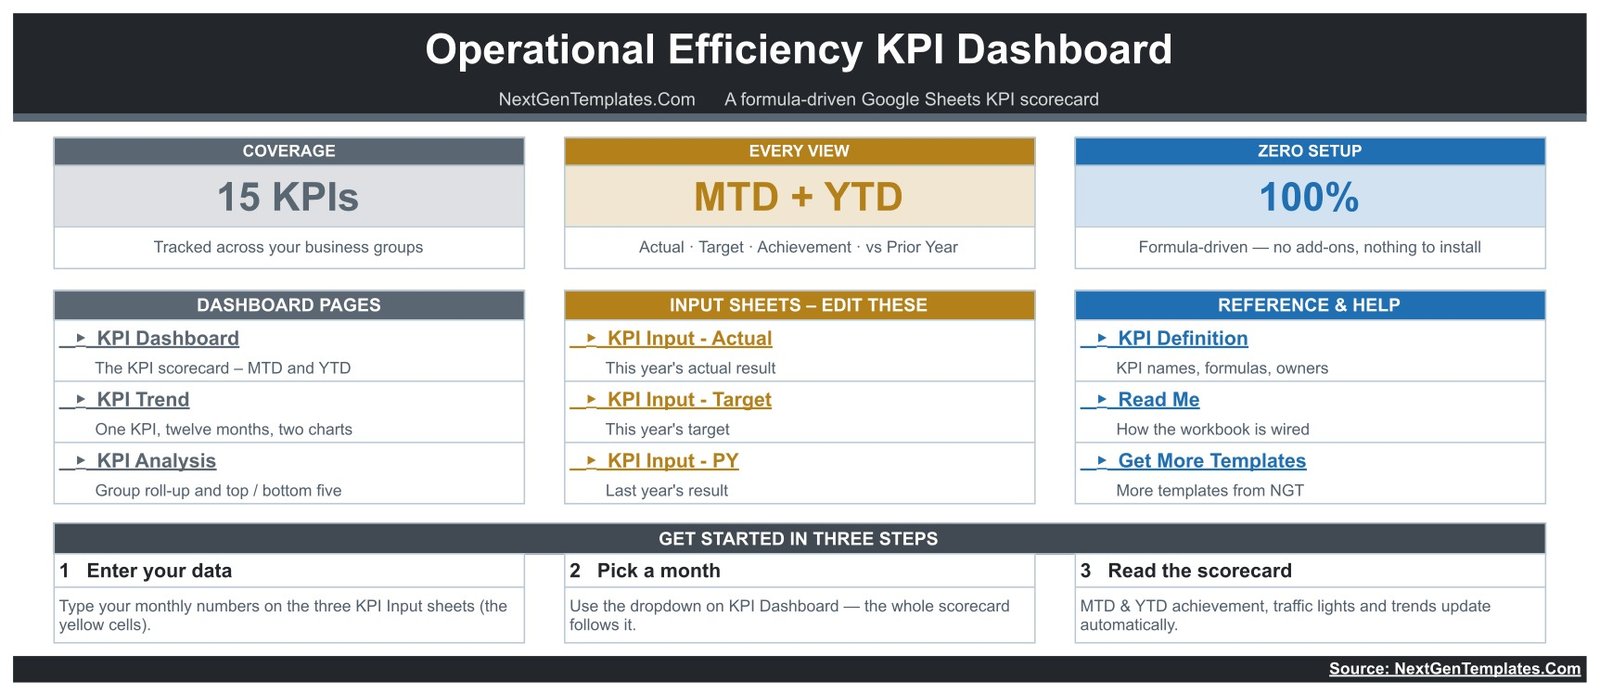
KPI Dashboard. The scorecard itself. Fifteen rows – Overall Equipment Effectiveness (OEE), Capacity Utilisation Rate, Unplanned Downtime Hours, Throughput per Machine Hour, Average Cycle Time, Schedule Adherence, Units Produced, First Pass Yield, Rework Rate, Labour Productivity Index, Cost Per Unit Produced, Energy Cost Per Unit, On-Time Delivery Rate, Process Automation Rate and Inventory Turns – each with unit, type, and the twelve MTD/YTD measurement columns.
KPI Trend. A single-KPI deep dive. The header repeats the KPI’s group, unit, type, owner, priority, frequency, formula and definition, then a twelve-month table runs Jan to Dec with MTD and YTD blocks and a vs Prior Year pair. Two charts sit below: MTD Trend for Overall Equipment Effectiveness (OEE) and YTD Trend for Overall Equipment Effectiveness (OEE), each plotting actual bars against a target marker line and a prior-year line.
KPI Analysis. Performance by KPI Group counts how many KPIs in each group are On Target, At Risk or Missed and averages their MTD and YTD achievement. Alongside it sit ranked Top 5 and Bottom 5 Performing KPIs for the year to date, and an Average YTD Achievement by KPI Group bar chart. A short “How to read this page” box explains the ranking and the thresholds.
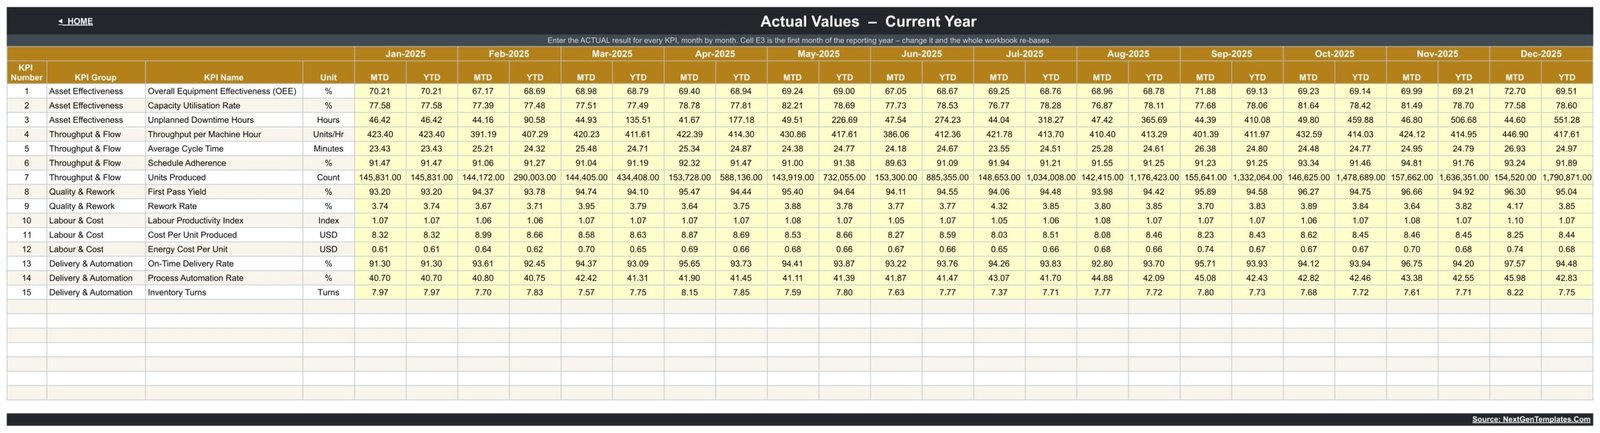
KPI Input – Actual, Target and PY. Three matching grids, one row per KPI and one column pair per month (MTD and YTD). Cell E3 sets the first month of the reporting year, so changing it re-bases the entire workbook to your fiscal calendar.
KPI Definition. The master list: KPI number, group, name, unit, formula, plain-English definition, UTB/LTB type, owner, priority and frequency for all fifteen KPIs – for example OEE is defined as Availability x Performance x Quality x 100 and owned by the Plant Manager.
Read Me explains how the workbook is wired, and Get More Templates links back to the wider NextGenTemplates library.
Operational Efficiency KPI Dashboard vs. Excel vs. Paid Ops Analytics SaaS – Where This Fits
| Point of comparison | This Google Sheets scorecard | Excel KPI workbook | Paid ops analytics SaaS |
|---|---|---|---|
| Cost | $8.99 one-time | One-time file, plus a Microsoft 365 licence per user | Recurring subscription that scales with users and connectors |
| Platform | Google Sheets in any browser | Desktop Excel (best experience) | Vendor web app |
| Setup time | Copy the sheet, paste your monthly numbers | Download, open, paste your numbers | Connect data sources, model metrics, build views |
| Real-time team collaboration | Yes, native multi-user editing | Only through OneDrive co-authoring | Yes |
| Mobile access | Google Sheets mobile app | Excel mobile app, limited | Yes |
| Customisable KPIs and fields | Fully – edit the KPI Definition list | Fully | Limited to the vendor’s metric model |
| Share with a link | Yes, standard Google Drive sharing | File attachment or cloud link | Seat-based sharing |
| Year-1 cost at 5 users | $8.99 total | Five Microsoft 365 licences | Annual subscription, renewed every year |
| MTD and YTD in one view | Yes, side by side per KPI | Depends on the workbook | Usually a date-range switch, not both at once |
| Lower-the-better KPI scoring | Built in per KPI (UTB/LTB) | Depends on the workbook | Configurable |
Who This Template Is For – and Who It’s Not For
It is for plant managers, operations directors, production supervisors, continuous-improvement leads and small manufacturing or fulfilment teams who report a fixed set of monthly operations KPIs and want one credible page for the monthly review.
It is not for you if you need live machine-level data – this is a monthly scorecard you type numbers into, not an MES or IoT feed. It is also not the right pick if you want to slice transactions by customer, product or region; that is the analytical dashboard line, not the scorecard line. And if your KPIs are measured daily or by shift, the monthly frequency here will feel coarse.
One honest note on presentation: at the default column widths a few long entries display truncated – the KPI name “Overall Equipment Effectiveness (OEE)” and the owner “Continuous Improvement Lead” on the KPI Definition sheet. The underlying cell values are complete and correct; widening the column by dragging its edge shows them in full.
How to Use the Operational Efficiency KPI Dashboard
- Open the PDF in your download and click the “Make a copy” link to put your own editable copy in Google Drive.
- Open KPI Definition and edit the fifteen KPI rows – rename them, change the owners, adjust the formulas and definitions, or delete the ones you do not track.
- Set cell E3 on KPI Input – Actual to the first month of your reporting year.
- Type your monthly results into the yellow cells on KPI Input – Actual, your goals into KPI Input – Target and last year’s results into KPI Input – PY.
- Go to KPI Dashboard and choose a month from the Select Month dropdown. The whole scorecard re-calculates.
- Open KPI Trend, pick a KPI from its dropdown, and read the twelve-month pattern before you write the commentary.
- Finish on KPI Analysis for the group roll-up and the bottom five list – that is your action list for the month.
Real-World Use Cases
Ravi, plant manager at a mid-size components factory. His monthly ops review used to be four separate spreadsheets. He now enters fifteen numbers, picks the month, and walks in with OEE at 104.6% of target for the month but Average Cycle Time missed – one page, no argument about whose figure is right.
Dana, continuous-improvement lead in a fulfilment centre. She uses the Bottom 5 Performing KPIs list on the KPI Analysis page to pick the quarter’s improvement projects, and the KPI Trend page to prove whether last quarter’s project actually moved the line.
Marcus, operations director across three sites. He keeps one copy of the sheet per site, shares each with the site lead through a Drive link, and compares the Avg Achievement (YTD) card across the three at the end of every month.
Frequently Asked Questions
Is this the same as an operations analytics dashboard?
No. This is a KPI scorecard: fixed KPIs, a month picker, targets, traffic lights and trends. An analytics dashboard slices transaction data by dimension with charts and slicers. Many teams run both – the scorecard for the monthly review, the analytics dashboard for the investigation that follows.
Can I change the KPIs to my own?
Yes. The KPI Definition sheet is the master list. Rename a KPI there, or add and remove rows, and the dashboard, trend and analysis pages follow automatically. No formula editing is required for a straight rename.
Does it need any add-on, script or connector?
No. Everything is native Google Sheets formulas and charts. There is nothing to install, nothing to authorise and no refresh step.
How do lower-is-better KPIs like Rework Rate work?
Each KPI is tagged UTB or LTB on the KPI Definition sheet. For UTB the achievement is Actual divided by Target; for LTB it is Target divided by Actual. Beating a cost, downtime or cycle-time target therefore scores above 100%, the same as beating an output target.
Can my team use it at the same time?
Yes. It is an ordinary Google Sheets file, so normal Drive sharing and simultaneous editing apply. Give data owners edit access to the input sheets and everyone else view access.
What exactly do I download?
A PDF. It previews every page and carries the “Make a copy” link that creates your own editable Google Sheets copy. The master sheet stays view-only so your copy is always clean.
Does it work in Microsoft Excel?
This build is made for Google Sheets. You can export a copy to .xlsx, but the dropdowns and charts are tuned for Sheets – if you want an Excel-native scorecard, browse the Excel KPI dashboards in our library instead.
About the Author
Built by PK – Microsoft Certified Professional with 15+ years of Excel, Google Sheets, and Power BI experience. Founder of NextGenTemplates, reaching 300K+ subscribers across YouTube channels. Every template is hand-built and tested before release.
Explore Related Templates
- Data Warehouse KPI Dashboard in Google Sheets – the same scorecard engine pointed at data-platform KPIs.
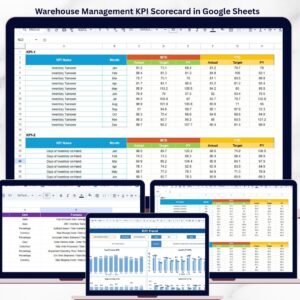
- Warehouse Management KPI Scorecard in Google Sheets – pair it with this one to cover storage and dispatch.
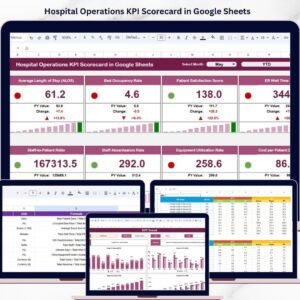
- Hospital Operations KPI Scorecard in Google Sheets – the healthcare cut of the same operations idea.
- Daily Production Output Tracker in Google Sheets – capture output daily, then roll the monthly total into this scorecard.
- Coaching Networks Dashboard in Excel – if your improvement programme runs through coaches and mentors.
- Browse the full Google Sheets KPI Dashboard category or the wider Google Sheets template library.
Ready to run a cleaner monthly ops review? Download the Operational Efficiency KPI Dashboard in Google Sheets, make your copy, and enter your first month tonight. Instant download, lifetime access, free bug fixes.
Watch the step-by-step video Demo:
Last updated: 18 August 2026.
Compatibility and Requirements
- Works in Google Sheets. You need a free Google account and a web browser.
- You pick the month from a dropdown on the KPI Dashboard sheet, and the KPI Trend sheet has its own KPI dropdown. Google explains dropdowns in Create an in-cell dropdown list.













Reviews
There are no reviews yet.