

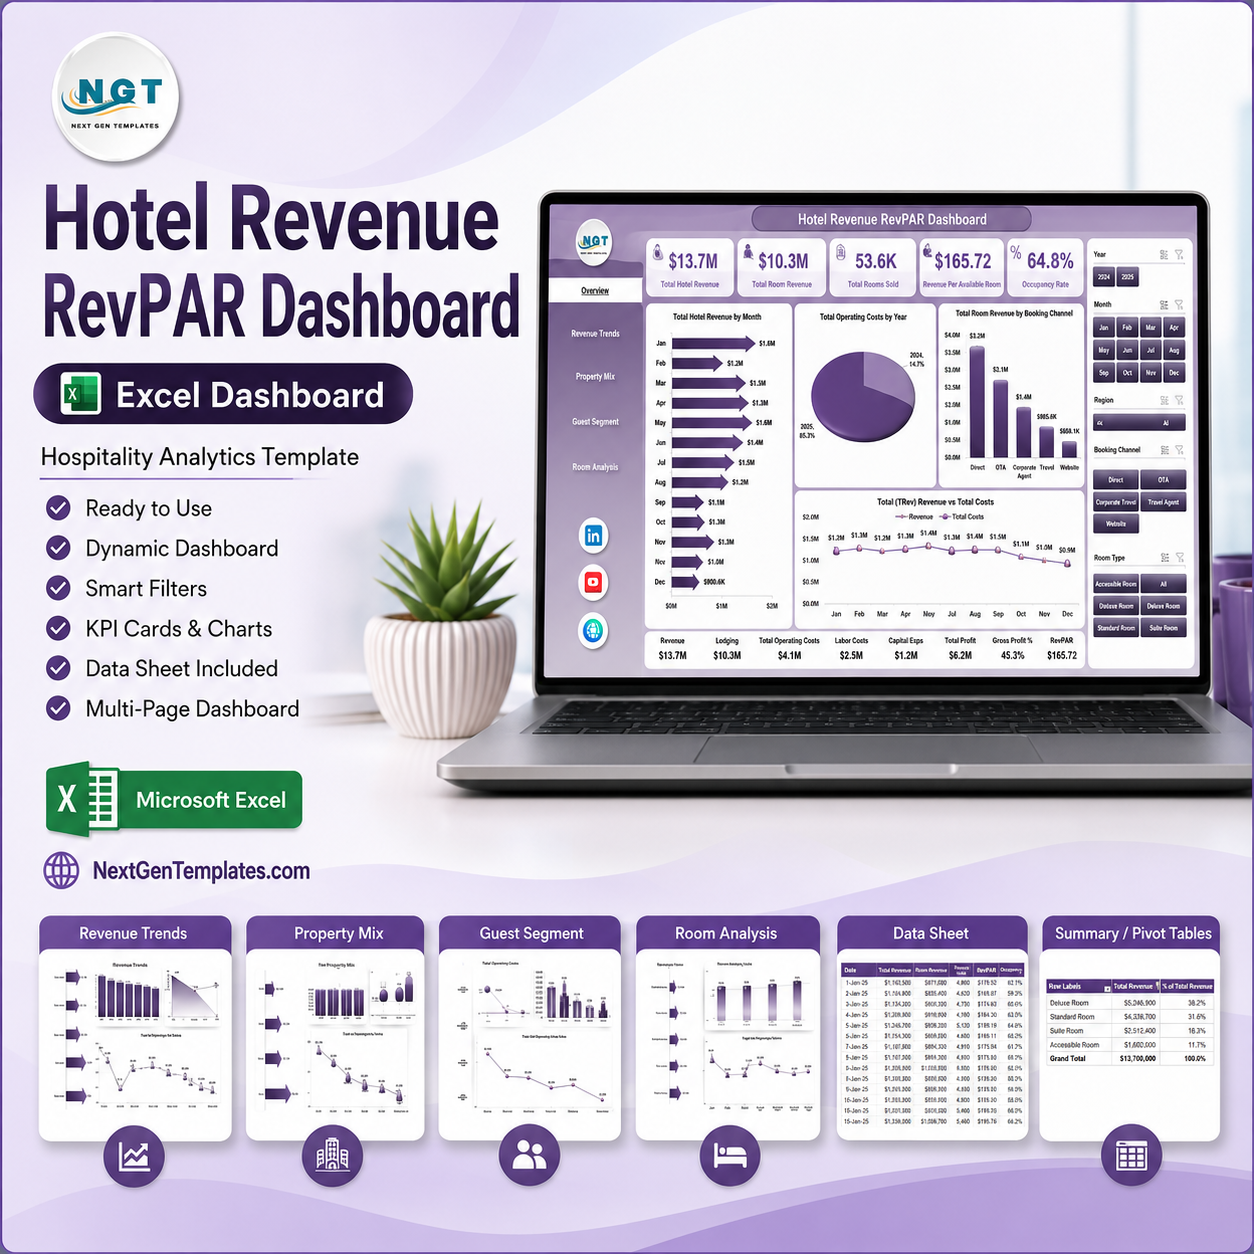



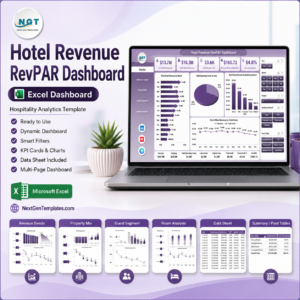
Hotel Revenue RevPAR Dashboard in Excel gives hotel managers a 7-sheet revenue reporting workbook with 5 executive KPI cards, 18 pivot-driven charts, slicers, a data sheet, and a support sheet for refreshable analysis. Instead of building RevPAR, occupancy, room revenue, F&B revenue, channel, region, and room-type reports from scratch, you can update the sample data and refresh the workbook in minutes. Join 8,400+ teams in 40+ countries using NextGenTemplates for one-time-purchase Excel, Google Sheets, Power BI, and HTML templates. Instant download, lifetime access, no monthly subscription, and support if anything does not work as described.
Key Features of Hotel Revenue RevPAR Dashboard in Excel
- 5 KPI cards on the Overview page – Total Hotel Revenue, Total Room Revenue, Total Rooms Sold, Revenue Per Available Room, and Occupancy Rate % give leadership a quick read on hotel performance.
- 18 analysis charts – Review monthly revenue, operating cost, booking channel mix, F&B revenue, gross profit, property mix, guest segments, room type performance, and satisfaction trends.
- Interactive slicers – Filter the dashboard quickly by hotel, region, city, room type, property type, booking channel, guest segment, status, and other fields in the workbook.
- RevPAR-focused reporting – Track Revenue Per Available Room by room type and combine it with occupancy and room revenue views for practical revenue-management decisions.
- Data sheet included – Replace the sample records with your own hotel data in the same column structure, then refresh pivots and charts.
- Support sheet with pivots – The support tab holds the pivot tables that power the dashboard and can be hidden after setup.
- Excel-first workflow – Works inside Microsoft Excel without paying for a separate hotel BI platform or SaaS dashboard.
What’s Inside the Hotel Revenue RevPAR Dashboard in Excel
Overview Page
The Overview page summarizes high-level hotel performance through cards for Total Hotel Revenue, Total Room Revenue, Total Rooms Sold, Revenue Per Available Room, and Occupancy Rate %. The Total Hotel Revenue by Month chart highlights monthly seasonality, while Total Operating Cost by Year helps compare annual cost pressure. Total Room Revenue by Booking Channel shows which channels drive room income, and Total F&B Revenue by Hotel helps identify properties with stronger food and beverage contribution.
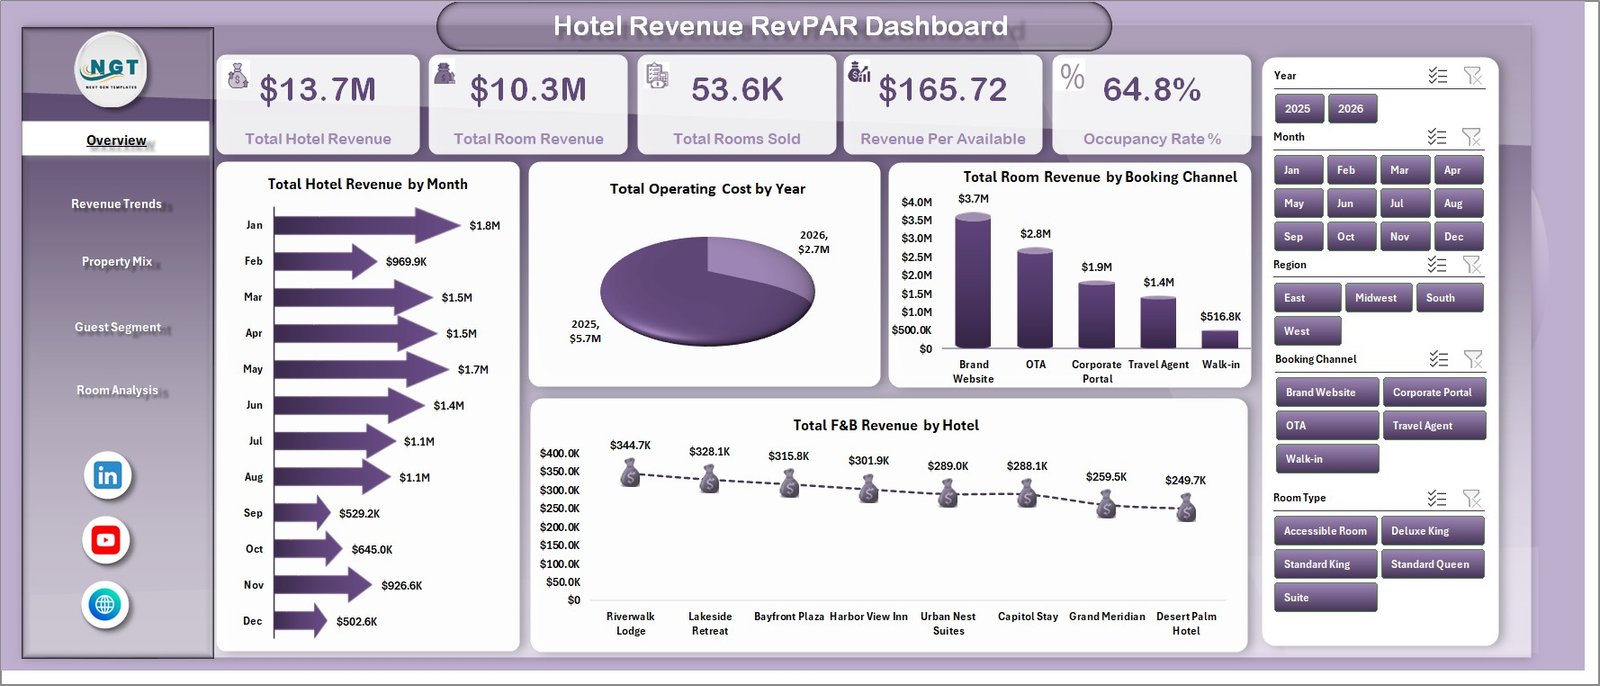
Hotel Revenue RevPAR Dashboard in Excel
Revenue Trends
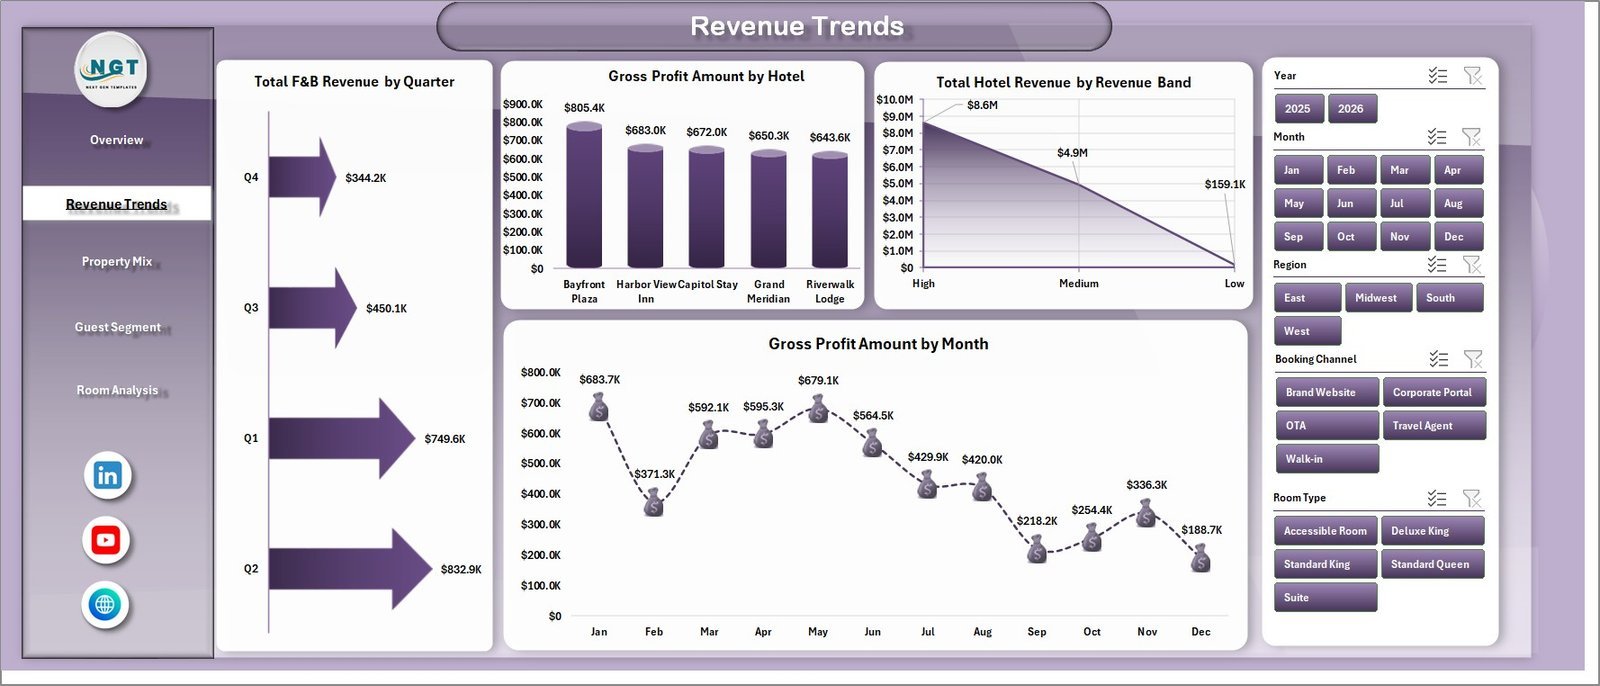
The Revenue Trends sheet focuses on quarterly F&B revenue, gross profit by hotel, total revenue by revenue band, and gross profit by month. This page helps revenue and finance teams see whether growth is coming from room sales, ancillary spend, price bands, or property-level margin improvements.
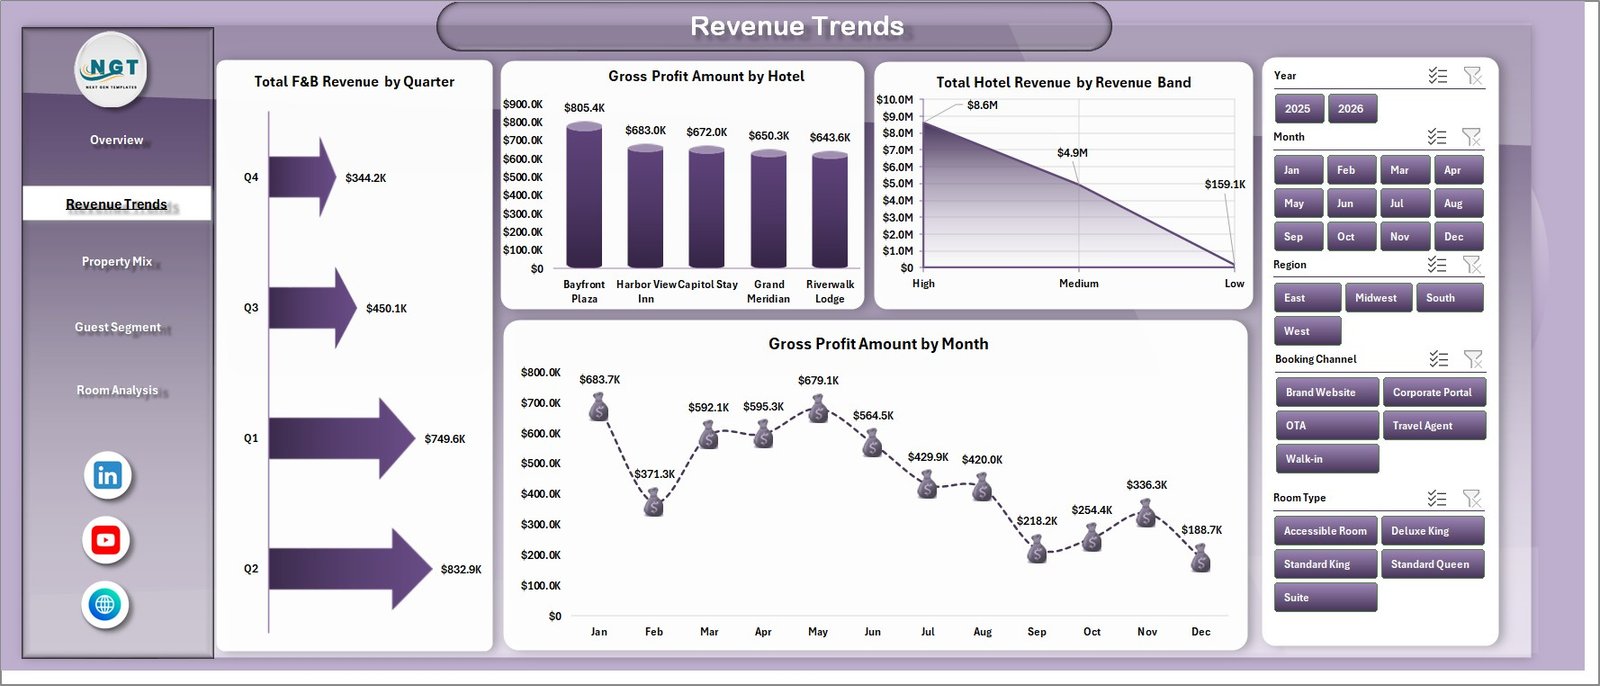
Revenue Trends
Property Mix
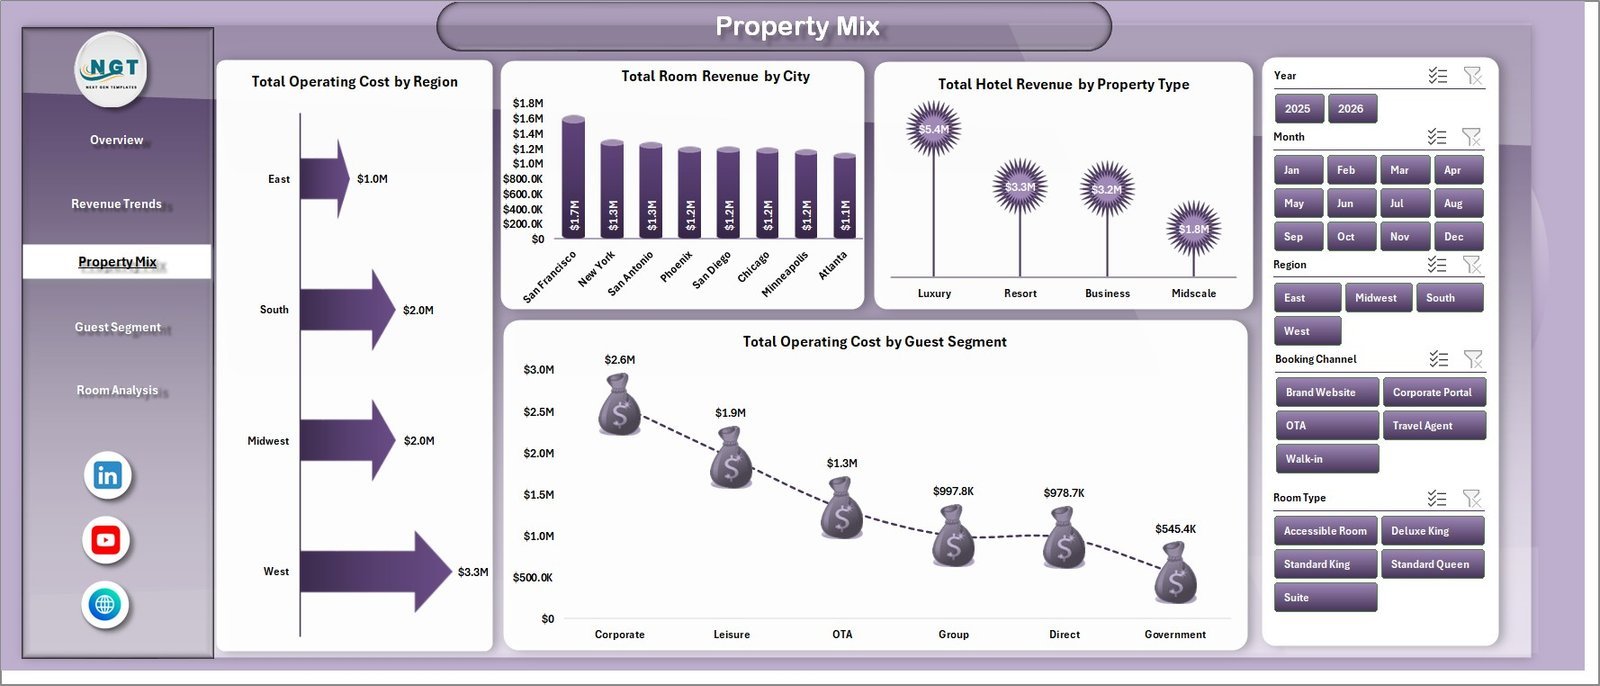
The Property Mix tab compares Total Operating Cost by Region, Total Room Revenue by City, Total Hotel Revenue by Property Type, and Total Operating Cost by Guest Segment. It is useful when you manage multiple cities or property categories and need to spot where revenue and cost behave differently.
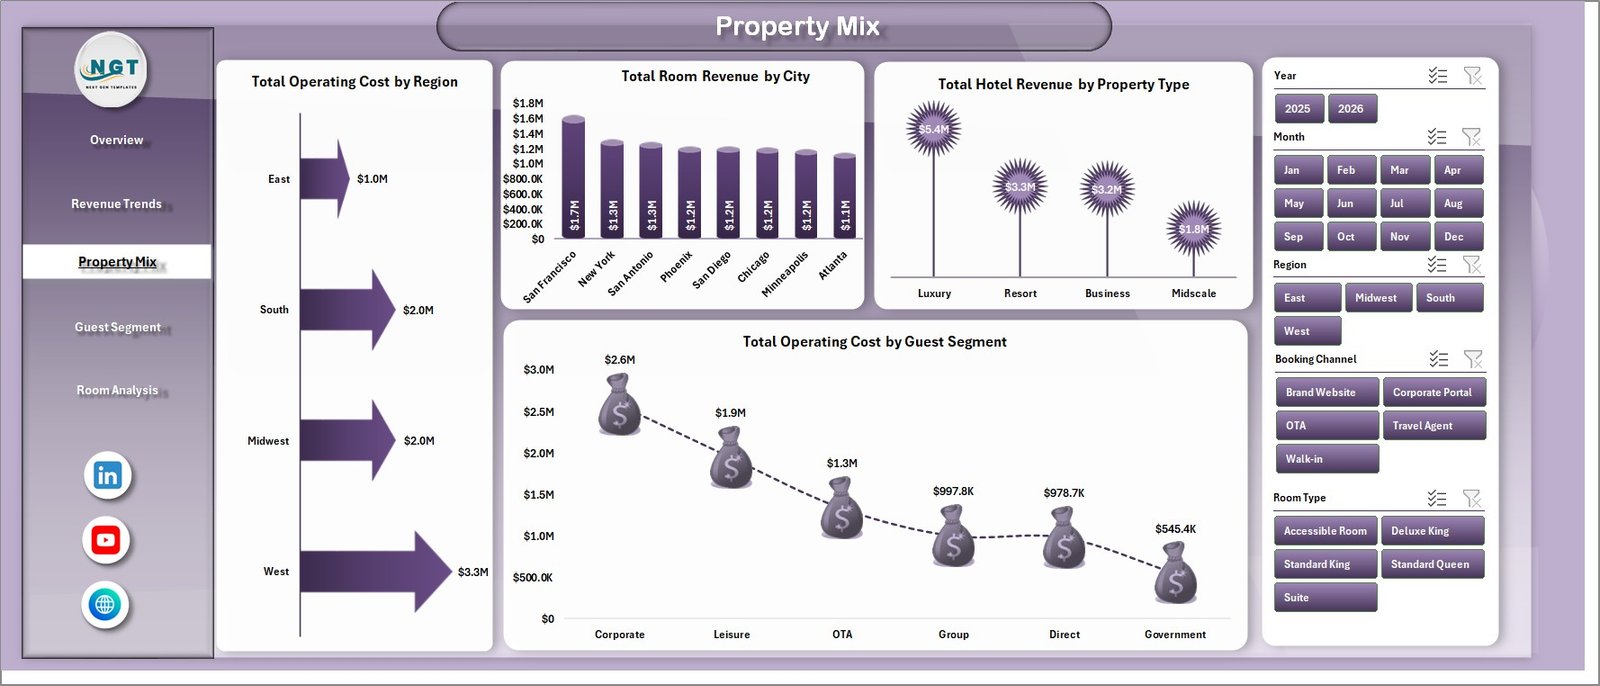
Property Mix
Guest Segment
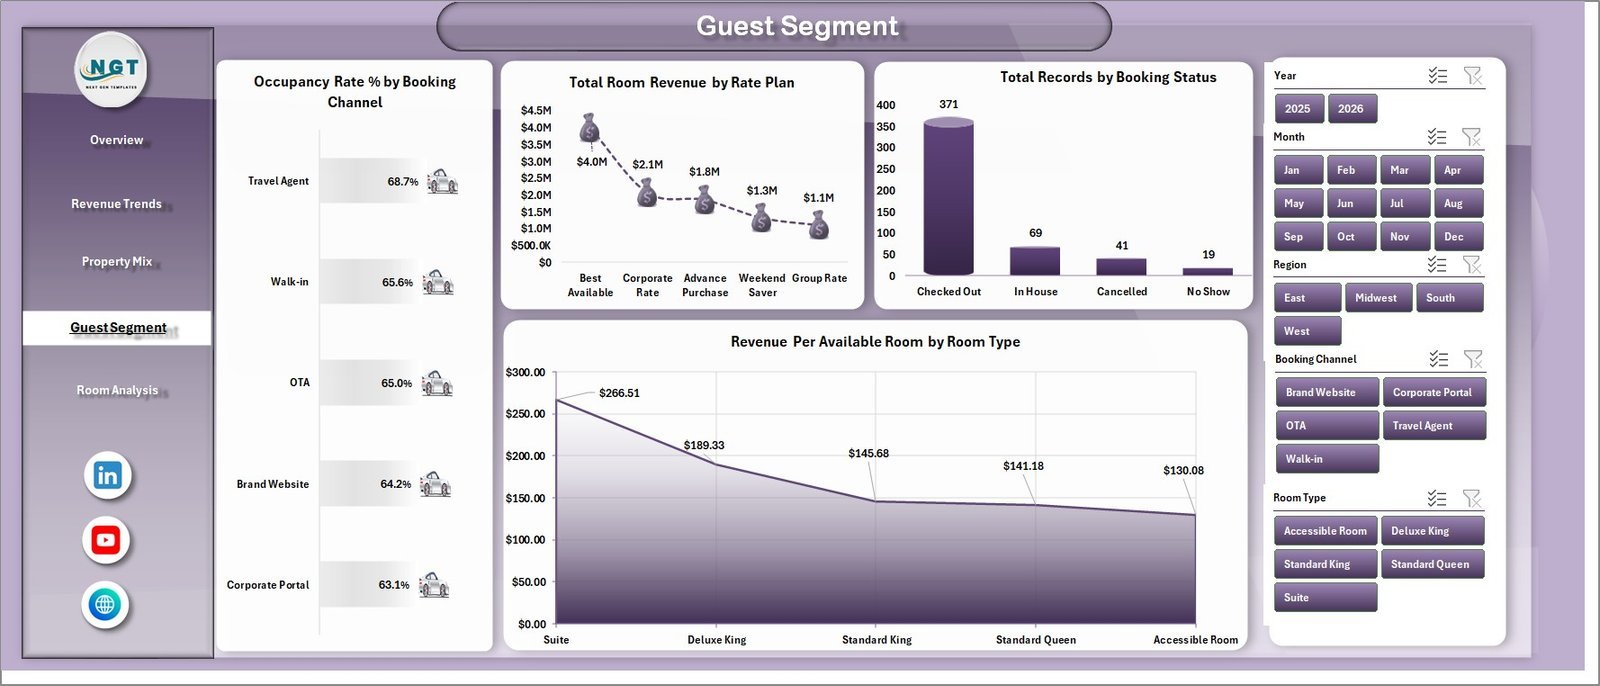
The Guest Segment page analyzes Occupancy Rate % by Booking Channel, Total Room Revenue by Rate Plan, Total Records by Booking Status, and Revenue Per Available Room by Room Type. Use it to understand whether guest behavior, room mix, or rate plans are improving RevPAR.
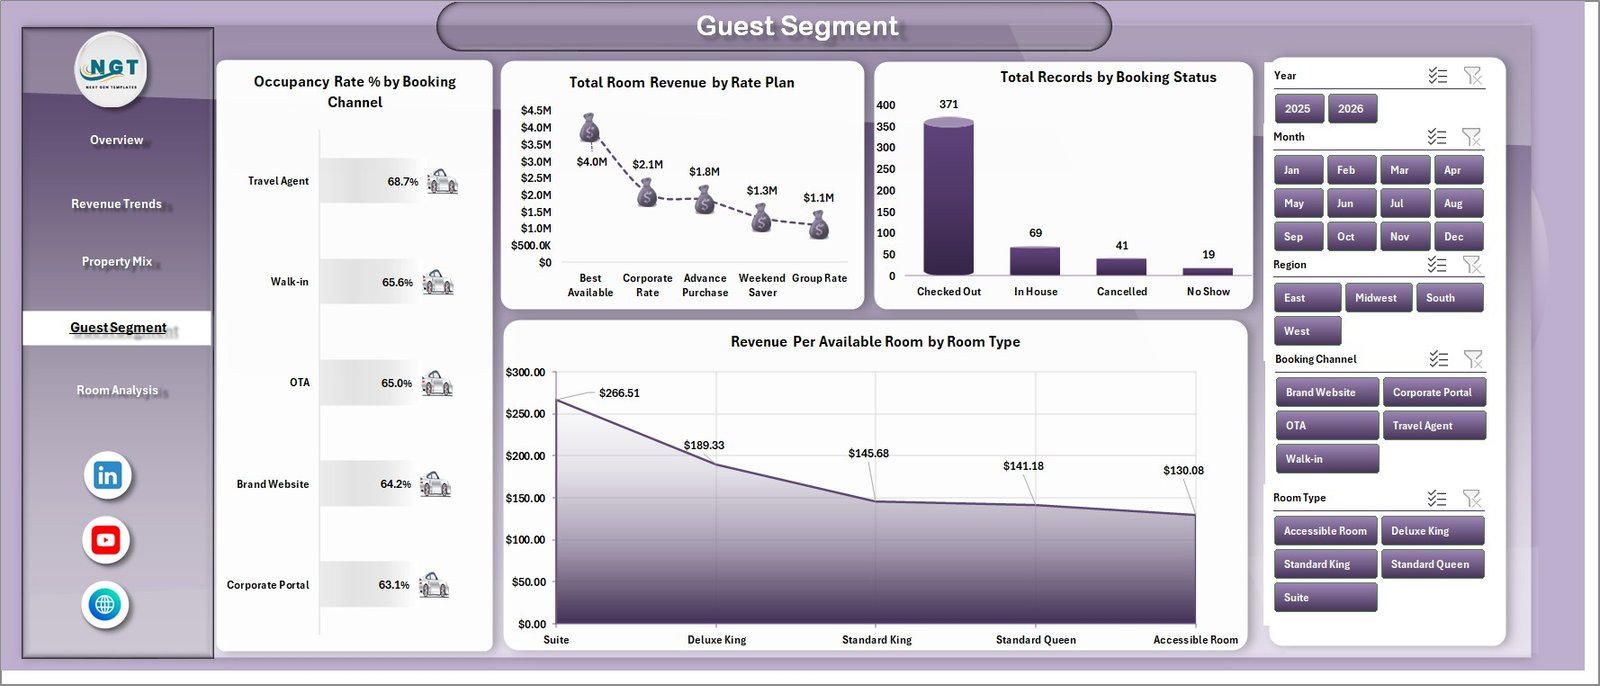
Guest Segment
Room Analysis
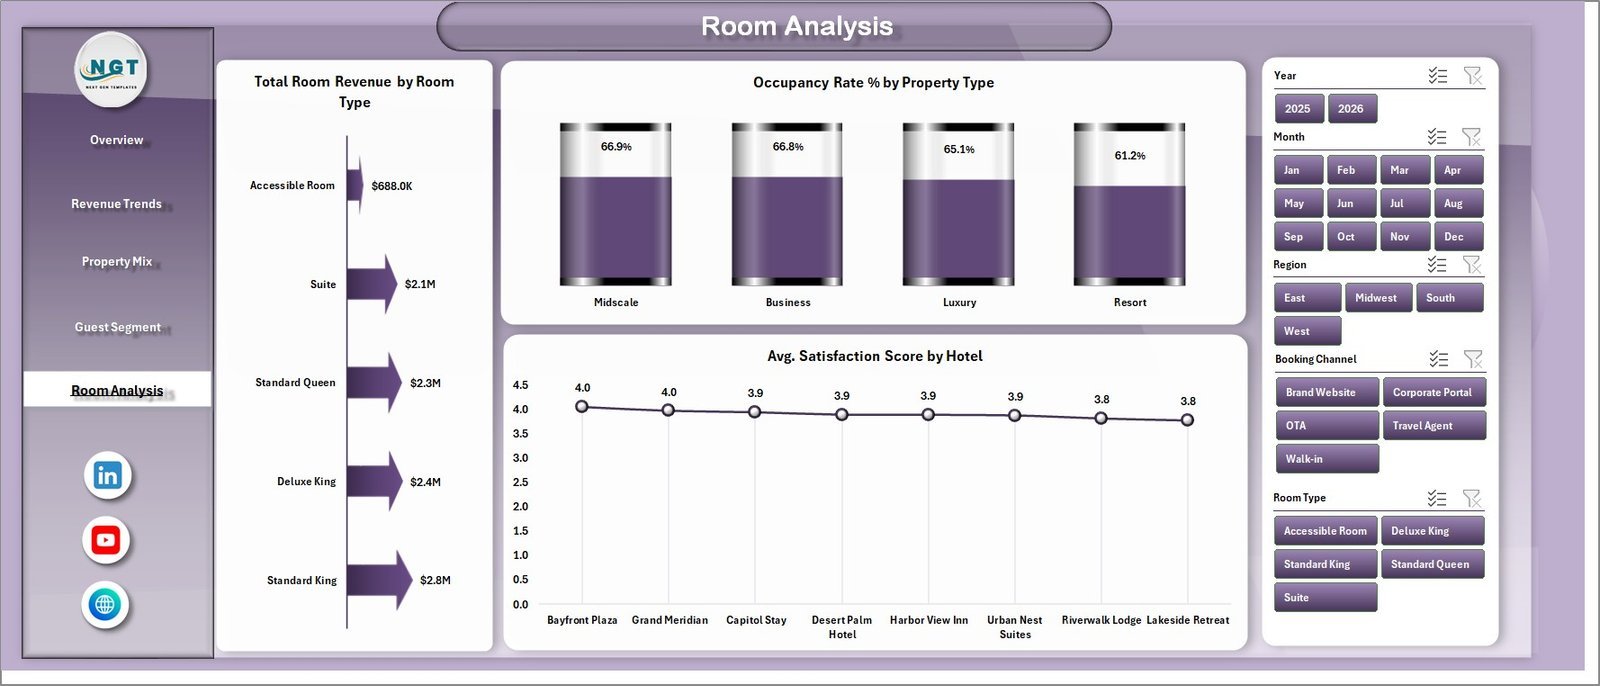
The Room Analysis tab shows Total Room Revenue by Room Type, Occupancy Rate % by Property Type, and Avg. Satisfaction Score by Hotel. This helps compare room categories and property positioning while keeping customer satisfaction visible beside revenue performance.
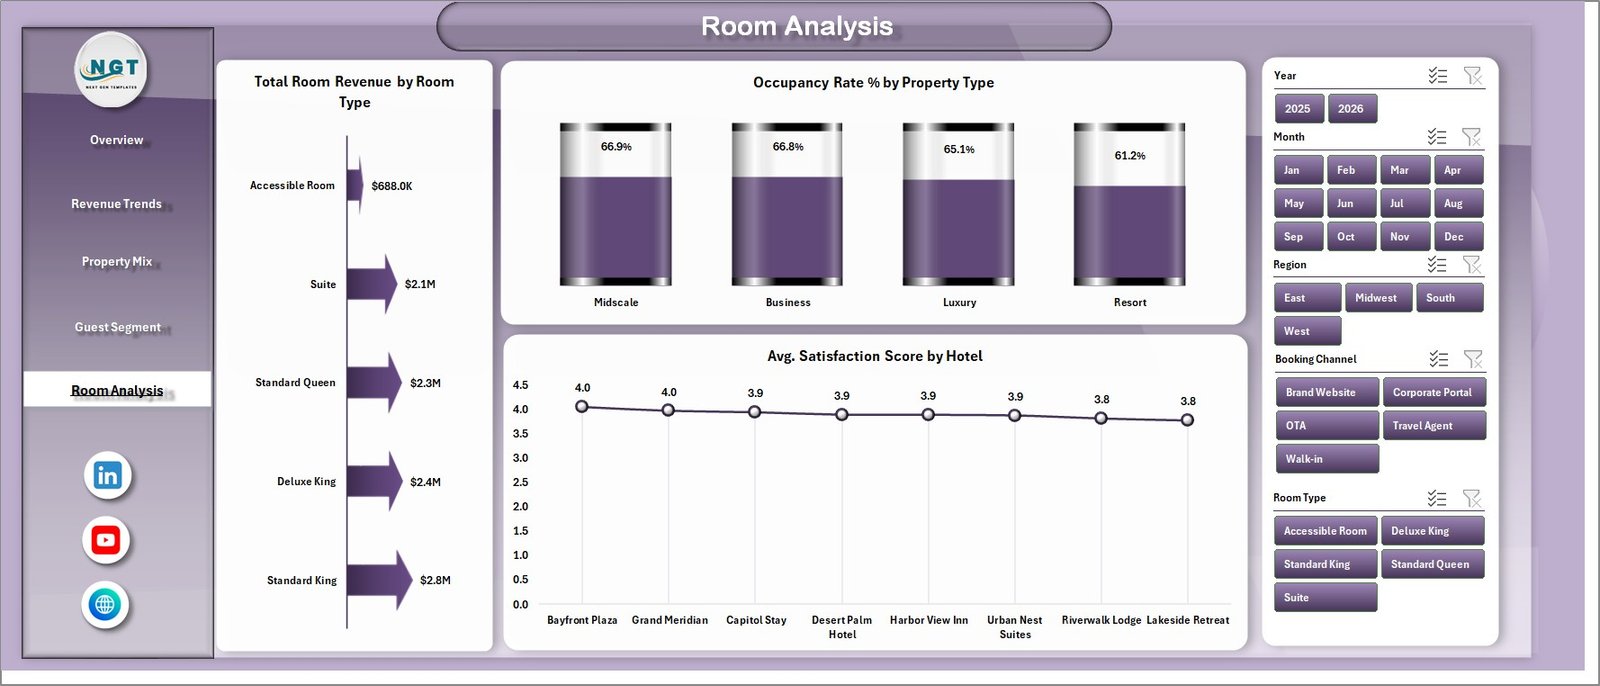
Room Analysis
Data Sheet and Support Sheet
The Data sheet is where you add hotel records in the same format as the sample data. The Support sheet contains the pivot tables used to build the dynamic charts. After updating the Data sheet, go to the Excel Data ribbon and click Refresh All so all pivots and dashboard charts refresh together.

Data Sheet tab

Support sheet tab
Hotel Revenue RevPAR Dashboard in Excel vs. Google Sheets vs. Paid Hotel BI SaaS – Where This Fits
| Feature | This Excel dashboard | Google Sheets alternative | Paid hotel BI SaaS |
|---|---|---|---|
| Cost | $17.99 sale price | Free to build, but manual | Often monthly per property or user |
| Platform | Microsoft Excel | Browser-based spreadsheet | Cloud SaaS |
| Setup time | Replace data and refresh | Build charts and formulas yourself | Vendor onboarding required |
| RevPAR analysis | Built-in KPI and room-type views | Requires custom formulas | Usually included |
| Customizable fields | Editable workbook and data sheet | Editable | Limited by plan/settings |
| Year-1 cost at 5 users | $17.99 one time | $0 plus build time | Can reach hundreds or thousands |
Who This Template Is For – and Who It’s Not For
Best for: hotel owners, revenue managers, general managers, finance analysts, hospitality consultants, and multi-property teams that want Excel-based revenue and RevPAR reporting.
Not ideal for: properties needing live PMS integration, channel-manager sync, real-time multi-user editing, automated guest messaging, or payment processing.
How to Use the Hotel Revenue RevPAR Dashboard in Excel
- Download and unzip the file.
- Open the workbook in Microsoft Excel.
- Go to the Data sheet and replace sample rows with your hotel records in the same format.
- Use the Excel Data ribbon and click Refresh All.
- Review the Overview, Revenue Trends, Property Mix, Guest Segment, and Room Analysis sheets.
- Hide the Support sheet if you want a cleaner user-facing workbook.
Real-World Use Cases
Ana, a revenue manager for a 3-property boutique group, uses the dashboard each Monday to compare RevPAR by room type and identify which booking channels are producing high occupancy but weaker revenue.
Rahul, a hotel finance manager, reviews operating cost by region and gross profit by month before month-end reporting, then exports charts for the owner meeting.
Melissa, a hospitality consultant, loads client sample data into the workbook to show where room revenue, F&B revenue, and satisfaction scores need attention.
Frequently Asked Questions
What does RevPAR mean?
RevPAR means Revenue Per Available Room. It is commonly used in hotel revenue management to compare room revenue against available room capacity.
Can I add my own hotel data?
Yes. Replace the sample records in the Data sheet using the same column layout, then refresh all pivots and charts.
Does this workbook support multiple hotels?
Yes. The dashboard includes hotel, region, city, and property-type analysis, so it can be used for single-property or multi-property reporting.
Do I need Power BI?
No. This is an Excel dashboard. You only need Microsoft Excel to edit the data and refresh the workbook.
Can I hide the Support sheet?
Yes. The Support sheet contains pivot tables for the dashboard engine and can be hidden after setup.
Is this connected to a live PMS?
No. It is a standalone Excel dashboard. Export your PMS data to Excel/CSV, paste it into the Data sheet, and refresh the dashboard.
About the Author
Built by PK – Microsoft Certified Professional with 15+ years of Excel, Google Sheets, and Power BI experience. Founder of NextGenTemplates, reaching 300K+ subscribers across YouTube channels. Every template is hand-built and tested before release.
Explore Related Templates
- Hotel and Hospitality Revenue Dashboard in Excel
- Hotel and Hospitality Revenue Dashboard in HTML
- Hotel Chains KPI Dashboard in Excel
- Web App Based Hotel Booking Management System
- Read the detailed blog post
Browse more Excel Dashboard Templates and MS Excel Templates.
Download the Hotel Revenue RevPAR Dashboard in Excel today and turn raw hotel records into clear revenue, occupancy, and RevPAR insights.
Last updated: July 2026
Watch the demo video:
Compatibility and Requirements
- Works in Microsoft Excel desktop (Excel 2016 or later, or Microsoft 365).
- The dashboard is built on pivot tables and charts. Refresh them with Refresh All on the Data tab after you update the Data sheet. Microsoft explains pivot tables in Create a PivotTable to analyze worksheet data.
Related Hotel Templates
- Hotel Revenue RevPAR Dashboard in Power BI: the same RevPAR reporting in Power BI
- Hotel Hospitality Revenue Dashboard in Google Sheets: a hotel revenue dashboard in Google Sheets
- Boutique Hotels Dashboard in Excel: a dashboard for boutique properties
- Hotel Chains Dashboard in Excel: a view for multi-property groups
Browse all Excel dashboard templates.


























Reviews
There are no reviews yet.