

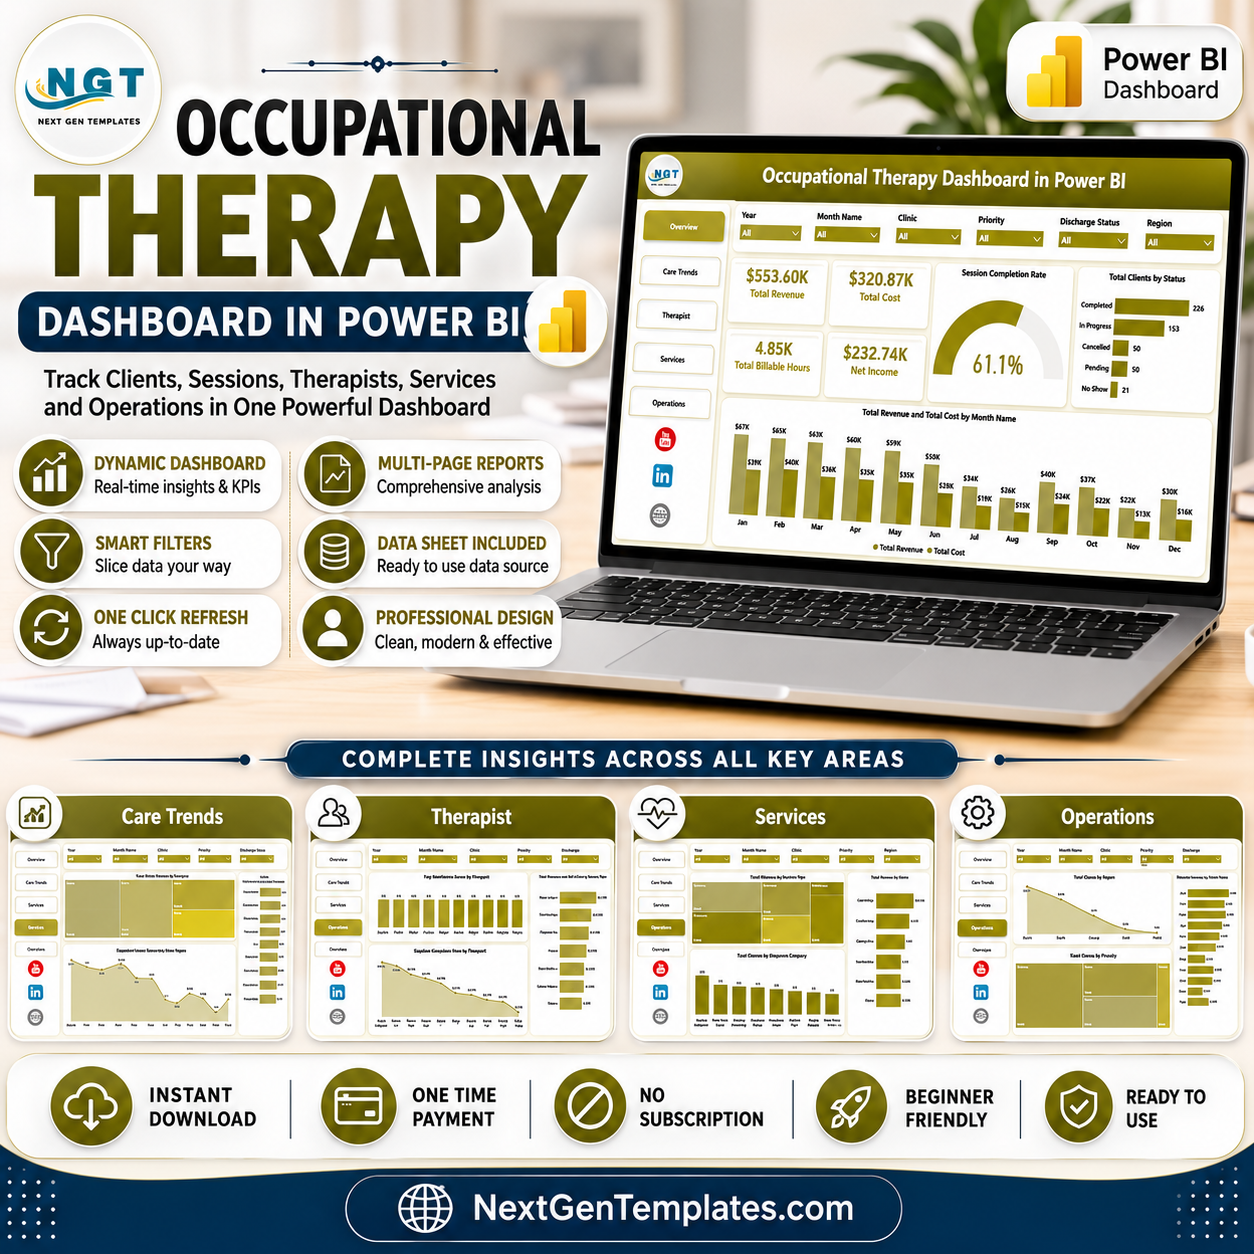

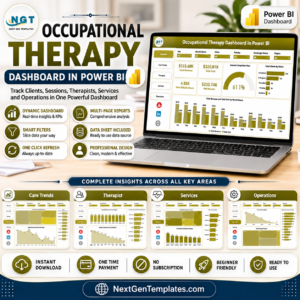
Occupational Therapy Dashboard in Power BI gives clinic owners, therapy managers, finance teams, and healthcare analysts a ready Power BI reporting file for revenue, cost, billable hours, clients, sessions, therapist performance, services, and operations. The template includes 5 dashboard pages, 6 high-level KPI cards, multiple slicers, and 15 chart views for a one-time $17.99 sale price. Instead of rebuilding reports every month, connect or replace your sample data, refresh the model, and review key occupational therapy performance signals in Power BI Desktop.
Key Features of Occupational Therapy Dashboard in Power BI
- 5 Power BI pages: Overview, Care Trends, Therapist, Services, and Operations.
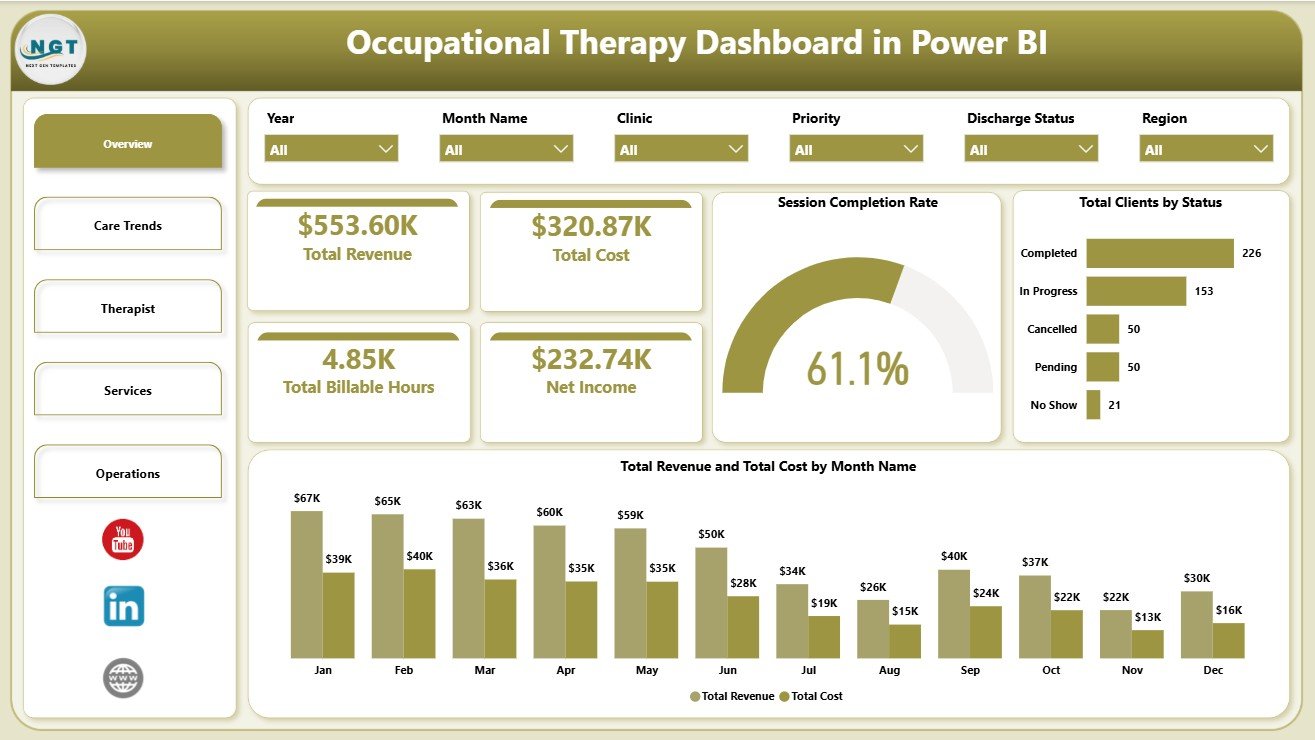
- Executive cards: Total Revenue, Total Cost, Total Billable Hours, Net Income, Session Completion Rate, and Total Clients by Status.
- Interactive slicers: Filter the dashboard quickly by therapy and operational dimensions.
- Financial tracking: Compare revenue, cost, and net income by month and service area.
- Client and session analysis: Review completion rate, client status, referral sources, diagnosis categories, region, and priority.
- Therapist insights: Compare satisfaction score, session completion, and service profitability.
What’s Inside the Occupational Therapy Dashboard in Power BI
1 – Overview Page
The Overview Page gives leadership a high-level readout of Total Revenue, Total Cost, Total Billable Hours, Net Income, Session Completion Rate, and Total Clients by Status. Session Completion Rate by Overall Sessions helps users understand how many planned sessions convert into completed care activity. Total Clients by Status shows the client pipeline and makes active, pending, discharged, or completed groups easier to review. Total Revenue and Total Cost by Month Name compares income and cost movement so managers can spot periods where margins need attention.
2 – Care Trends
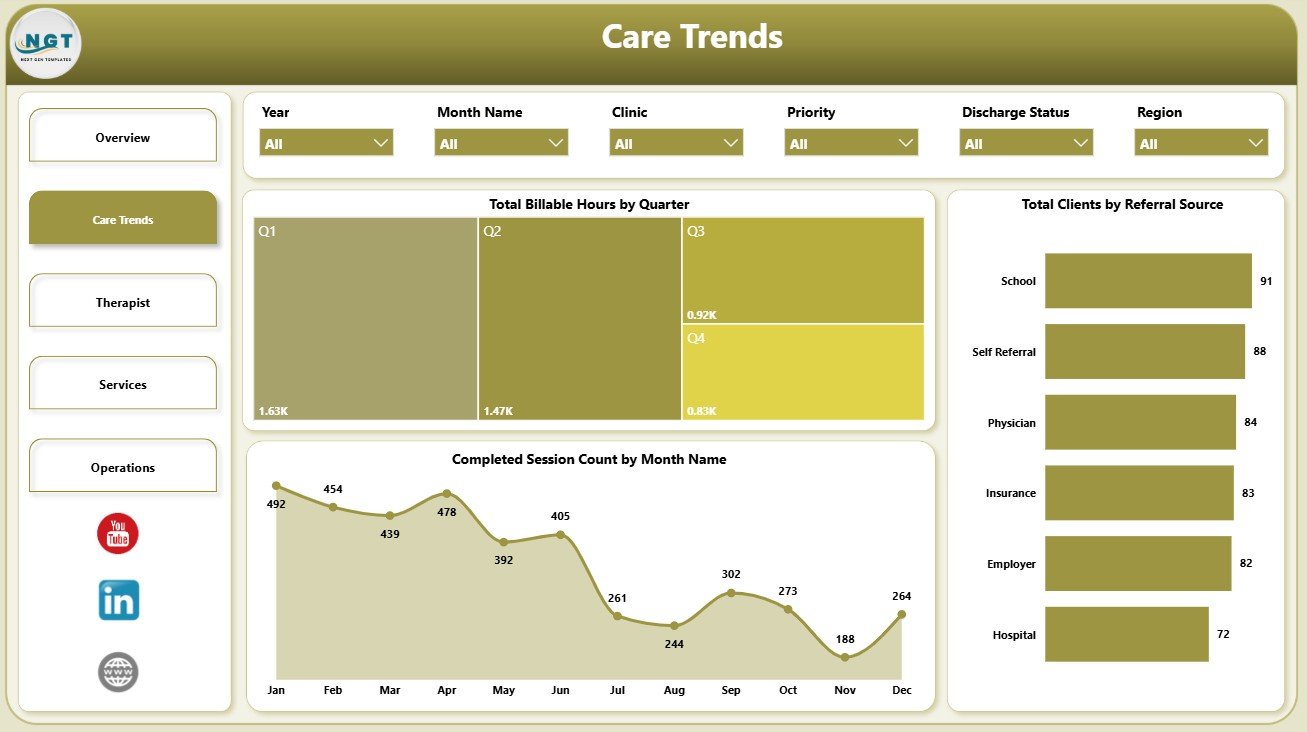
Total Billable Hours by Quarter shows seasonal workload and helps with staffing conversations. Completed Session Count by Month Name tracks delivery volume over time and can reveal changes in attendance or scheduling. Total Clients by Referral Source shows which referral channels are contributing the most client volume.
3 – Therapist
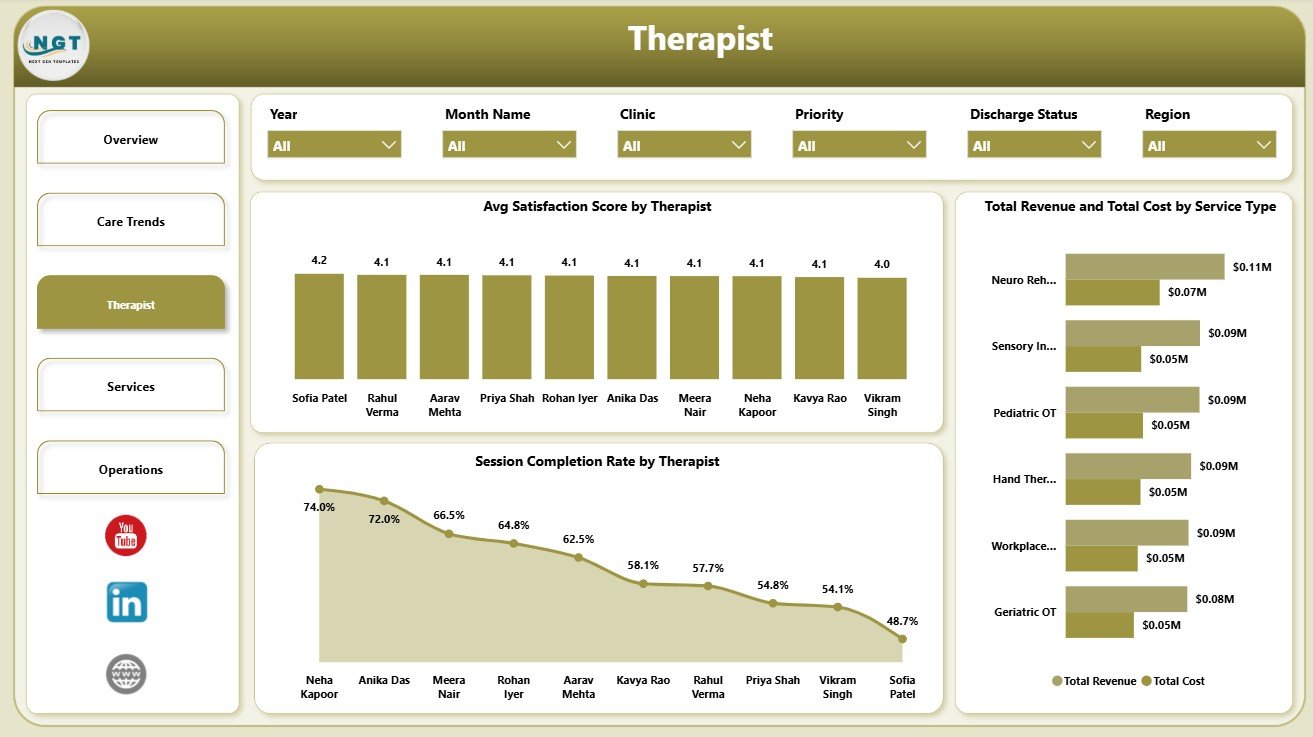
Avg Satisfaction Score by Therapist compares client experience across providers and highlights coaching opportunities. Session Completion Rate by Therapist helps managers see completion consistency by provider. Total Revenue and Total Cost by Service Type connects clinical service mix with financial performance.
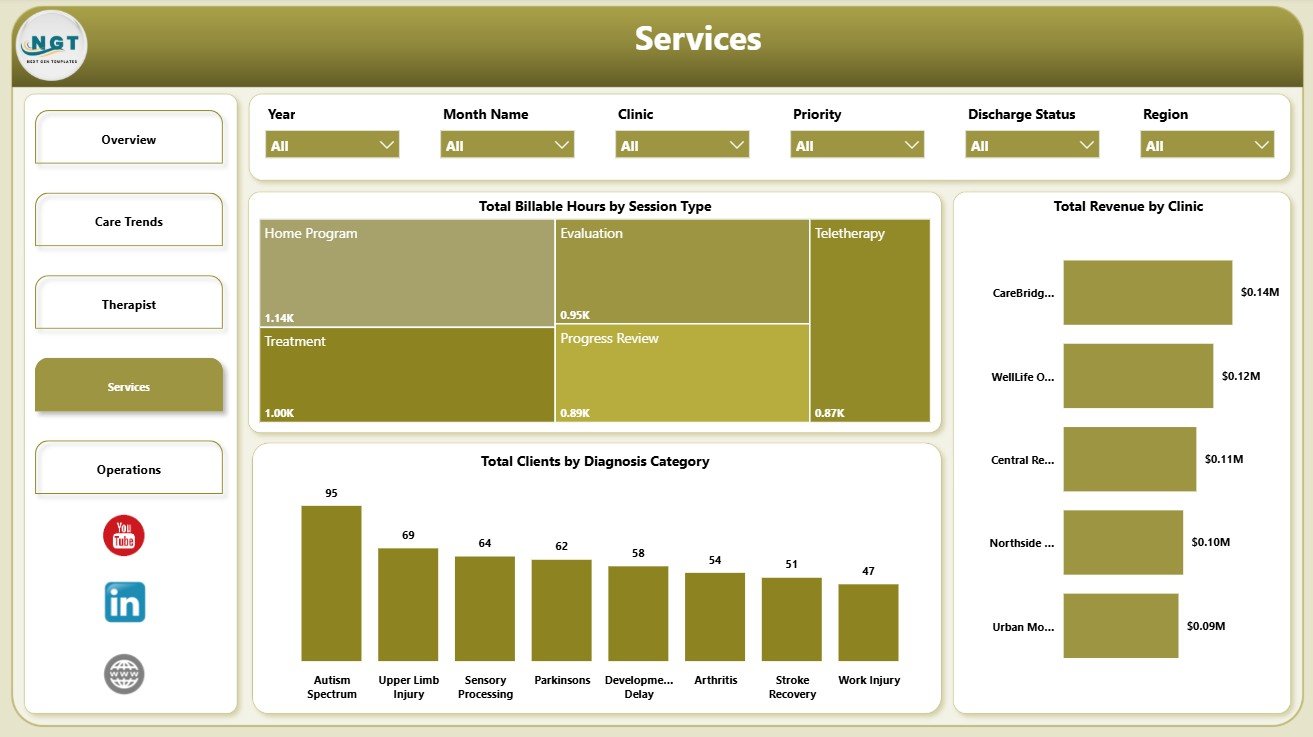
4 – Services
Total Billable Hours by Session Type explains how therapist time is distributed across visit types. Total Clients by Diagnosis Category shows the care mix and helps teams understand demand by condition group. Total Revenue by Clinic compares clinic-level revenue for multi-location review.
5 – Operations
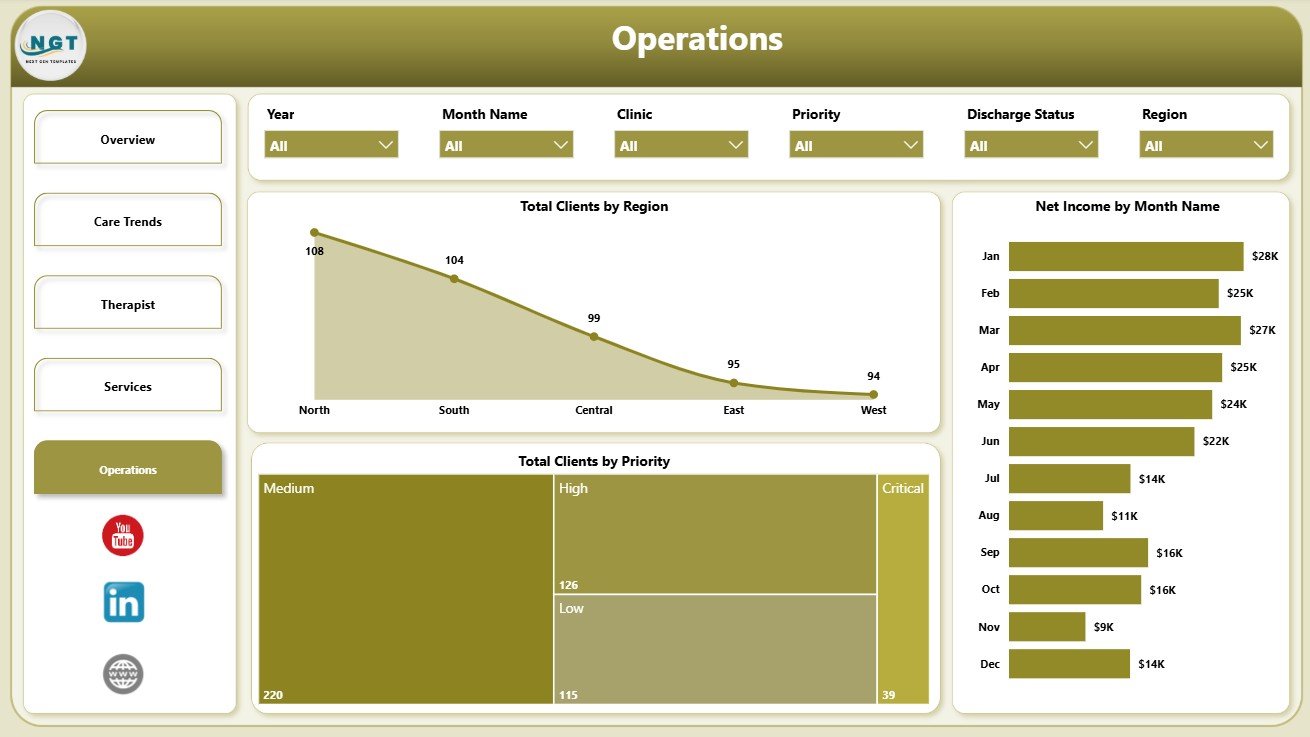
Total Clients by Region shows where client demand is concentrated. Total Clients by Priority helps managers monitor urgent workload. Net Income by Month Name tracks profitability trends and supports monthly performance reviews.
Occupational Therapy Dashboard in Power BI vs. Tableau vs. Paid CRM/SaaS – Where This Fits
| Feature | This Power BI dashboard | Tableau alternative | Paid healthcare SaaS |
|---|---|---|---|
| Cost | $17.99 one-time sale price | Requires Tableau build and licensing | Recurring monthly or annual fees |
| Platform | Power BI Desktop and Power BI Service | Tableau Desktop or Cloud | Vendor-hosted clinical or practice system |
| Setup time | Replace or connect data and refresh | Build model, charts, and dashboard manually | Implementation and onboarding |
| Customizable fields | Editable Power BI model and visuals | Editable if you build the workbook | Limited by vendor settings |
| Year-1 cost at 5 users | Template price plus Power BI licensing if shared | Usually higher licensing cost | Often hundreds or thousands per year |
| Clinical record management | Not included | Not included | May be included |
Who This Template Is For – and Who It’s Not For
This dashboard is for occupational therapy clinic owners, directors, operations managers, finance teams, billing coordinators, and healthcare analysts who already have structured data and want a visual reporting layer. It is not an EHR, billing system, scheduling system, clinical documentation tool, or HIPAA compliance product.
How to Use the Occupational Therapy Dashboard in Power BI
- Download and unzip the file.
- Open the .pbix file in Power BI Desktop.
- Replace the sample source with your own structured occupational therapy data.
- Refresh the model and confirm slicers are working.
- Review the Overview, Care Trends, Therapist, Services, and Operations pages.
- Publish to Power BI Service if your team needs controlled sharing.
Real-World Use Cases
Clinic owner: Reviews revenue, cost, net income, billable hours, completion rate, and client status before a weekly meeting.
Therapy manager: Compares therapist satisfaction and completion rates to identify provider coaching needs.
Operations lead: Uses region, priority, referral source, and monthly net income views to plan capacity and follow-up work.
Frequently Asked Questions
What does this Power BI dashboard track?
It tracks revenue, cost, billable hours, net income, session completion rate, client status, referral source, therapist performance, service type, clinic, diagnosis category, region, priority, and monthly trends.
Do I need Power BI Desktop?
Yes. Open the .pbix file in Power BI Desktop, which is free from Microsoft. Sharing through Power BI Service may require Microsoft licensing.
Can I connect my own data?
Yes. Replace the sample source with your own structured occupational therapy data and refresh the model.
Is this a clinical management system?
No. It is an analytics dashboard, not a system for clinical documentation, billing, scheduling, or compliance management.
Can I customize the visuals?
Yes. You can edit pages, measures, slicers, charts, and data model relationships in Power BI Desktop.
About the Author
Built by PK – Microsoft Certified Professional with 15+ years of Excel, Google Sheets, and Power BI experience. Founder of NextGenTemplates, reaching 300K+ subscribers across YouTube channels. Every template is hand-built and tested before release.
Explore Related Templates
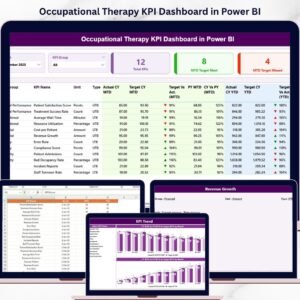
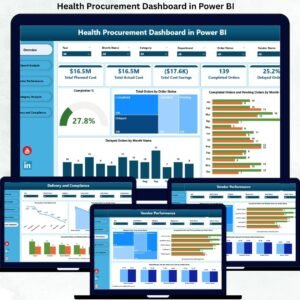
You may also like Occupational Therapy KPI Dashboard in Power BI, Occupational Therapy Dashboard in Excel, Nursing Homes Dashboard in Power BI, and Mental Health Services Report in Excel. Browse more Power BI Dashboard templates.
Download the Occupational Therapy Dashboard in Power BI and start reviewing therapy revenue, cost, clients, services, therapist performance, and operations in one visual Power BI file.
Watch the step-by-step video tutorial:


















Reviews
There are no reviews yet.