

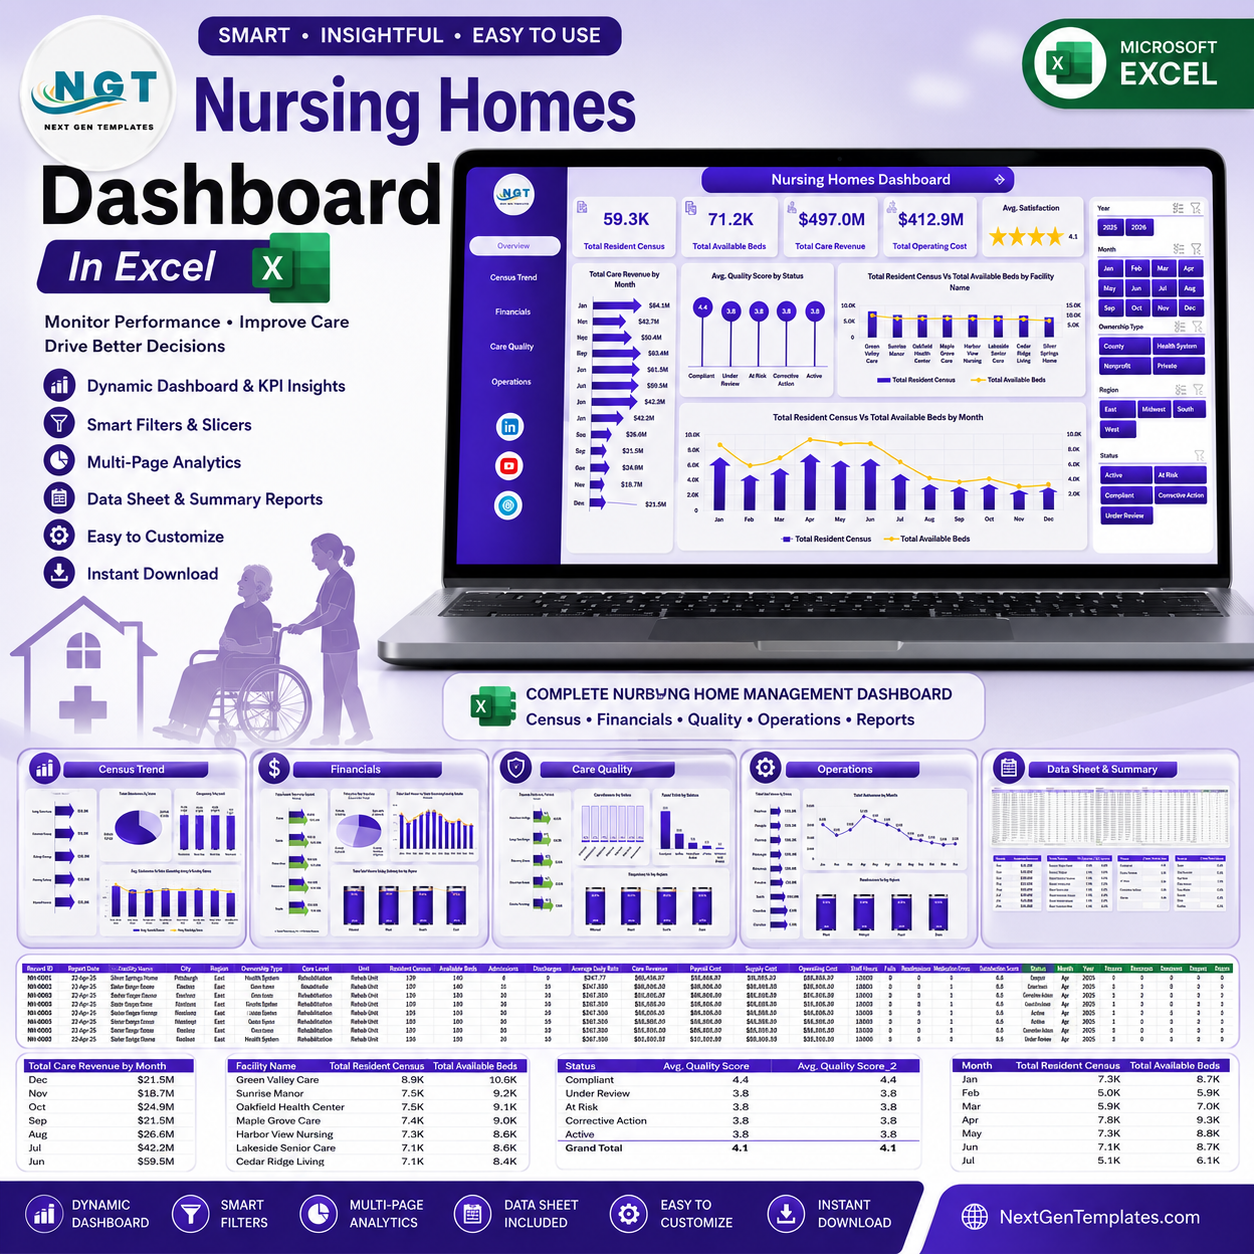



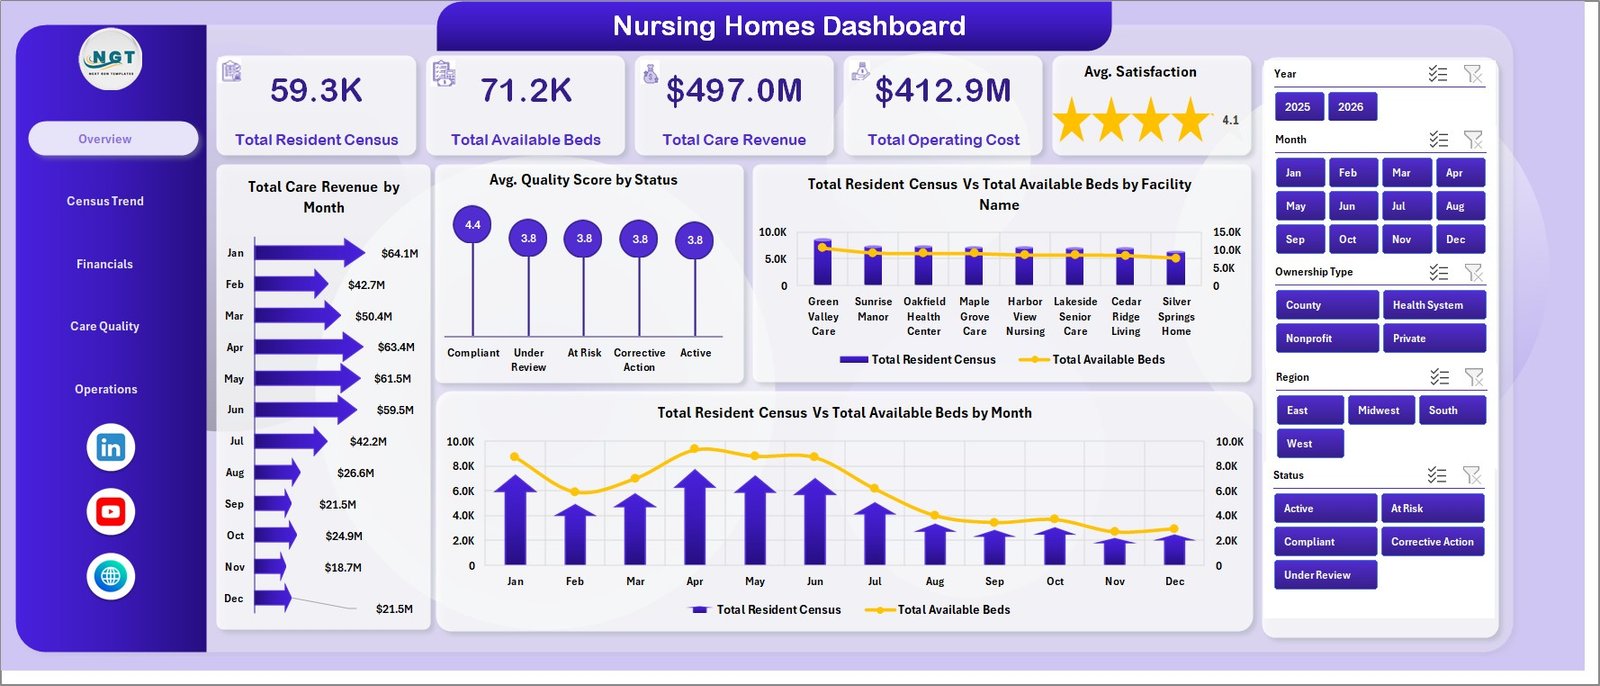
Nursing Homes Dashboard in Excel helps administrators monitor census, beds, revenue, cost, care quality, admissions, falls, readmissions, occupancy, staffing, and satisfaction in one ready-to-use workbook. Long-term care teams often manage 20+ operational and clinical measures across separate reports; this dashboard brings the most important views into seven structured Excel sheet tabs. It is a one-time purchase, works offline in Microsoft Excel, and can be refreshed after replacing the sample data.
Use it to review facility performance, compare resident capacity with available beds, watch revenue against operating cost, and spot quality or satisfaction changes before monthly meetings.
Nursing Homes Dashboard in Excel
Key Features of Nursing Homes Dashboard in Excel
- Five KPI cards: Total Resident Census, Total Available Beds, Total Care Revenue, Total Operating Cost, and Avg. Satisfaction.
- Five dashboard pages: Overview, Census Trend, Financials, Care Quality, and Operations.
- Interactive slicers: Filter the dashboard quickly by available fields and review only the nursing home data you need.
- Excel pivot-based reporting: Refresh all pivots and charts from the Data tab after updating the source table.
- Healthcare operations focus: Track census, care levels, admissions, occupancy, staff hours, costs, readmissions, falls, and satisfaction.
- Editable workbook: Modify chart titles, colors, formulas, data fields, and sheet structure as your reporting needs change.
What’s Inside the Nursing Homes Dashboard in Excel
Overview Page: This page gives leadership a high-level view of resident census, bed availability, care revenue, operating cost, and satisfaction. The Total Care Revenue by Month chart shows whether monthly care income is rising, falling, or staying stable. Avg. Quality Score by Status compares care quality across status groups so management can spot weaker areas. Total Resident Census vs Total Available Beds by Facility Name highlights capacity pressure by location. Total Resident Census vs Total Available Beds by Month shows occupancy movement over time.
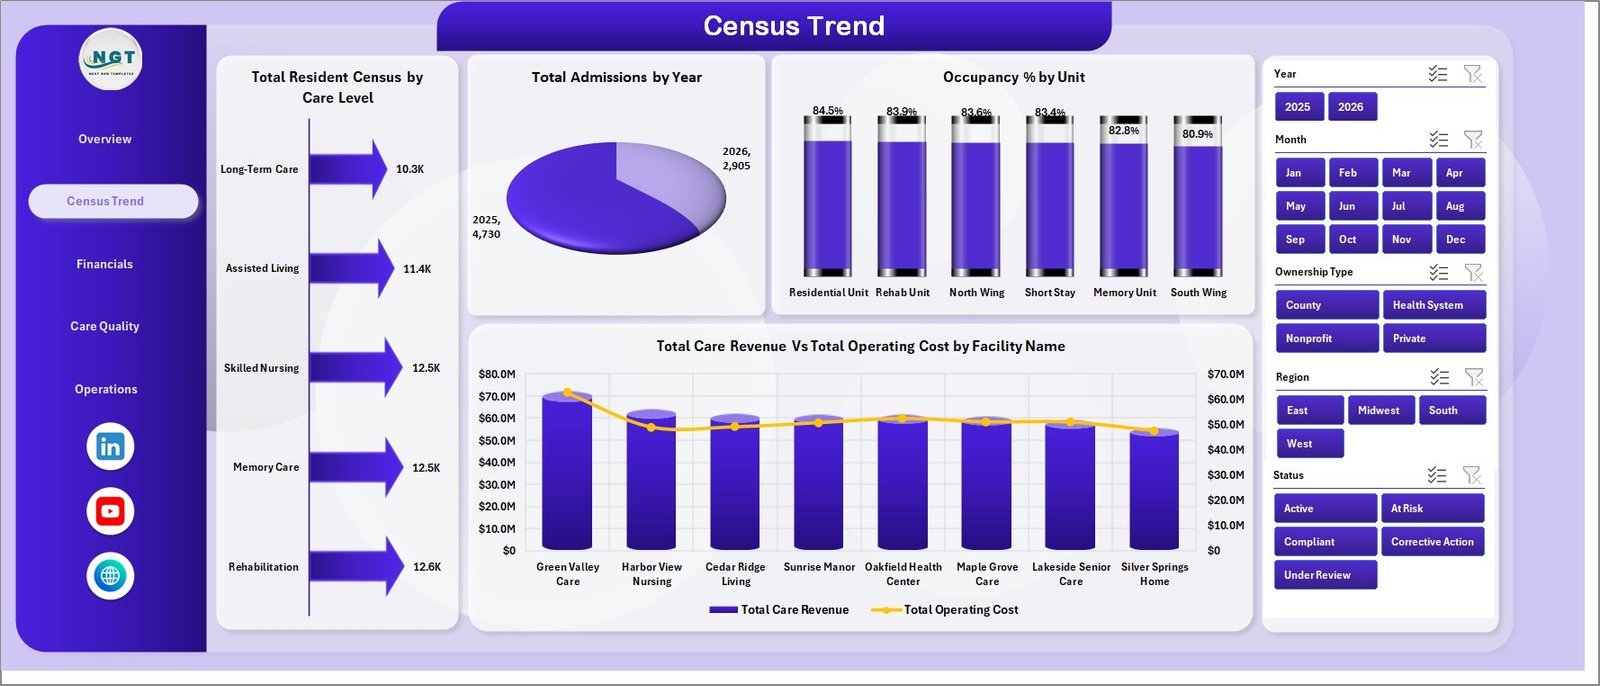
Census Trend: This sheet focuses on resident volume and occupancy patterns. Total Resident Census by Care Level shows how residents are distributed across care intensity. Total Admissions by Year helps identify long-term intake trends. Occupancy % by Unit compares space usage across units. Total Care Revenue vs Total Operating Cost by Facility Name shows which facilities are financially balanced and which need closer review.
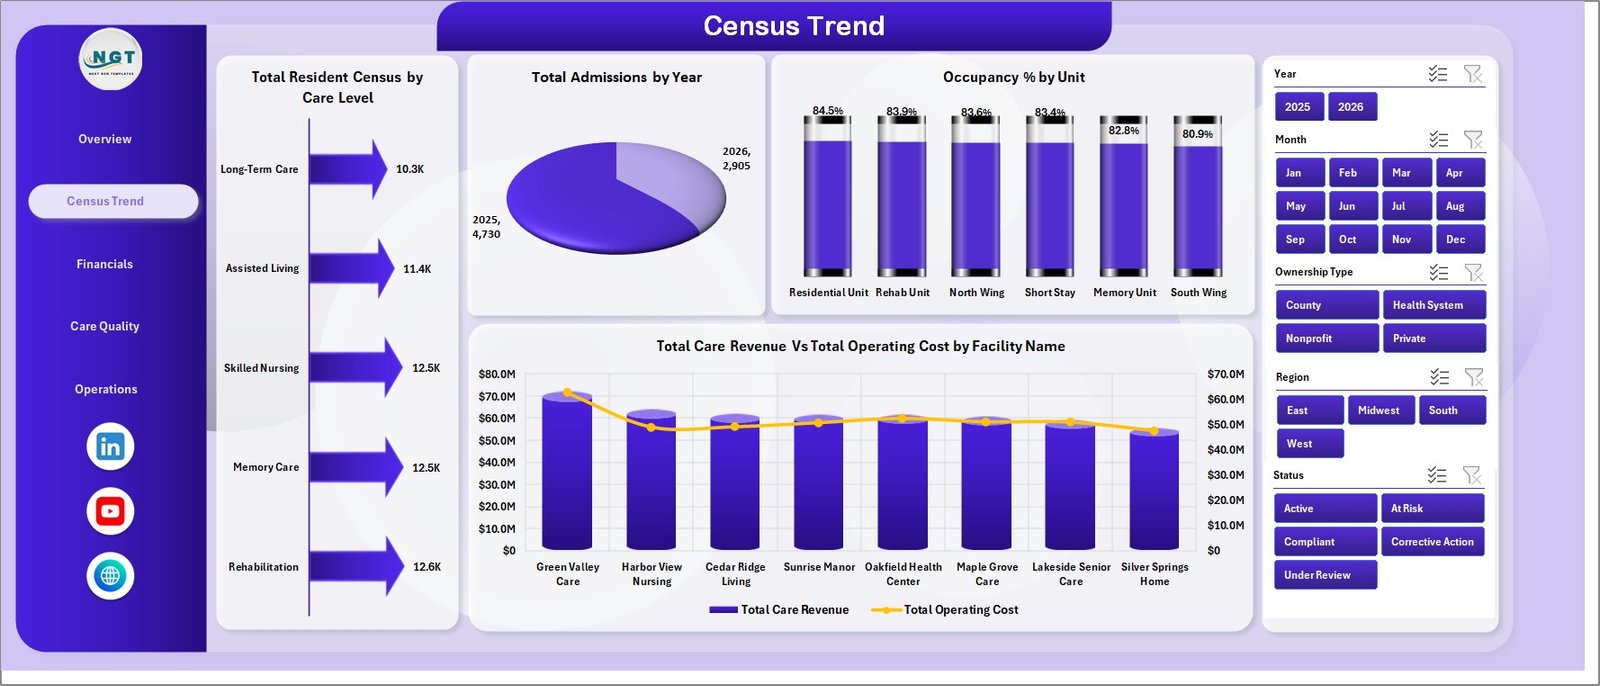
Census Trend
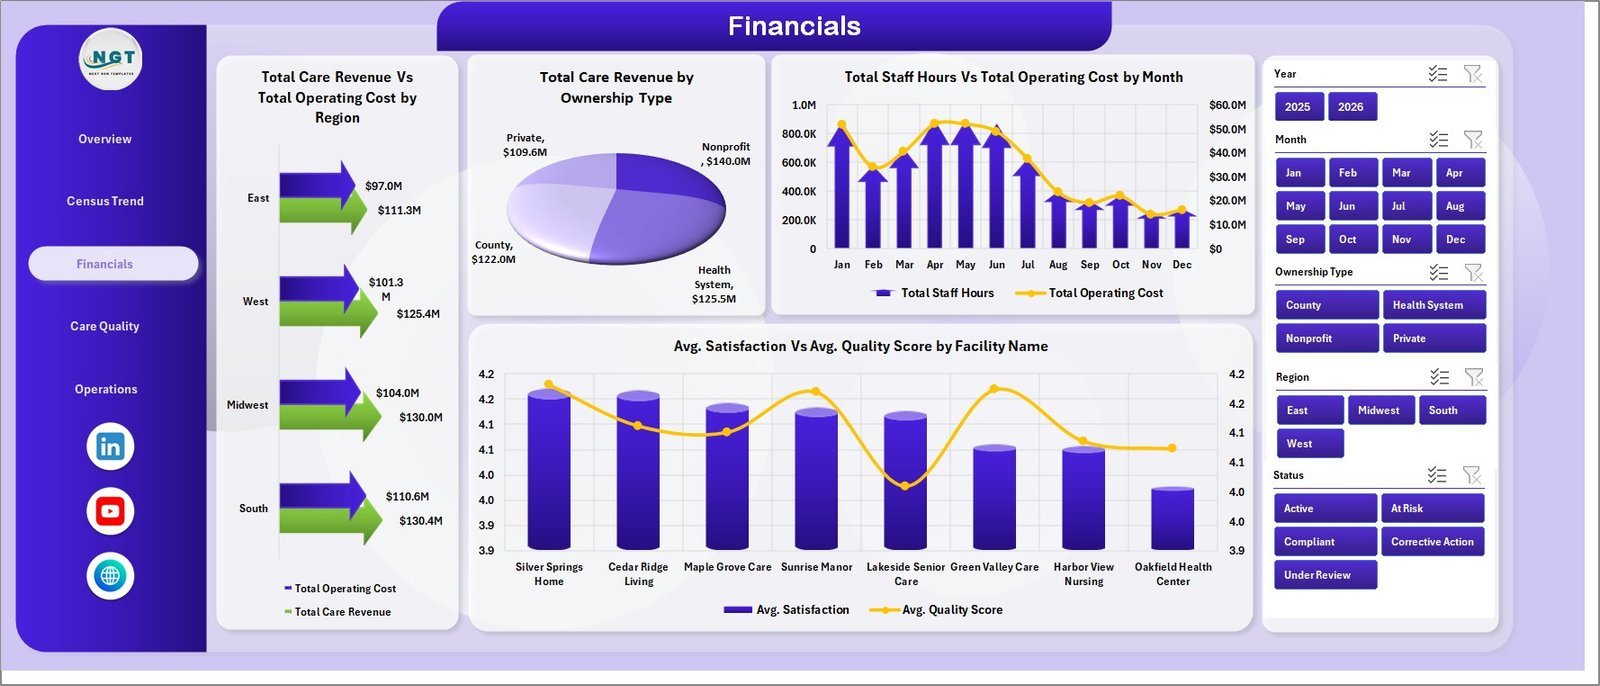
Financials: The Financials tab compares revenue, cost, ownership, staffing, satisfaction, and quality. Total Care Revenue vs Total Operating Cost by Region helps leadership compare profitability across regions. Total Care Revenue by Ownership Type shows how ownership models contribute to care revenue. Total Staff Hours vs Total Operating Cost by Month helps connect staffing effort with cost movement. Avg. Satisfaction vs Avg. Quality Score by Facility Name compares resident experience with care outcomes.
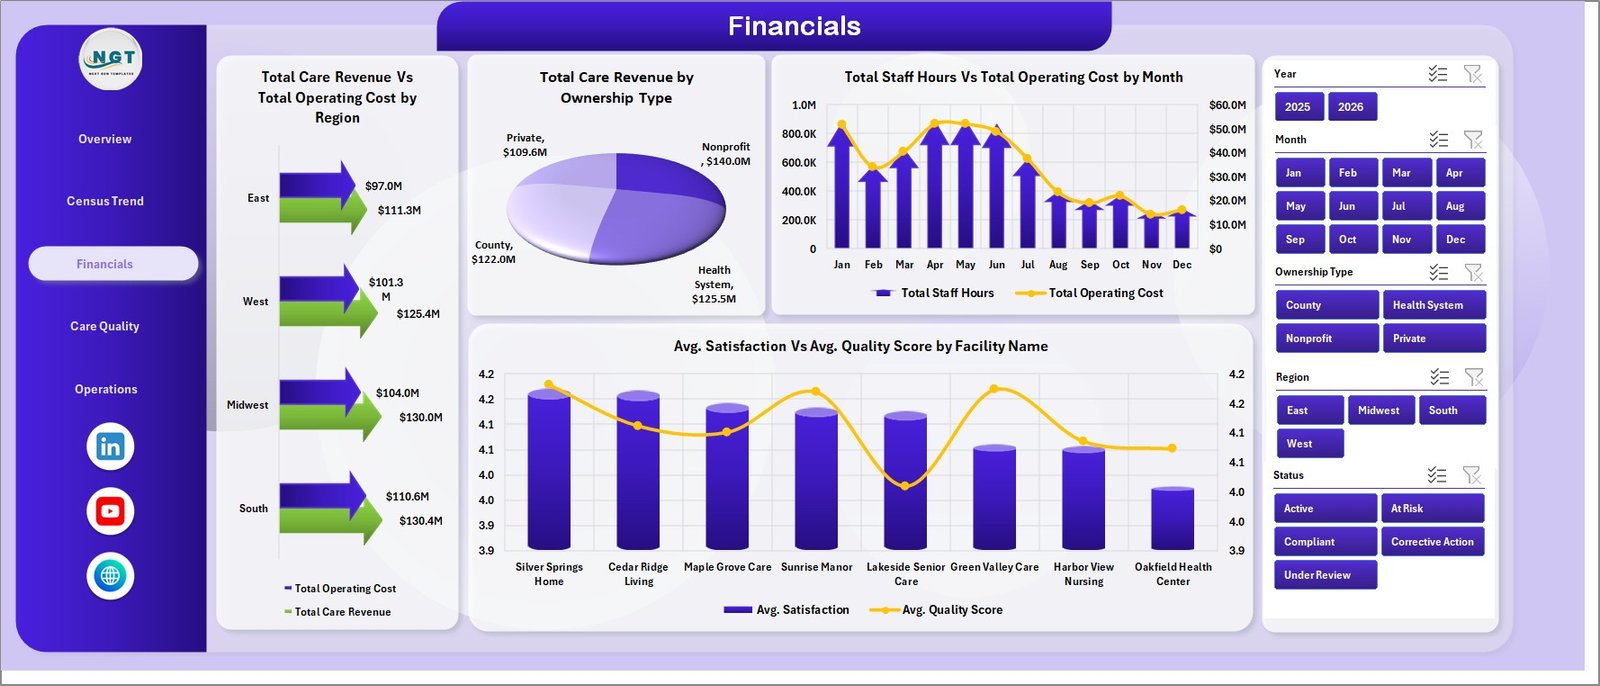
Financials
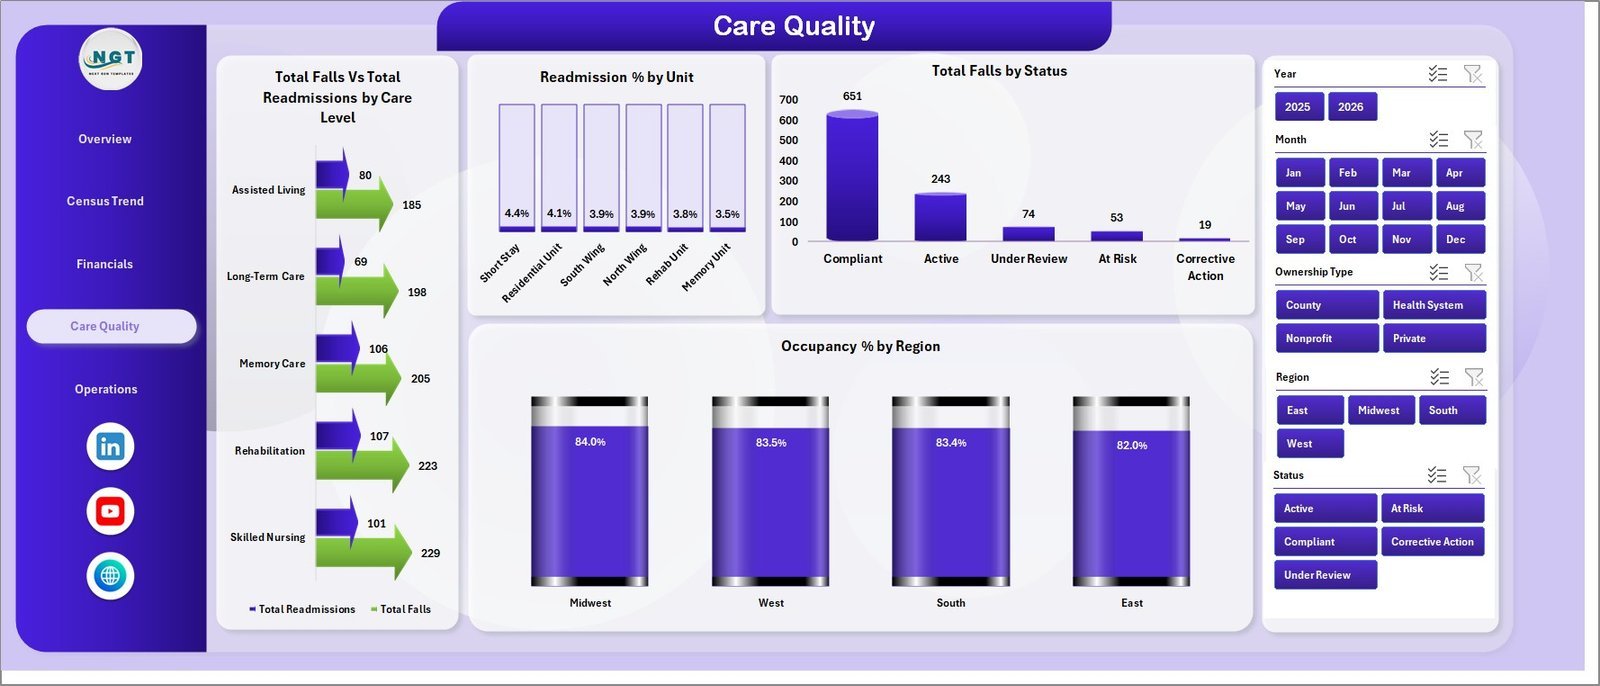
Care Quality: This sheet supports quality review meetings. Total Falls vs Total Readmissions by Care Level compares safety events with follow-up care outcomes. Readmission % by Unit shows which units may need deeper clinical review. Total Falls by Status makes it easier to monitor fall incidents by current case status. Occupancy % by Region connects operational load with regional capacity.
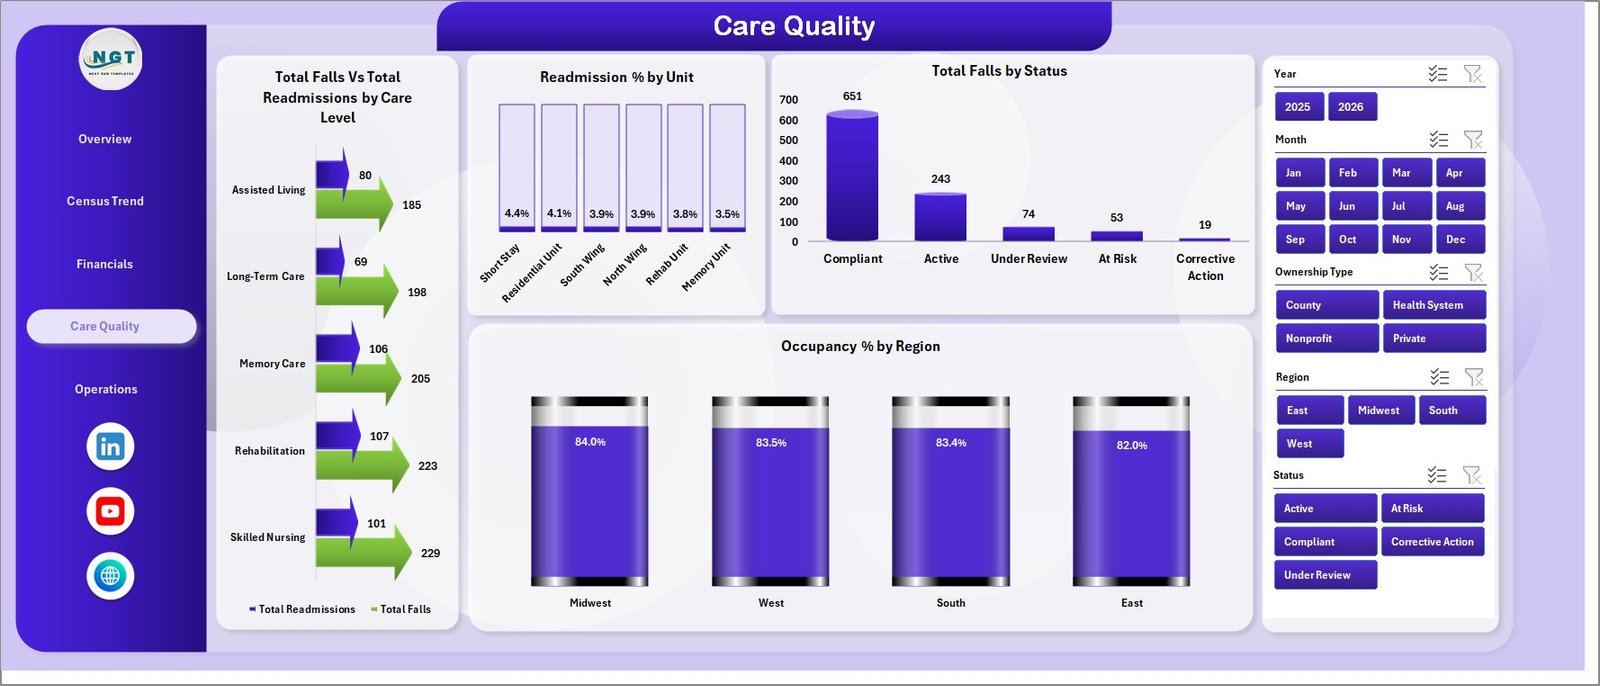
Care Quality
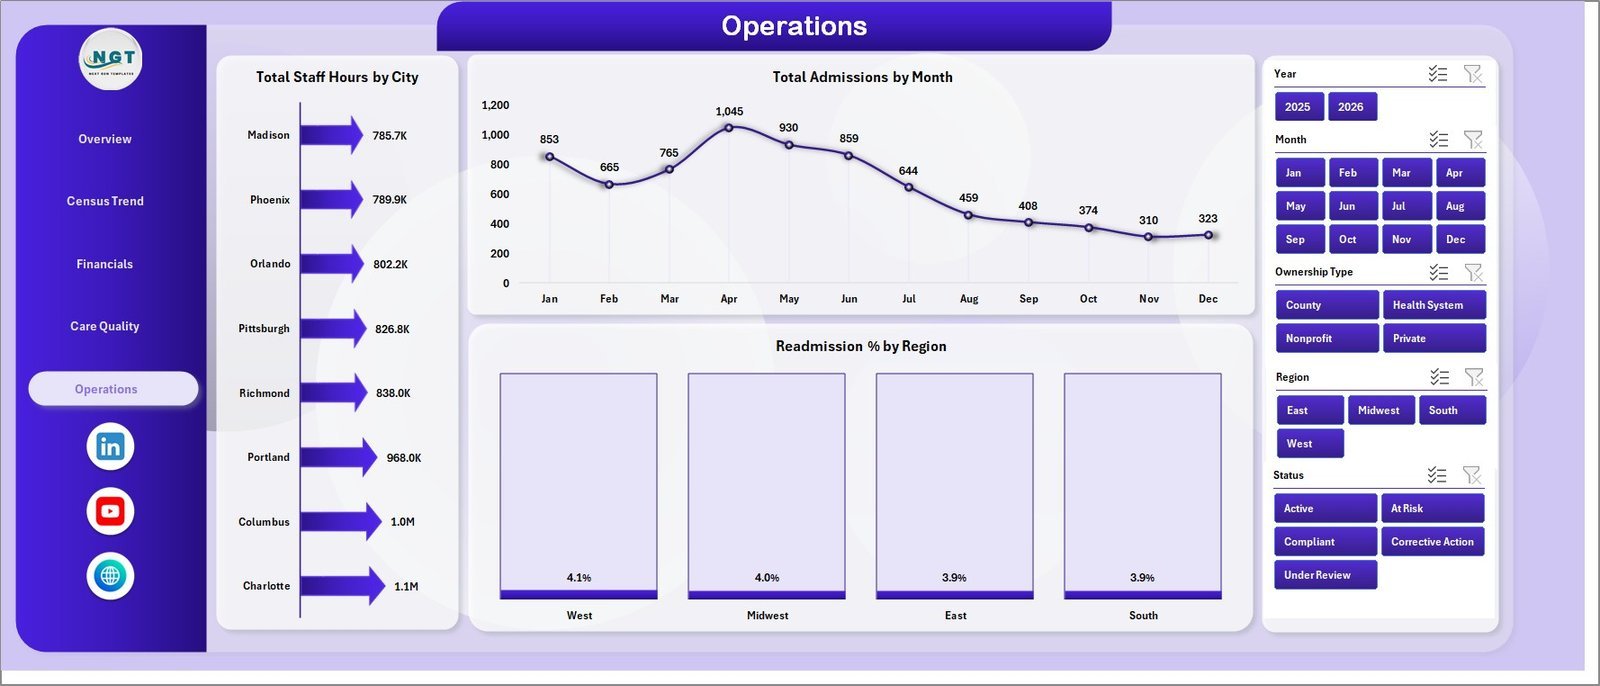
Operations: The Operations page focuses on staffing and admission activity. Total Staff Hours by City compares staffing workload across locations. Total Admissions by Month shows demand patterns throughout the year. Readmission % by Region helps teams identify regions where care transitions may need improvement.
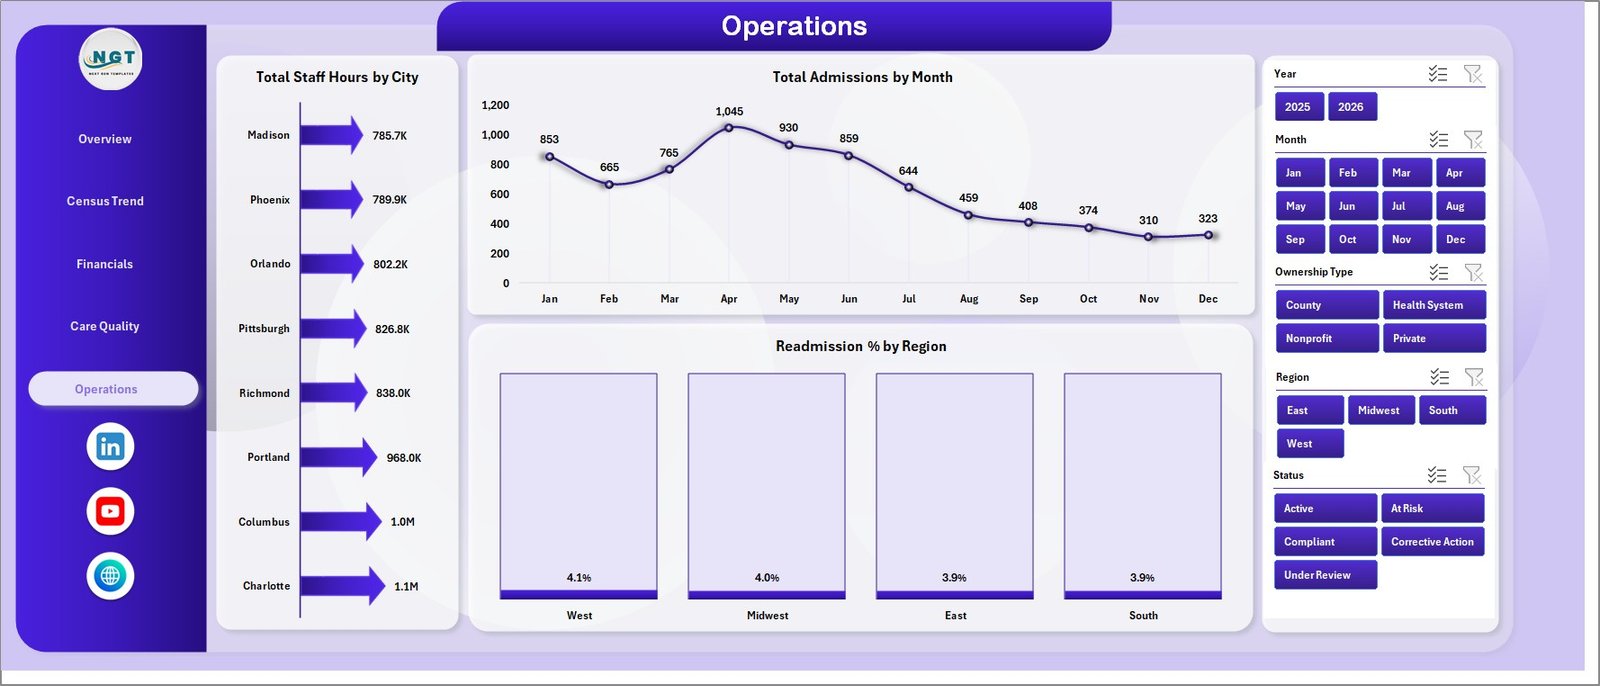
Operations
Data Sheet Tab: Add or replace your nursing home data in the same table format. The dashboard is designed so the visuals update from this source data after refresh.

Data Sheet tab
Support Sheet: The support sheet contains pivot tables used to power the dashboard dynamically. After updating the Data sheet, go to the Excel Ribbon, open the Data tab, and click Refresh All. You may keep this sheet hidden during normal use.

Support sheet tab
Nursing Homes Dashboard in Excel vs. Google Sheets vs. Paid CRM/SaaS – Where This Fits
| Feature | This Excel dashboard | Google Sheets alternative | Athenahealth or Kareo |
|---|---|---|---|
| Cost | $17.99 one-time | Free to build, time-intensive | Subscription pricing |
| Platform | Microsoft Excel | Browser-based spreadsheet | Cloud SaaS |
| Setup time | Replace sample data and refresh | Manual dashboard build | Vendor onboarding |
| Offline access | Yes | Limited | No |
| Pivot refresh | Built in | Requires setup | Vendor controlled |
| Year-1 cost at 5 users | $17.99 total | Build hours plus workspace cost | Often thousands per year |
Who This Template Is For – and Who It’s Not For
This template is for nursing home administrators, facility directors, care quality teams, healthcare analysts, and operations managers who need a practical Excel-based view of census, beds, revenue, cost, quality, and staffing. It is not a replacement for an EHR, billing platform, HIPAA-compliant patient database, or real-time clinical alerting system.
How to Use the Nursing Homes Dashboard in Excel
- Download and open the workbook in Microsoft Excel.
- Go to the Data Sheet tab and replace the sample rows with your own data in the same column format.
- Open the Data tab in the Excel Ribbon and click Refresh All.
- Use slicers to filter by facility, region, unit, care level, month, status, and other available fields.
- Review the Overview, Census Trend, Financials, Care Quality, and Operations pages for decision-making.
Real-World Use Cases
Facility Administrator: Reviews census versus available beds by facility before weekly capacity planning.
Quality Manager: Monitors falls, readmissions, satisfaction, and quality scores before governance meetings.
Finance Lead: Compares care revenue with operating cost by facility, region, ownership type, and month.
Frequently Asked Questions
Can I use this with my own nursing home data?
Yes. Replace the sample records in the Data Sheet tab with your data and refresh the pivots.
Does this require macros?
No macro requirement is stated for this dashboard. It is built around Excel sheets, pivots, charts, and slicers.
Can I customize the charts?
Yes. You can edit chart titles, colors, formulas, fields, slicers, and worksheet layout in Excel.
Does it support multiple facilities?
Yes. The dashboard includes facility, region, city, unit, month, ownership, and care-level analysis areas.
Is this a medical record system?
No. It is a reporting template for management analysis, not an EHR or patient-record application.
About the Author
Built by PK – Microsoft Certified Professional with 15+ years of Excel, Google Sheets, and Power BI experience. Founder of NextGenTemplates, reaching 300K+ subscribers across YouTube channels. Every template is hand-built and tested before release.
Explore Related Templates
Explore the Excel Dashboard templates, Nursing Homes KPI Dashboard in Excel, Medical Tourism Dashboard in Excel, and Home Health Care KPI Scorecard in Excel.
Download the Nursing Homes Dashboard in Excel today and start tracking census, quality, financial, and operational metrics in one workbook.
Last updated: July 13, 2026.





























Reviews
There are no reviews yet.