

Insurance Tech Startups Dashboard in Power BI gives insurtech founders, analysts, investors, and product teams a ready-to-use reporting view for premium revenue, policies sold, claim payout, operating cost, customer satisfaction, startup status, funding stage, and market fit. This Power BI template includes 5 report pages, 5 top-level KPI cards, multiple slicers, and visual analysis across funding, growth, claims, and market-fit performance. Instant download, one-time price, and no monthly BI subscription beyond your normal Power BI use.
Key Features of Insurance Tech Startups Dashboard in Power BI
- 5 Power BI pages: Overview Page, Funding, Growth, Claims, and Market Fit.
- Executive KPI cards: Total Startups, Total Premium Revenue, Total Policies Sold, Total Operating Cost, and Total Claim Payout.
- Interactive slicers: Filter the report quickly by startup, month, region, status, funding stage, business model, product type, customer type, and segment.
- Funding analysis: Review operating cost by business model, policy sales by month, and startup count by region.
- Growth and claims analytics: Compare policies sold, premium revenue, claim payout, satisfaction, and business model mix.
- Market-fit view: Analyze operating cost by funding stage, customer satisfaction by customer type, and revenue contribution by startup.
What’s Inside the Insurance Tech Startups Dashboard in Power BI
1. Overview Page
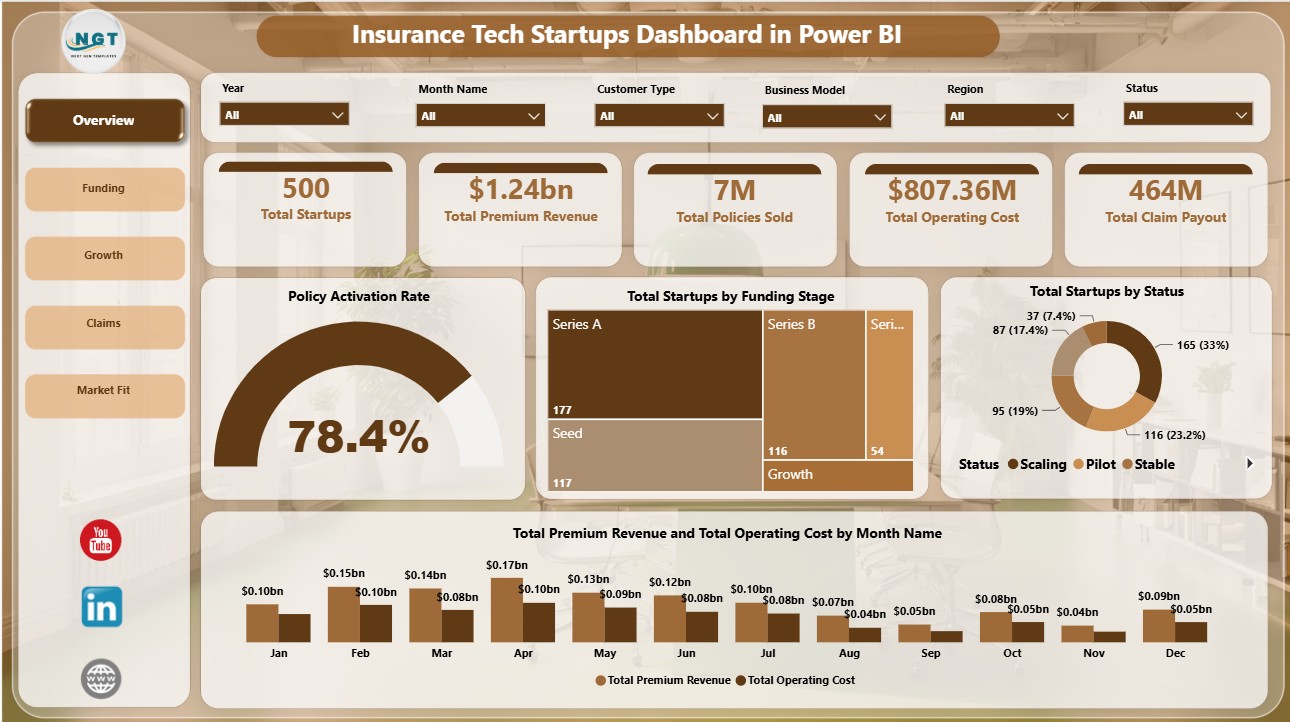
The Overview Page gives leadership a high-level view of startup activity and insurance performance. KPI cards summarize Total Startups, Total Premium Revenue, Total Policies Sold, Total Operating Cost, and Total Claim Payout.
Policy Activation Rate: This visual helps users understand how efficiently policy activity is converting into active insurance relationships. It is useful for tracking onboarding quality and early customer traction.
Total Startups by Funding Stage: This chart shows how startup records are distributed across funding stages. It helps investors and operators see whether the portfolio is weighted toward seed, growth, or later-stage companies.
Total Startups by Status: This visual separates startups by current operating status. It helps teams quickly compare active, scaling, paused, or closed startup groups.
Total Premium Revenue and Total Operating Cost by Month Name: This monthly trend compares revenue against cost. It helps leaders see whether premium growth is keeping pace with operating expenses.
2. Funding
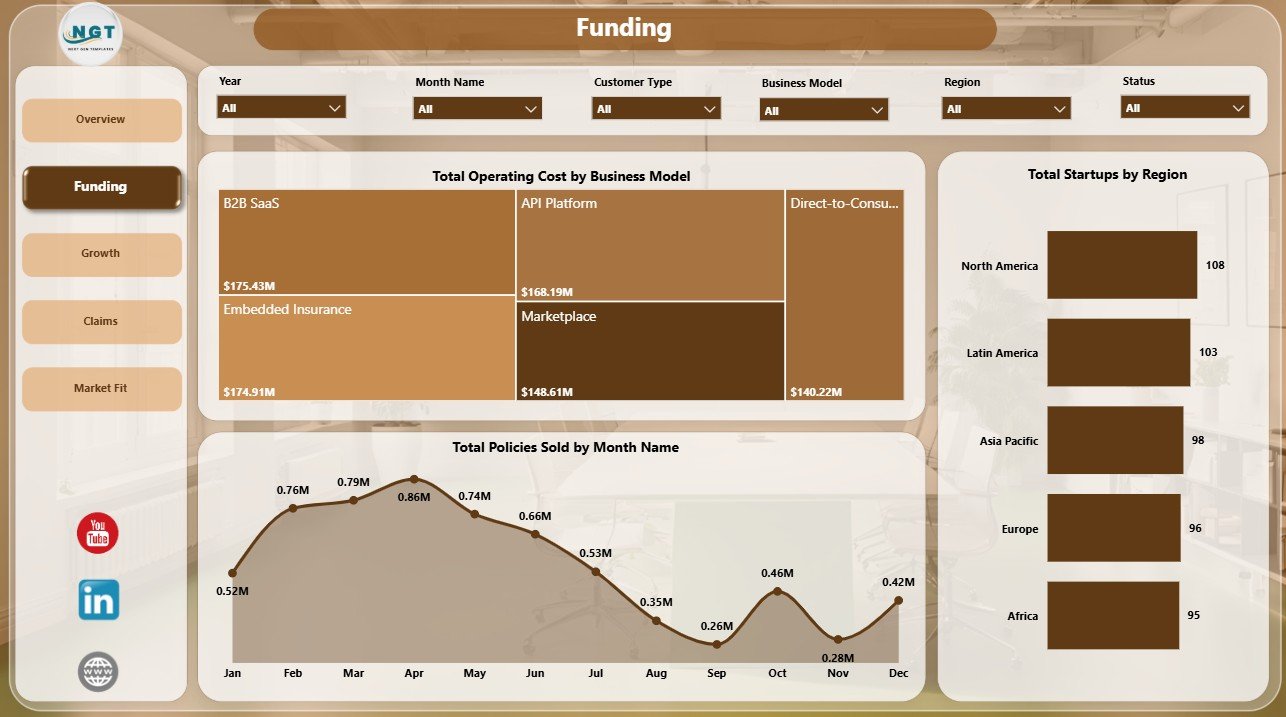
The Funding page focuses on how cost, policies sold, and startup distribution move across business model, time, and region.
Total Operating Cost by Business Model: This chart compares operating cost across business models. It helps teams identify which models require heavier spending and where efficiency improvement may be needed.
Total Policies Sold by Month Name: This trend shows monthly policy sales movement. It helps users detect growth patterns, seasonality, and months that need deeper commercial review.
Total Startups by Region: This visual compares startup count by region. It helps founders, investors, and market teams understand geographic concentration.
3. Growth
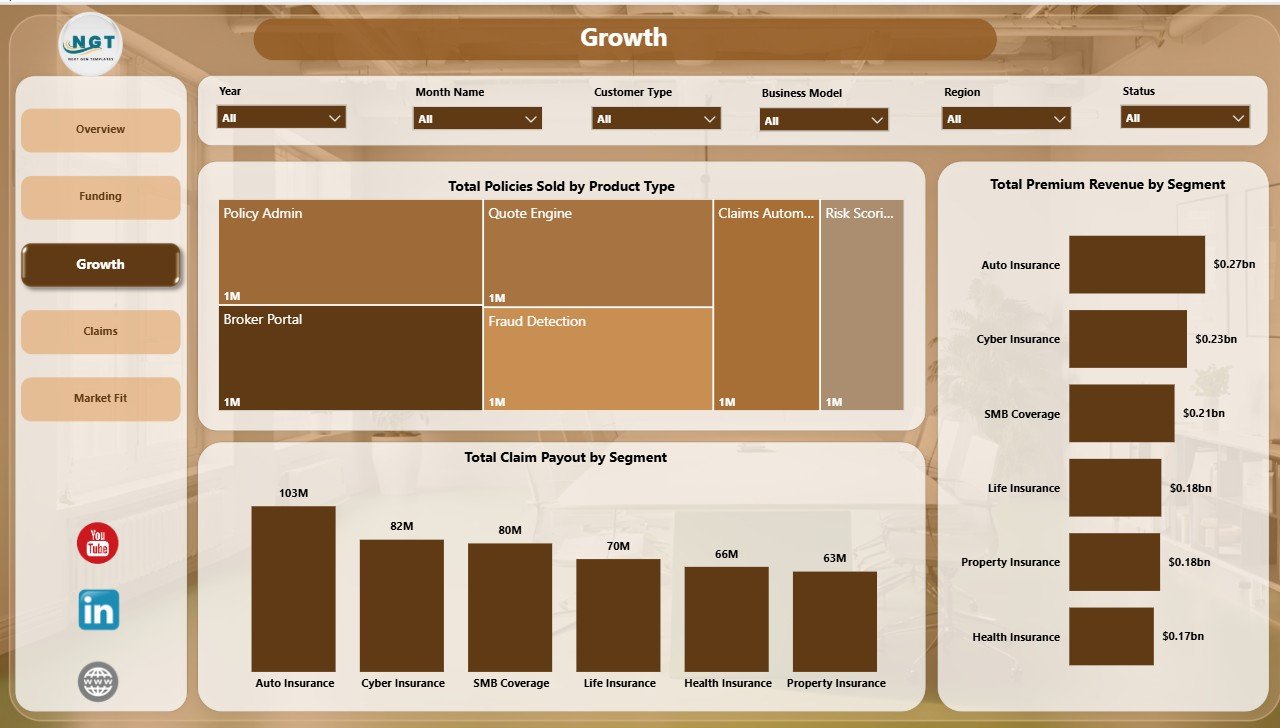
The Growth page helps teams understand policy sales, premium revenue, and claim payout by product and customer segments.
Total Policies Sold by Product Type: This chart ranks policy sales across insurance product types. It helps product and sales teams see which offerings are generating the most traction.
Total Premium Revenue by Segment: This visual compares premium revenue across segments. It highlights which segments contribute most to revenue growth.
Total Claim Payout by Segment: This chart compares claim payout by segment. It helps teams connect growth performance with claims exposure.
4. Claims
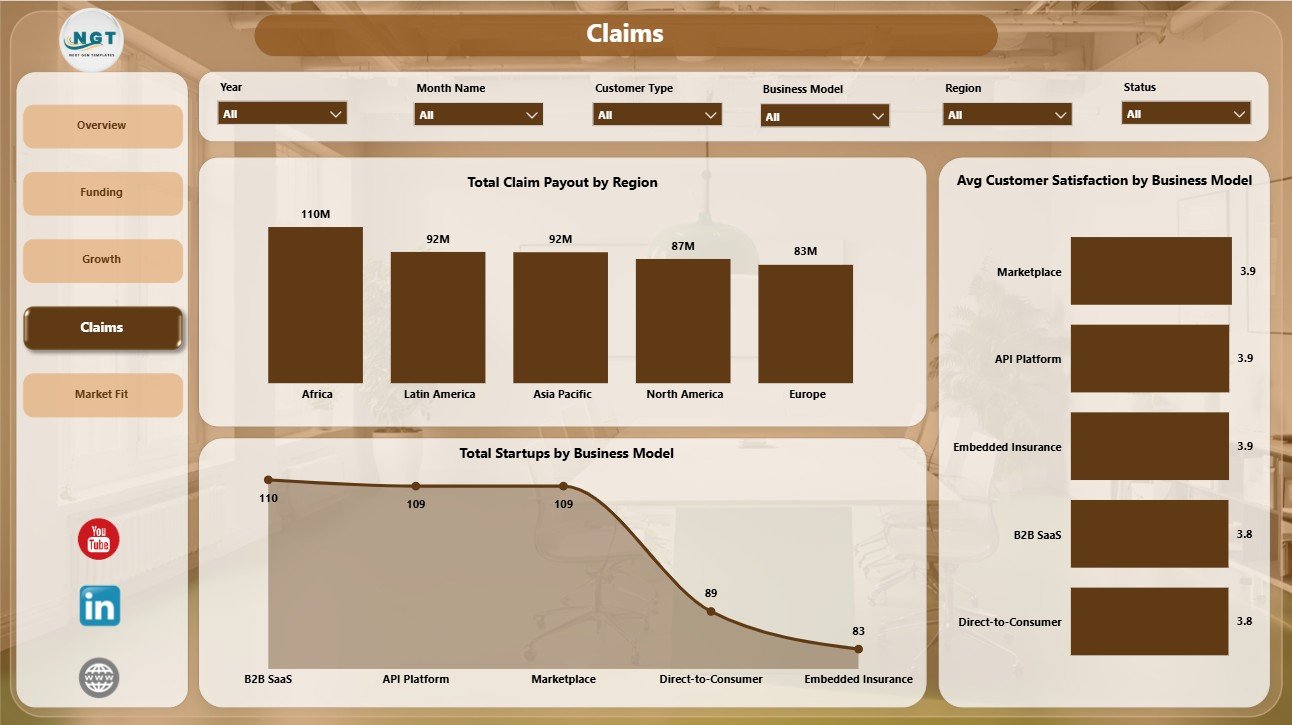
The Claims page supports operational review by combining claim payout, satisfaction, and business model distribution.
Total Claim Payout by Region: This chart compares claim payout across regions. It helps identify claim-heavy geographies and supports regional risk review.
Avg Customer Satisfaction by Business Model: This visual compares satisfaction across business models. It helps product teams see where customer experience is stronger or weaker.
Total Startups by Business Model: This chart shows startup count by business model. It helps users understand the business model mix behind the dataset.
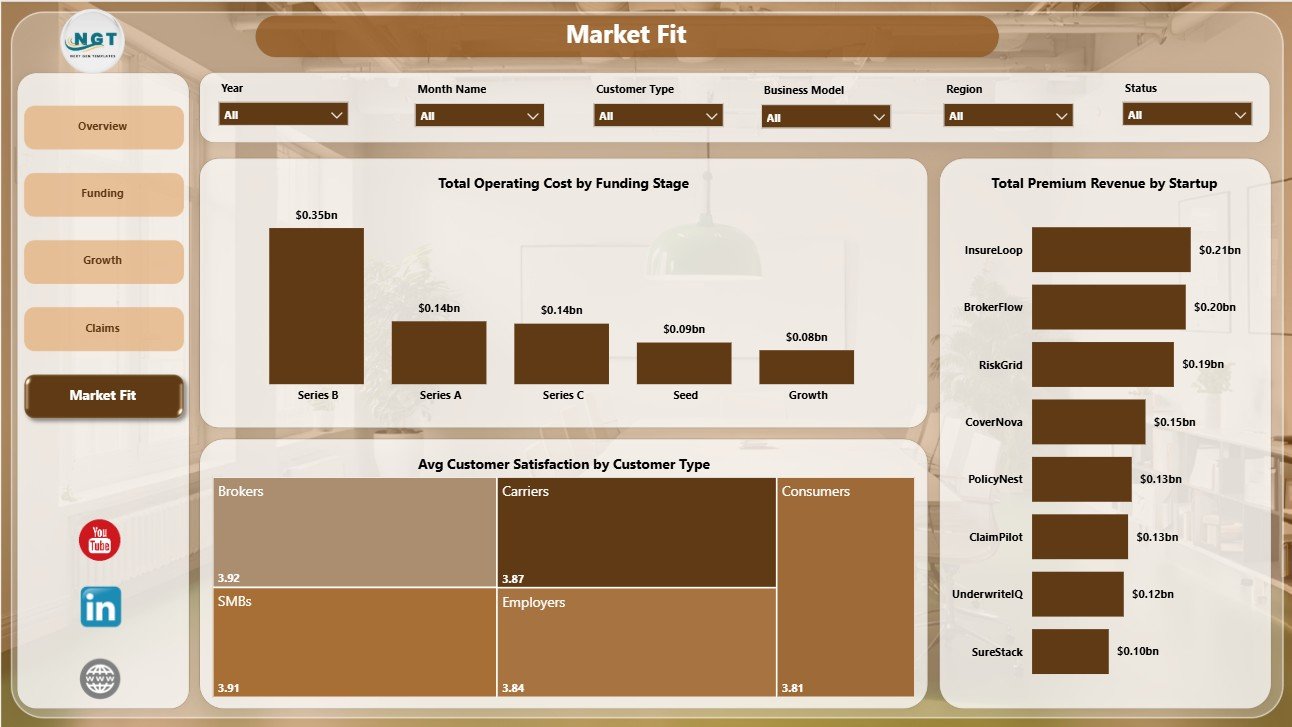
5. Market Fit
The Market Fit page brings cost, satisfaction, and startup-level revenue together for product-market fit and investor reporting.
Total Operating Cost by Funding Stage: This chart compares operating cost across funding stages. It helps teams understand how spend changes as startups mature.
Avg Customer Satisfaction by Customer Type: This visual compares satisfaction by customer type. It helps identify the customer groups with stronger fit and adoption experience.
Total Premium Revenue by Startup: This chart ranks premium revenue by startup. It helps users identify the strongest revenue contributors in the portfolio.
Insurance Tech Startups Dashboard in Power BI vs. Tableau vs. Paid CRM/SaaS – Where This Fits
| Feature | This Power BI dashboard | Tableau alternative | Paid insurance SaaS |
|---|---|---|---|
| Cost | $17.99 one-time template price | License plus build time | Monthly or annual subscription |
| Platform | Power BI Desktop / Power BI Service | Tableau | Vendor cloud platform |
| Setup time | Open PBIX and replace sample data | Build or adapt workbook | Implementation and onboarding |
| Real-time team collaboration | Available through Power BI Service | Available through Tableau Cloud | Usually included |
| Mobile access | Power BI mobile app | Tableau mobile app | Vendor app or browser |
| Customizable fields | Editable report model and visuals | Editable with Tableau skills | Depends on plan and permissions |
| Share with link | Possible through Power BI publishing | Possible through Tableau sharing | Usually login-controlled |
| Year-1 cost at 5 users | $17.99 plus Microsoft licensing | License and development cost | Often hundreds or thousands |
| Insurtech startup analysis | Funding, policies, premium, claims, cost, and market fit pages included | Requires build or customization | Depends on vendor module |
Who This Template Is For – and Who It’s Not For
This template is for insurtech startup founders, insurance analysts, product managers, venture teams, accelerators, consultants, and finance teams that want an editable Power BI dashboard for startup and insurance performance reporting.
It is not a policy administration system, claims processing workflow, actuarial pricing engine, regulatory filing system, or customer portal. It works best when you already have the data and need a clean reporting layer in Power BI.
How to Use the Insurance Tech Startups Dashboard in Power BI
- Download and unzip the Power BI package.
- Open the .pbix file in Power BI Desktop.
- Review the sample model and fields.
- Replace the sample data with your own startup, policy, claims, and financial records.
- Refresh the report and validate the visuals.
- Use slicers to filter by region, startup, funding stage, status, product type, customer type, and segment.
- Publish to Power BI Service when you are ready to share with your team.
Real-World Use Cases
Neha, insurtech founder: reviews premium revenue, operating cost, policies sold, and claim payout before monthly investor updates.
Arjun, venture analyst: compares startup distribution by funding stage, region, and business model to prepare portfolio review notes.
Maria, insurance innovation consultant: uses Growth, Claims, and Market Fit pages to identify stronger segments, products, and customer types.
Frequently Asked Questions
Do I need Power BI Desktop?
Yes. Open the .pbix file in Power BI Desktop, which is available from Microsoft.
Can I replace the sample data?
Yes. Replace the sample records with your own data using the same field structure, then refresh the report.
What pages are included?
The report includes Overview Page, Funding, Growth, Claims, and Market Fit pages.
Can I customize the visuals?
Yes. You can edit charts, measures, colors, slicers, and layout directly in Power BI.
Is this a complete insurance system?
No. This is a dashboard template for analysis and reporting, not an operational insurance platform.
Can I publish it to Power BI Service?
Yes, provided you have the required Microsoft account and Power BI permissions.
About the Author
Built by PK – Microsoft Certified Professional with 15+ years of Excel, Google Sheets, and Power BI experience. Founder of NextGenTemplates, reaching 300K+ subscribers across YouTube channels. Every template is hand-built and tested before release.
Explore Related Templates
You may also like Insurance Tech Startups Dashboard in Excel. Browse more Power BI templates and Power BI Dashboard templates.
Download the Insurance Tech Startups Dashboard in Power BI today and turn funding, policies, premium revenue, claims, operating cost, and customer satisfaction data into clear Power BI insights.
Last updated: June 25, 2026.


Reviews
There are no reviews yet.