
Digital Twin Services Dashboard in Power BI helps digital twin service teams track revenue, projects, license fees, delivery cost, net profit, completion rate, region performance, service mix, operations workload, and quality indicators across 5 interactive Power BI report pages. Digital twin programs often span industries, deployment models, twin types, engineers, engagement managers, and regions, so a clear reporting layer reduces manual review time and makes management meetings easier. Trusted by 8,400+ teams across 40+ countries, this one-time Power BI template gives you an editable .pbix file with no template subscription and no per-user template fee.
Key Features of Digital Twin Services Dashboard in Power BI
- 5 report pages: Overview, Service Insights, Regional Analysis, Operations, and Quality & CSAT.
- Executive KPI cards: Track Total Revenue, Total Projects, Total License Fee, Total Cost, and Net Profit.
- Financial analysis: Review profit margin, monthly revenue, net profit by industry, cost, and license fee trends.
- Service insights: Analyze revenue by deployment model, service category, and twin type.
- Regional reporting: Compare projects, profit margin, revenue, and cost across regions.
- Operations tracking: Monitor completion rate by complexity, projects by engineer, and revenue by engagement manager.
- Editable .pbix file: Customize visuals, fields, measures, labels, colors, and data connections in Power BI Desktop.
What’s Inside the Digital Twin Services Dashboard in Power BI
1. Overview Page
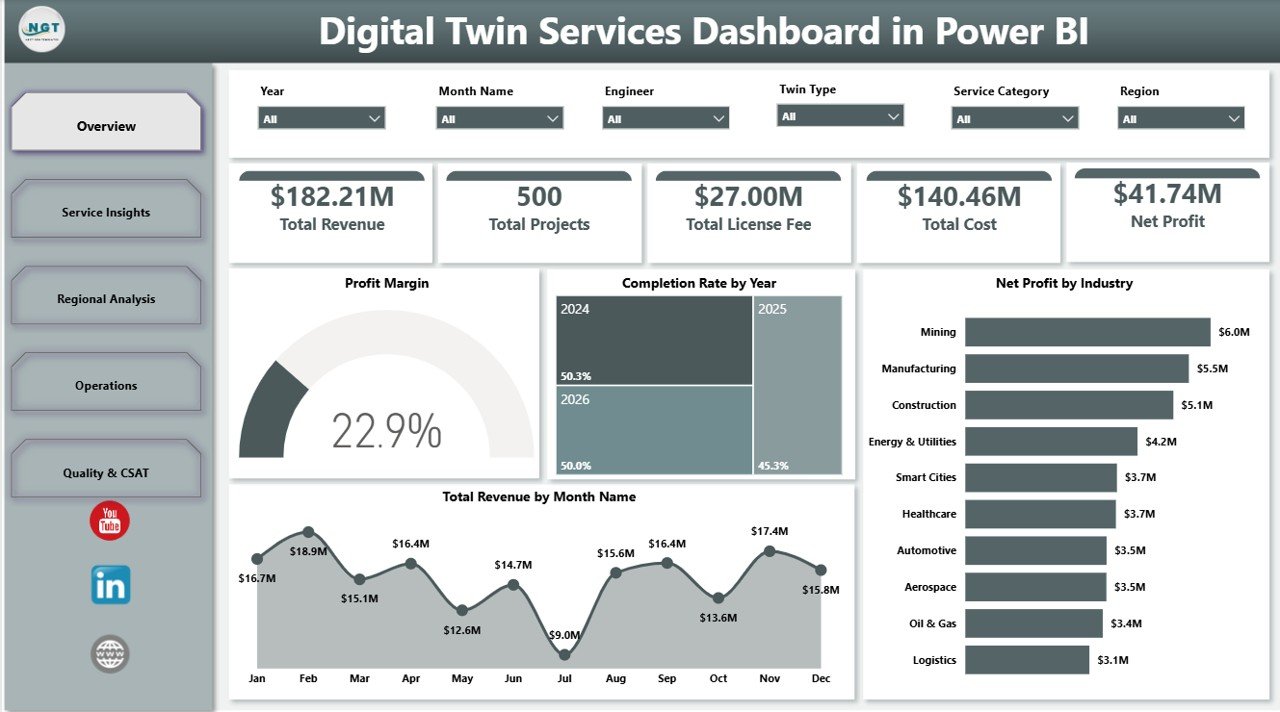
The Overview Page gives leadership a fast view of Total Revenue, Total Projects, Total License Fee, Total Cost, and Net Profit. Multiple slicers help users filter the dashboard quickly and review a specific year, region, industry, service category, deployment model, or twin type.
Profit Margin shows how much profit remains after delivery and licensing costs are considered. It helps managers see whether digital twin services are being priced and delivered profitably.
Completion Rate by Year compares delivery completion performance across years. This makes it easier to spot whether project execution is improving or slipping over time.
Net Profit by Industry highlights which industries generate the strongest profit contribution. Leaders can use it to prioritize commercial focus and service packaging.
Total Revenue by Month Name shows monthly revenue movement. It helps teams identify seasonality, high-demand periods, and months where sales or delivery activity may need attention.
2. Service Insights
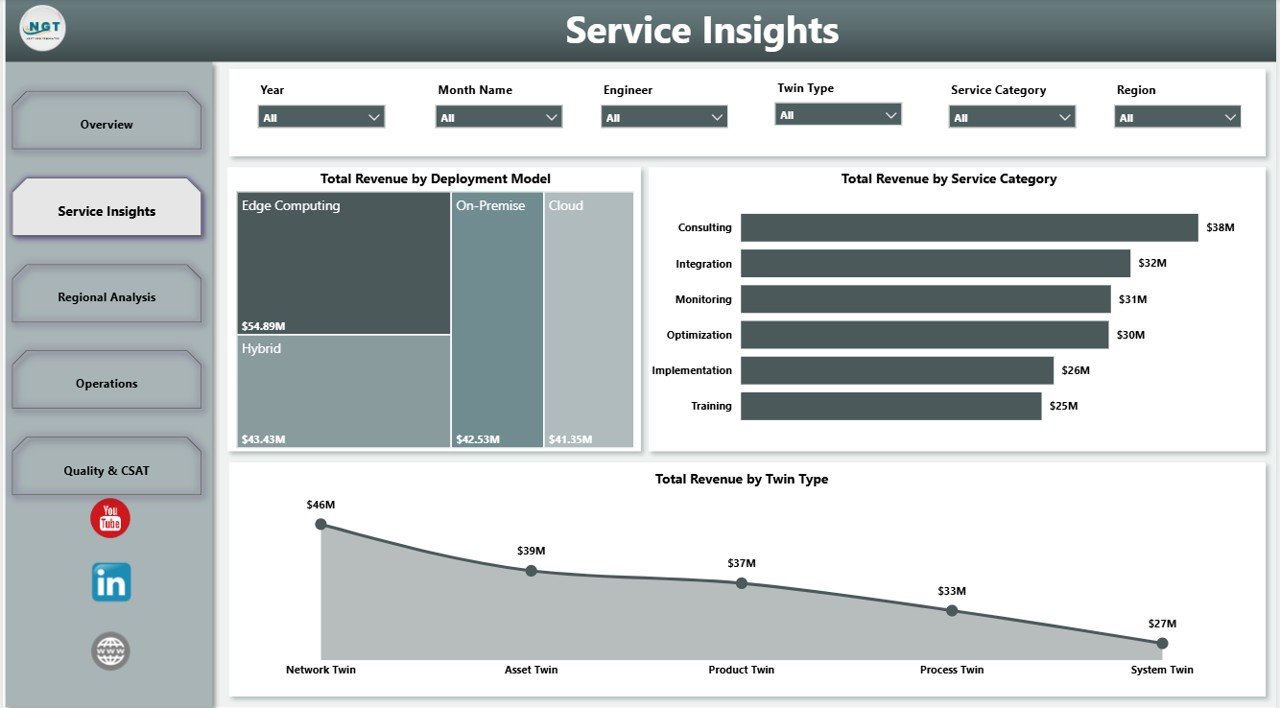
The Service Insights page explains how revenue is distributed across service and technical delivery dimensions.
Total Revenue by Deployment Model compares revenue from cloud, on-premise, hybrid, or similar deployment models. It helps teams understand which architecture choices drive the most commercial value.
Total Revenue by Service Category shows the contribution of consulting, implementation, monitoring, support, simulation, or other service groups. It separates high-volume activity from high-value service lines.
Total Revenue by Twin Type compares revenue by the type of digital twin being delivered. Use it to identify which twin offerings deserve more sales attention or technical investment.
3. Regional Analysis
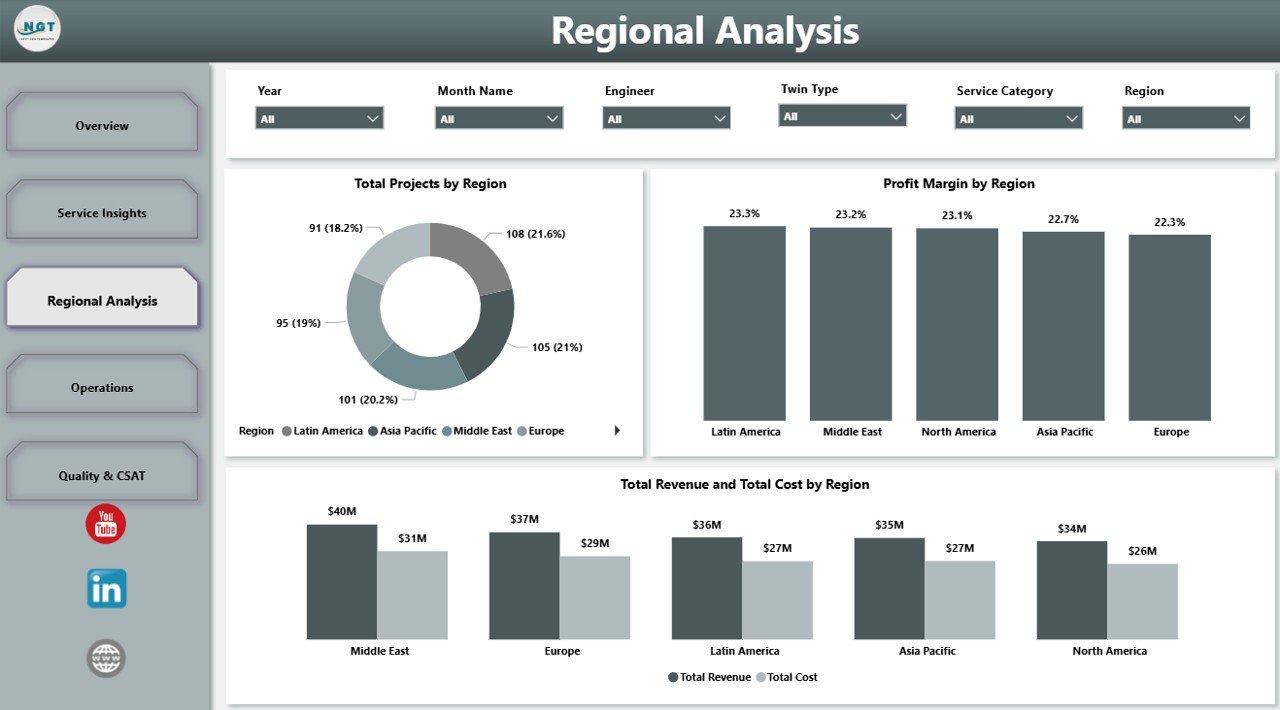
The Regional Analysis page helps managers compare delivery activity and financial performance by geography.
Total Projects by Region shows where digital twin delivery volume is concentrated. This supports staffing, capacity planning, and regional delivery review.
Profit Margin by Region compares margin performance across territories. It helps leaders find regions with strong delivery economics and regions where pricing or cost needs attention.
Total Revenue and Total Cost by Region places revenue and cost side by side. This makes regional profitability easier to explain during monthly reviews.
4. Operations
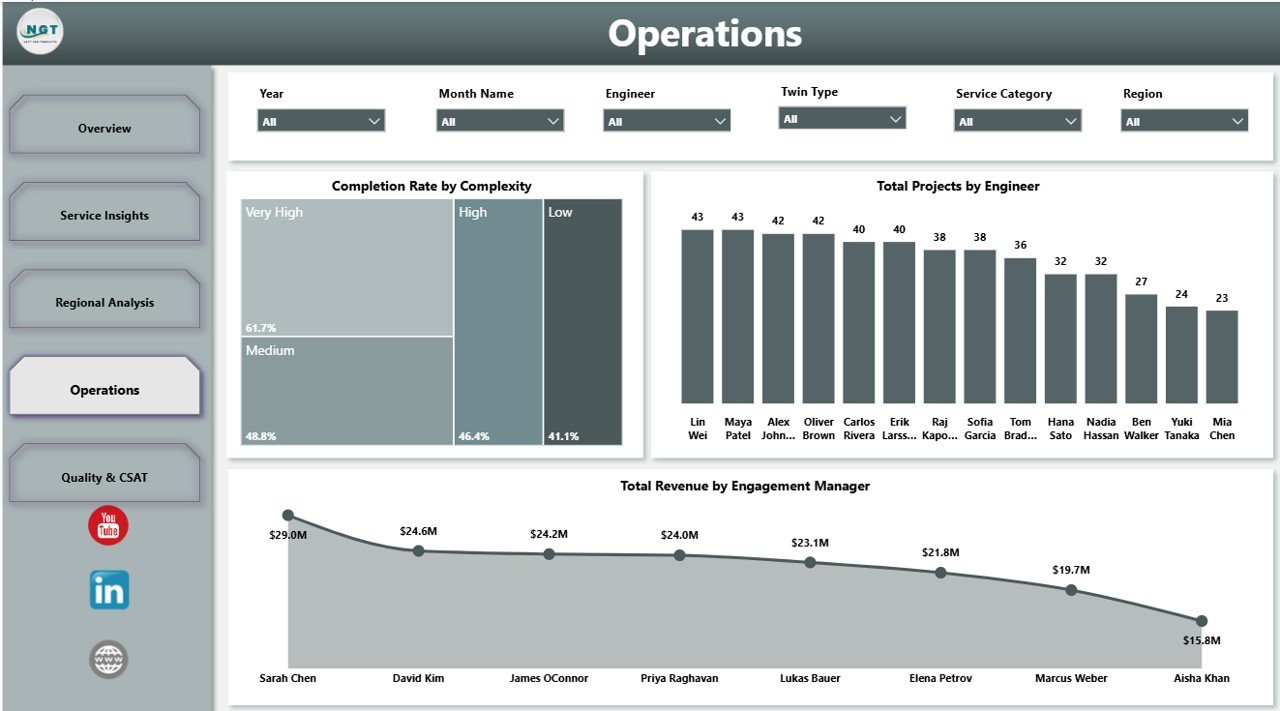
The Operations page is built for delivery managers, engineering leads, and engagement managers who need to review execution quality and workload.
Completion Rate by Complexity shows how project delivery changes across low, medium, and high complexity work. It helps teams see whether complex work needs more support or better scoping.
Total Projects by Engineer compares project volume by engineer. Managers can use it to balance workload and recognize delivery contribution.
Total Revenue by Engagement Manager shows revenue ownership across client-facing managers. It helps leadership review account contribution and portfolio responsibility.
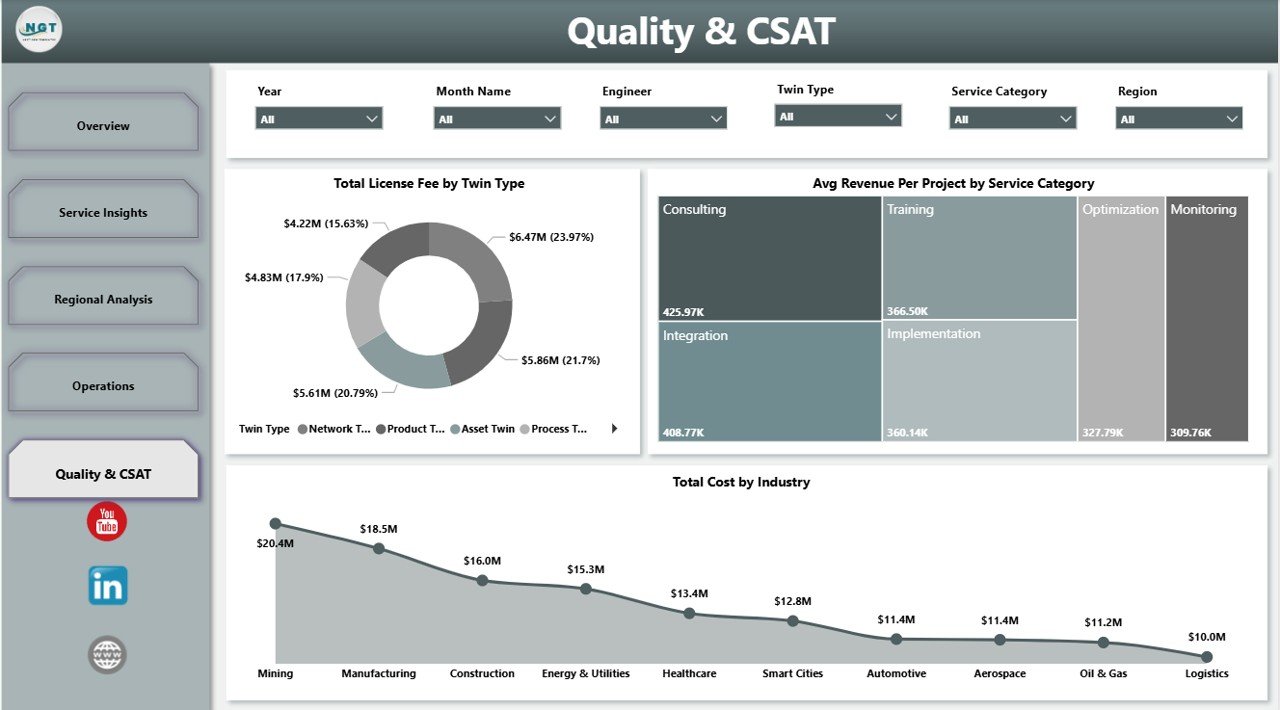
5. Quality & CSAT
The Quality & CSAT page connects commercial results with service quality and customer experience.
Total License Fee by Twin Type shows license fee contribution across different digital twin offerings. It helps product and service leaders understand where recurring or platform-related fees are strongest.
Avg Revenue Per Project by Service Category compares average project value by service group. This helps identify premium service categories and areas where pricing may need review.
Total Cost by Industry shows delivery cost by industry. It helps teams identify sectors that require more effort, higher technical support, or tighter cost control.
Digital Twin Services Dashboard in Power BI vs. Tableau vs. Paid Digital Twin SaaS – Where This Fits
| Feature | This Power BI dashboard | Tableau alternative | Paid digital twin SaaS |
|---|---|---|---|
| Cost | $17.99 one-time | License plus dashboard build time | Monthly or annual subscription |
| Platform | Power BI Desktop | Tableau Desktop or Cloud | Vendor-hosted platform |
| Setup time | Open .pbix and replace or connect data | Build data model and visuals | Implementation and configuration project |
| Customizable fields | Editable report, model, visuals, and measures | Editable with Tableau skills | Limited by vendor reporting options |
| Digital twin service analytics | Built in across 5 pages | Must be designed | Often built in, but less flexible |
| Year-1 cost at 5 users | $17.99 plus any Microsoft licensing | Often much higher | Often hundreds or thousands |
Who This Template Is For – and Who It’s Not For
This template is for digital twin service providers, IoT solution teams, smart manufacturing consultants, engineering analytics teams, operations leaders, project managers, and engagement managers who need an editable Power BI reporting layer. It is not a live IoT platform, simulation engine, sensor ingestion system, ERP replacement, or automated digital twin builder.
How to Use the Digital Twin Services Dashboard in Power BI
- Download and unzip the product file.
- Open the .pbix file in Power BI Desktop.
- Review the sample model and replace it with your approved digital twin service data.
- Refresh the report and validate KPI totals against your source data.
- Use slicers to filter by year, region, industry, service category, deployment model, twin type, engineer, manager, or complexity.
- Publish to Power BI Service only after checking your organization’s data privacy and sharing rules.
Real-World Use Cases
Arjun, digital twin program manager: Arjun uses the Overview and Operations pages before monthly steering meetings to explain revenue, cost, profit, project volume, and completion rate.
Maya, engineering delivery lead: Maya reviews projects by engineer and completion rate by complexity to balance delivery workload and identify difficult project types.
Daniel, IoT consulting director: Daniel uses Service Insights and Regional Analysis to decide which deployment models, regions, industries, and twin types deserve more sales focus.
Frequently Asked Questions
What does this dashboard track?
It tracks revenue, projects, license fees, cost, net profit, profit margin, completion rate, industry, month, deployment model, service category, twin type, region, complexity, engineer, engagement manager, and quality-related analysis.
Do I need Power BI Desktop?
Yes. The .pbix file is designed to open and edit in Power BI Desktop, which is available from Microsoft.
Can I customize the report?
Yes. You can edit visuals, measures, labels, colors, page names, relationships, and data source connections.
Does it connect directly to IoT sensors?
No. This is a reporting dashboard template, not a live IoT connector or simulation platform. You can connect or replace approved service data inside Power BI.
Can this replace a digital twin platform?
No. It is a reporting layer for performance analysis, not a platform for creating, running, or monitoring live digital twins.
Can I publish it to Power BI Service?
Yes, if your Microsoft licensing and organization permissions allow it. Review client confidentiality and access controls before sharing.
About the Author
Built by PK – Microsoft Certified Professional with 15+ years of Excel, Google Sheets, and Power BI experience. Founder of NextGenTemplates, reaching 300K+ subscribers across YouTube channels. Every template is hand-built and tested before release.
Explore Related Templates
You may also like Digital Twin Services Dashboard in Excel, IT Asset Management Dashboard in Power BI, and Digital Microloans Dashboard in Power BI. Browse more Power BI templates and Power BI dashboard templates.
Download the Digital Twin Services Dashboard in Power BI today and turn digital twin service performance data into clear, interactive reporting.
Last updated: June 2026


Reviews
There are no reviews yet.