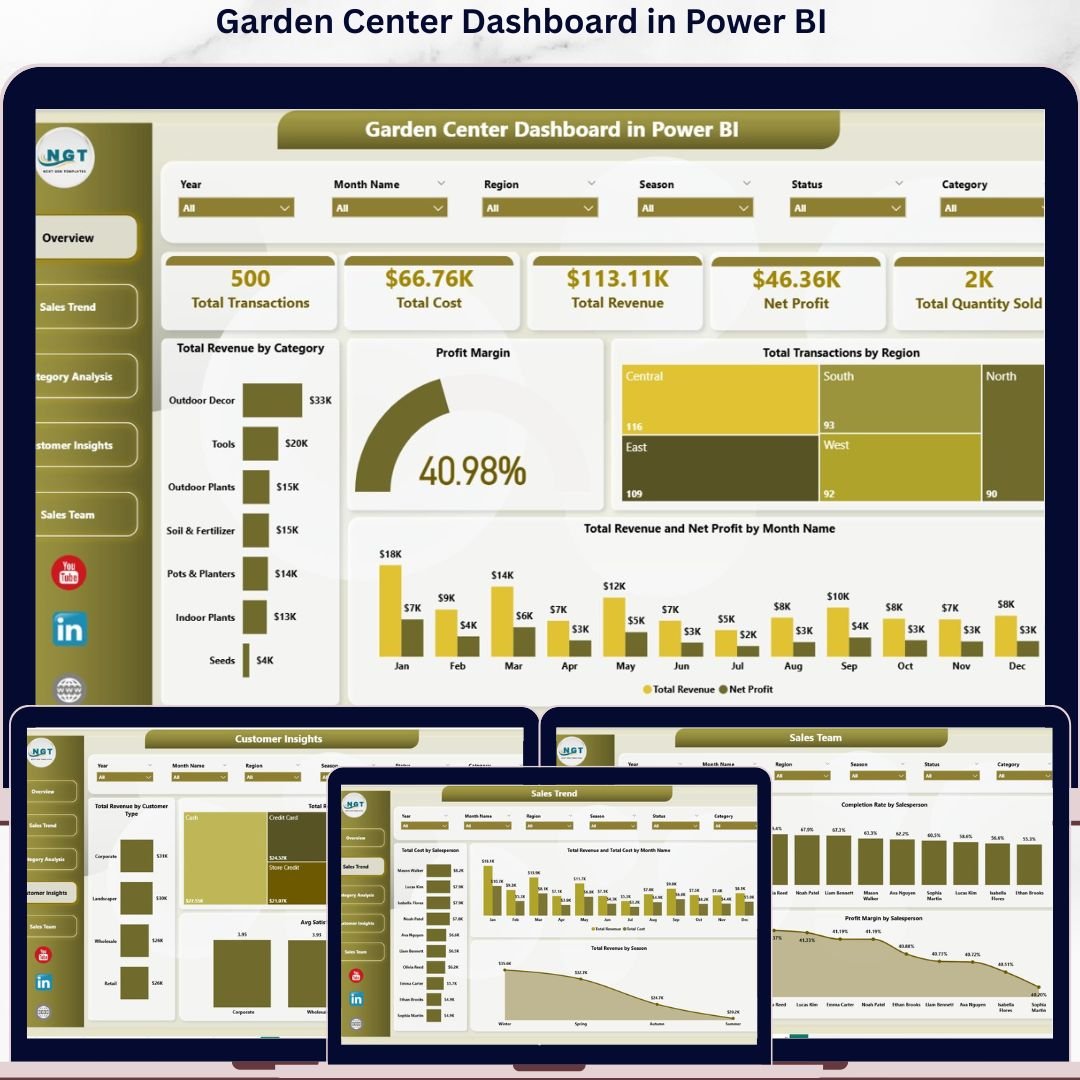


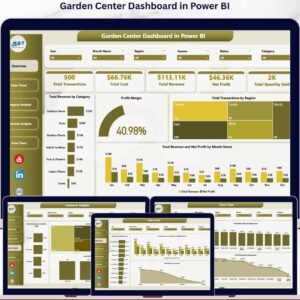
The Garden Center Dashboard in Power BI tracks 5 headline KPIs across 5 interactive analysis pages, powered by 14 DAX-driven visuals, multi-dimensional slicers, and one clean data model. Setup takes under 10 minutes — connect your transactions, click Refresh, and every page rebuilds automatically.
🌍 Join 8,400+ teams in 40+ countries using NextGenTemplates to replace $89–$289 per register per month cloud POS analytics with one-time-purchase Excel, Google Sheets, Power BI, and HTML templates.
✅ Instant download · One-time payment · No subscription · No per-user fees · Lifetime access
🔑 Key Features of Garden Center Dashboard in Power BI
🚀 5 Live KPI Cards on the Overview Page
Track Total Transactions, Total Cost, Total Revenue, Net Profit, and Total Quantity Sold in real time. Every card recalculates the moment you refresh — no DAX edits needed when your garden center adds a new product line, season, or location.
📊 Slicer-Based Filtering Across 5 Pages
Slicers for Category, Region, Season, Salesperson, Customer Type, and Payment Method sit at the top of each report page. One click filters every visual and KPI card so you can see, say, “Plants sold by the South region in Spring” in two seconds — no Power Query rewrites, no DAX changes.
🪴 14 DAX-Driven Charts Across Overview, Sales Trend, Category, Customer, and Sales Team Pages
Includes Total Revenue by Category, Profit Margin gauge, Total Transactions by Region, Total Revenue and Net Profit by Month Name, Total Cost by Salesperson, Total Revenue by Season, Profit Margin by Category, Total Revenue by Customer Type, Avg Satisfaction by Customer Type, Total Transactions by Salesperson, Completion Rate by Salesperson, and Profit Margin by Salesperson.
🔄 Pre-Built DAX Measures & Auto-Refresh Architecture
All KPIs and visuals are powered by reusable DAX measures: Total Revenue, Total Cost, Net Profit, Profit Margin %, Total Transactions, Total Quantity, Avg Satisfaction, and Completion Rate. Add 100 rows or 100,000 rows to your transaction source, click Home → Refresh, and the Garden Center Dashboard in Power BI rebuilds itself.
🎯 Retail-Ready Data Model
The data model is structured for garden centers and plant nurseries — Date, Category, Product, Season, Region, Channel, Customer Type, Salesperson, Status, Quantity, Revenue, Cost, Net Profit, Payment Method, and Satisfaction Score. No custom modeling — connect your POS export and the report works immediately.
💼 Free Lifetime Updates & Free Power BI Desktop
Works in Microsoft Power BI Desktop (free download from Microsoft) and publishes to Power BI Service if you have a Pro license. Every structural improvement to the template is shared with all past buyers at no additional cost.
📦 What’s Inside the Garden Center Dashboard in Power BI
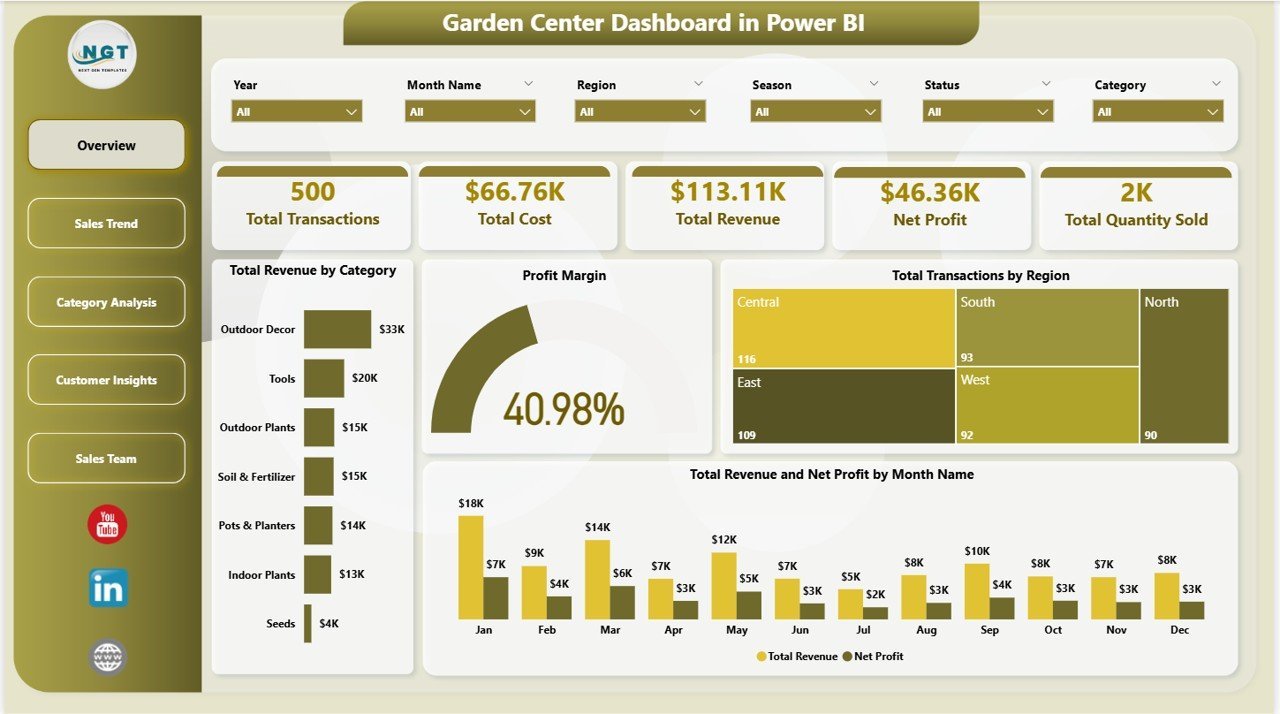
Page 1: Overview Page
The Overview page opens with 5 headline KPI cards — Total Transactions, Total Cost, Total Revenue, Net Profit, and Total Quantity Sold — plus 4 analysis visuals: Total Revenue by Category (ranks plants, soil, pots, tools, and fertilizers by contribution), Profit Margin (gauge-style overall margin %), Total Transactions by Region (which store locations or delivery zones drive volume), and Total Revenue and Net Profit by Month Name (seasonal peaks for bedding plants, holiday trees, tools). Slicers for Category, Region, and Season filter the entire page in one click.

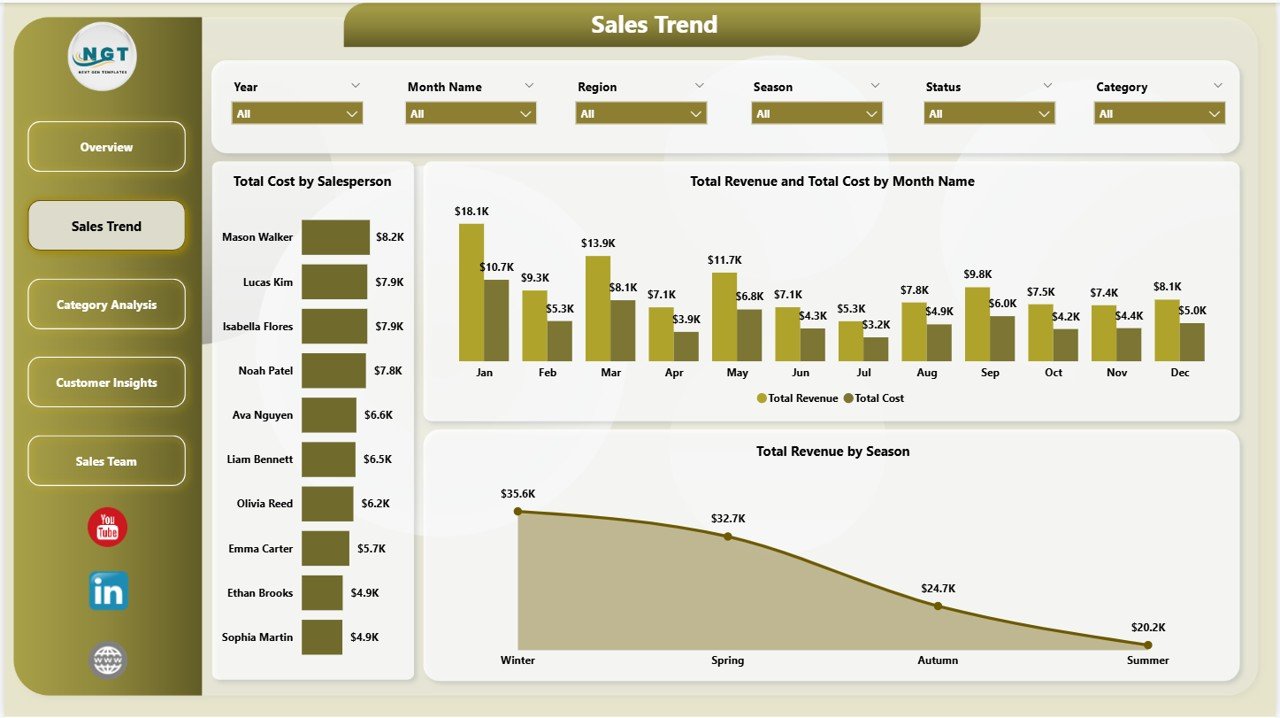
Page 2: Sales Trend
The Sales Trend page tracks month-over-month performance with three visuals: Total Cost by Salesperson (which staff are driving the highest COGS — and selling the most), Total Revenue and Total Cost by Month Name (gross margin pulse across the year), and Total Revenue by Season (Spring vs Summer vs Fall vs Winter — critical for garden retail planning, inventory ordering, and labor scheduling).
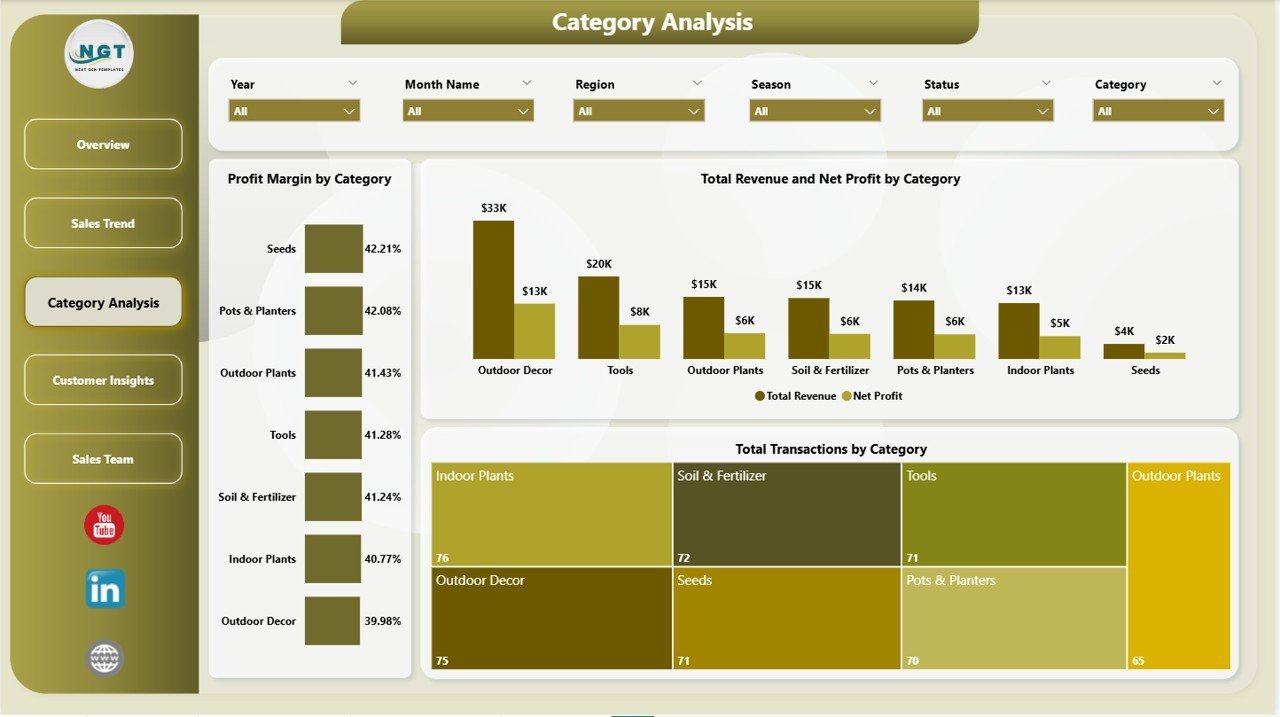
Page 3: Category Analysis
The Category Analysis page drills into product-level profitability with three charts: Profit Margin by Category (Profit Margin % by Plants, Soil & Mulch, Pots, Tools, Garden Chemicals, Outdoor Furniture), Total Revenue and Net Profit by Category (revenue vs net profit side-by-side per category), and Total Transactions by Category (transaction volume rank per category). Instantly see whether indoor plants or outdoor furniture is actually paying your bills.

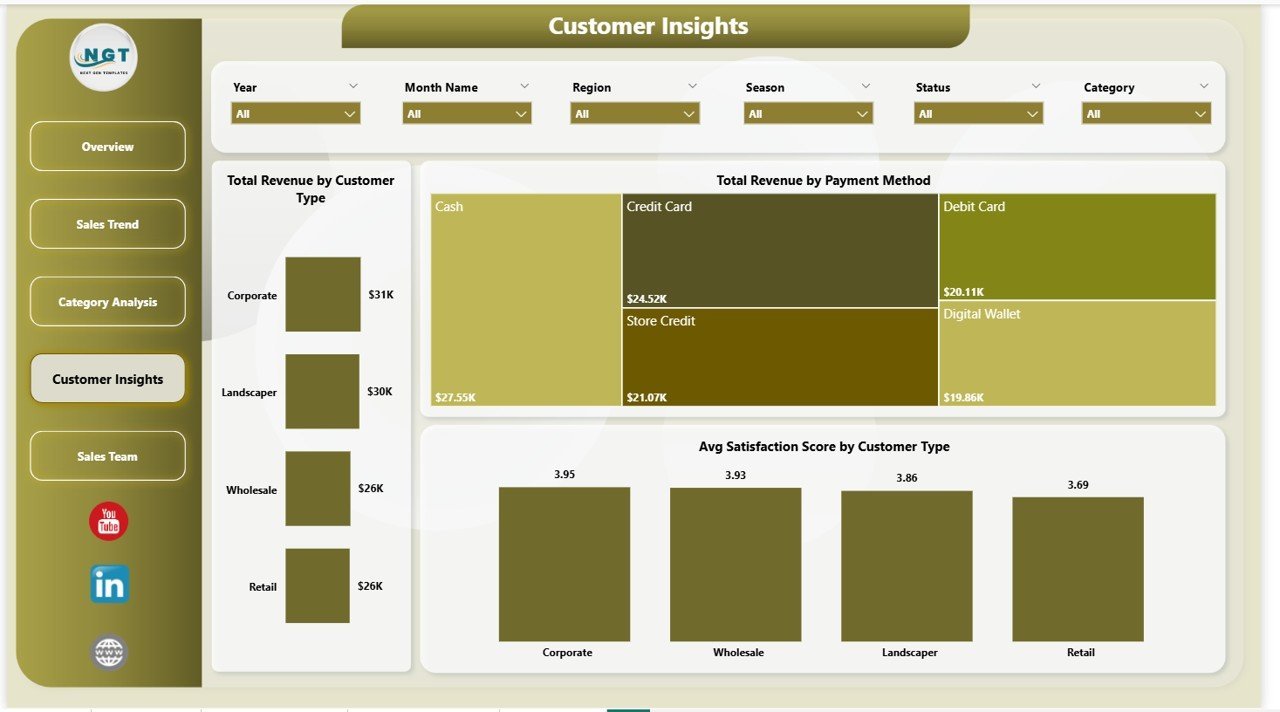
Page 4: Customer Insights
The Customer Insights page segments your customer base across three views: Total Revenue by Customer Type (Retail Shopper vs Landscaper vs B2B contract buyer), Total Revenue by Payment Method (Cash vs Card vs UPI vs Net Banking — critical for treasury and reconciliation), and Avg Satisfaction Score by Customer Type (which segment is the most loyal — and the most at risk). Plan loyalty offers, B2B credit terms, and payment-acceptance strategy from one screen.

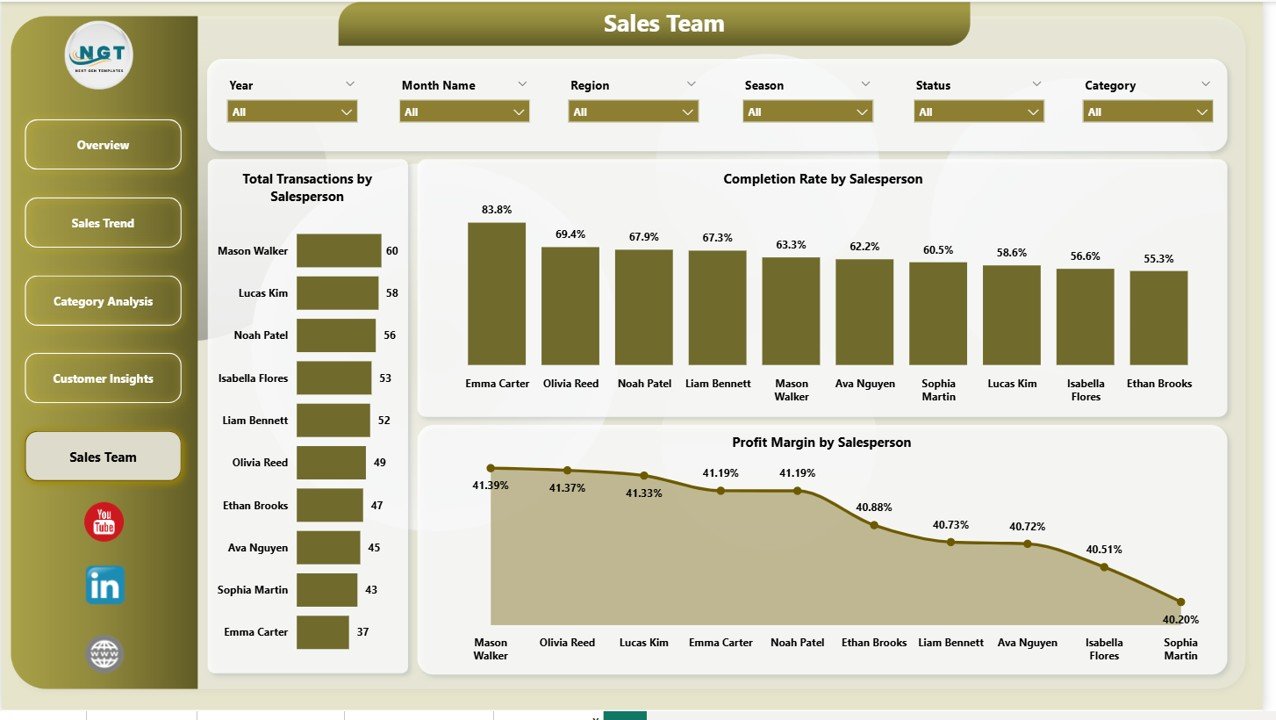
Page 5: Sales Team
The Sales Team page benchmarks every staff member on three dimensions: Total Transactions by Salesperson (volume), Completion Rate by Salesperson (% of opportunities closed vs returned/cancelled/pending), and Profit Margin by Salesperson (margin quality, not just revenue). Finally see which team member is closing high-margin landscaping packages versus low-margin seed-packet sales — directly inputs into commission structure and coaching plans.
📊 Garden Center Dashboard in Power BI vs. Tableau / Qlik vs. Lightspeed Retail / Shopify POS Analytics — Where This Fits
| Feature | Garden Center Dashboard in Power BI | Tableau / Qlik | Lightspeed Retail / Shopify POS |
|---|---|---|---|
| Cost | $17.99 one-time ✅ | $70–$840 / user / year | $89–$289 / register / month |
| Platform | Microsoft Power BI Desktop (free) ✅ | Proprietary Tableau / Qlik Cloud | Proprietary cloud POS |
| Setup time | Under 10 minutes ✅ | 1–5 days (modeling + publishing) | 2–5 days (hardware + config) |
| Real-time team collaboration | Via Power BI Service (Pro) | ✅ Native | ✅ Native |
| Mobile access | Power BI mobile app ✅ | Tableau Mobile ✅ | Dedicated app ✅ |
| Customizable fields | Full DAX & Power Query access ✅ | ✅ Full | ❌ Fixed reports only |
| Share with link | Via Power BI Service | Via Tableau Cloud | Via vendor portal |
| Year-1 cost at 5 users | $17.99 total ✅ | $3,500–$4,200 | $5,340–$17,340 |
| Profit Margin by Salesperson view | Pre-built ✅ | DIY in calc fields | Paid add-on |
For garden centers and plant nurseries that want full Power BI analytics without paying $3,000+ per year for Tableau or $5,000+ for cloud POS analytics, the Garden Center Dashboard in Power BI sits in the sweet spot.
👥 Who This Template Is For — and Who It’s Not For
✅ This template is built for:
- Independent garden center owners running 1–10 retail locations who want Power BI–level visuals without hiring a BI consultant
- Plant nursery managers tracking seasonal sales, salesperson performance, and supplier-side margins month over month
- Multi-location garden retailers needing region-level slicers and store benchmarking on a single canvas
- Retail analysts and consultants advising garden, outdoor, or horticulture clients on a one-template-per-engagement basis
- Power BI–comfortable owners who want analytics without cloud vendor lock-in or per-user SaaS fees
❌ This template is NOT for:
- Enterprise garden-retail chains needing row-level security with Active Directory or SSO across 50+ stores
- Teams that have never opened Power BI Desktop and don’t want to learn the Refresh button
- Businesses that need integrated payment processing, inventory deduction, and reporting in one system — get a full POS instead
- Companies that need real-time POS data streaming — this template uses scheduled refresh from your POS export, not a live connection by default
⚙️ How to Use the Garden Center Dashboard in Power BI
- Download the .zip and extract the Garden Center Dashboard in Power BI .pbix file to your laptop.
- Open the .pbix file in Microsoft Power BI Desktop (free download from Microsoft).
- In the Data view, replace the sample transaction table with your own garden center sales records — keep the column names identical.
- Click Home → Refresh in the Power BI ribbon to rebuild every measure, visual, and KPI card.
- Open the Overview page to view the 5 KPI cards; use the slicers at the top to filter by Category, Region, or Season.
- Navigate through Sales Trend, Category Analysis, Customer Insights, and Sales Team pages for deeper analysis.
- Publish to Power BI Service (requires Power BI Pro) to share with team members via link or to view on the mobile app.
💼 Real-World Use Cases
Maya owns an independent garden center in suburban Ohio. Spring is her big season — bedding plants, mulch, seed packets — but she had no way to see which category was actually profitable week-by-week. She uses the Garden Center Dashboard in Power BI to refresh her POS export every Monday morning, filter the Overview by Season = Spring, and instantly see that her hanging-basket category is doing 3× the margin of her fertilizer category. She’s reallocated spring display space based on that single visual.
Arjun runs a plant nursery in Pune with 4 salespeople. He was guessing who was closing high-value landscaping consults and who was stuck selling ₹150 seedlings. The Sales Team page of the Garden Center Dashboard in Power BI showed him Profit Margin by Salesperson and Completion Rate by Salesperson — and he restructured commissions within a week. Two months later his team’s blended margin rose 9 points.
Linda consults for 6 small garden retailers across Texas. She replaced her old PowerPoint reporting stack with this one — refresh each client’s data, screenshot the slicer-filtered visuals, email the PDF. One Power BI Dashboard Template, six clients, zero per-user subscription fees.
❓ Frequently Asked Questions
How much does the Garden Center Dashboard in Power BI cost compared to Tableau?
The Garden Center Dashboard in Power BI is a one-time $17.99 purchase. Tableau Creator licenses start at roughly $70 per user per month — over $840 per year per user. For a 5-person garden retail team, that’s $4,200 a year vs $17.99 once. This template delivers the reporting layer on Microsoft Power BI Desktop (free), with no per-seat fees.
How long does setup take?
Setup for the Garden Center Dashboard in Power BI takes under 10 minutes. Extract the .zip, open the .pbix file in Power BI Desktop, replace the sample transactions with your own data in the existing schema, and click Home → Refresh. Every KPI card, slicer, and visual across all 5 pages recalculates automatically — no DAX rewriting required.
Can this dashboard handle multi-location garden center chains?
Yes. The Garden Center Dashboard in Power BI includes a Region column in the data model and a Total Transactions by Region visual on the Overview page. Add a location code per row, and the Region slicer on every page filters the whole report by store or delivery zone instantly. The model has been tested with up to 100,000 transaction rows on a typical 16 GB laptop.
What version of Power BI do I need?
Microsoft Power BI Desktop (free) is sufficient to open, edit, and refresh the file locally. Power BI Pro ($14 per user per month) is only required if you want to publish to Power BI Service and share via link. The template uses standard DAX measures and Power Query steps documented in the official Microsoft Power BI documentation.
Can I add new categories, regions, or salespeople without breaking the dashboard?
Yes. Add new rows to the source data — including new product categories, seasons, salespeople, or regions — and click Home → Refresh. The DAX measures, slicers, and visuals in the Garden Center Dashboard in Power BI all use dynamic field references, so new dimension values appear automatically without any rewrites.
Is the data stored in the Microsoft cloud or shared with NextGenTemplates?
No. The Garden Center Dashboard in Power BI is a standalone .pbix file stored only on your computer. There is no telemetry, no account requirement, no automatic cloud sync. If you choose to publish to Power BI Service, the data is stored in your own Microsoft tenant — under your control, never accessible to NextGenTemplates.
Does this come with an Excel or Google Sheets version?
Yes — the Garden Center Dashboard in Excel is the cross-platform sibling, with the same 5-page structure built on pivot tables and slicers. Pick the Power BI version if you want DAX, dynamic visuals, and Power BI Service publishing — and the Excel version if your team lives in spreadsheets.
👤 About the Author
Built by PK — Microsoft Certified Professional with 15+ years of Excel, Google Sheets, and Power BI experience. Founder of NextGenTemplates, reaching 300K+ subscribers across YouTube channels (@PK-AnExcelExpert, @NextGenTemplates, @NeoTechNavigators). Every template is hand-built and tested before release.
🔗 Explore Related Templates
Also available on other platforms and for adjacent retail industries:
- Garden Center Dashboard in Excel — Same 5-page architecture in Microsoft Excel with pivot tables and slicers
- Landscaping Services Dashboard in Power BI — Sister Power BI template for landscaping service firms
- Photography Business Dashboard in Power BI — Same Power BI architecture for service-based small businesses
- Print Shop Dashboard in Power BI — Adjacent retail vertical with similar customer-and-margin analytics
- Browse all Power BI Dashboard Templates
- Browse all Excel Dashboard Templates
📖 Click here to read the Detailed Blog Post
🎥 Visit our YouTube channel for step-by-step video tutorials
👉 YouTube.com/@NextGenTemplates
📅 Last updated: May 2026
Watch the step-by-step video tutorial:
YouTube


Reviews
There are no reviews yet.