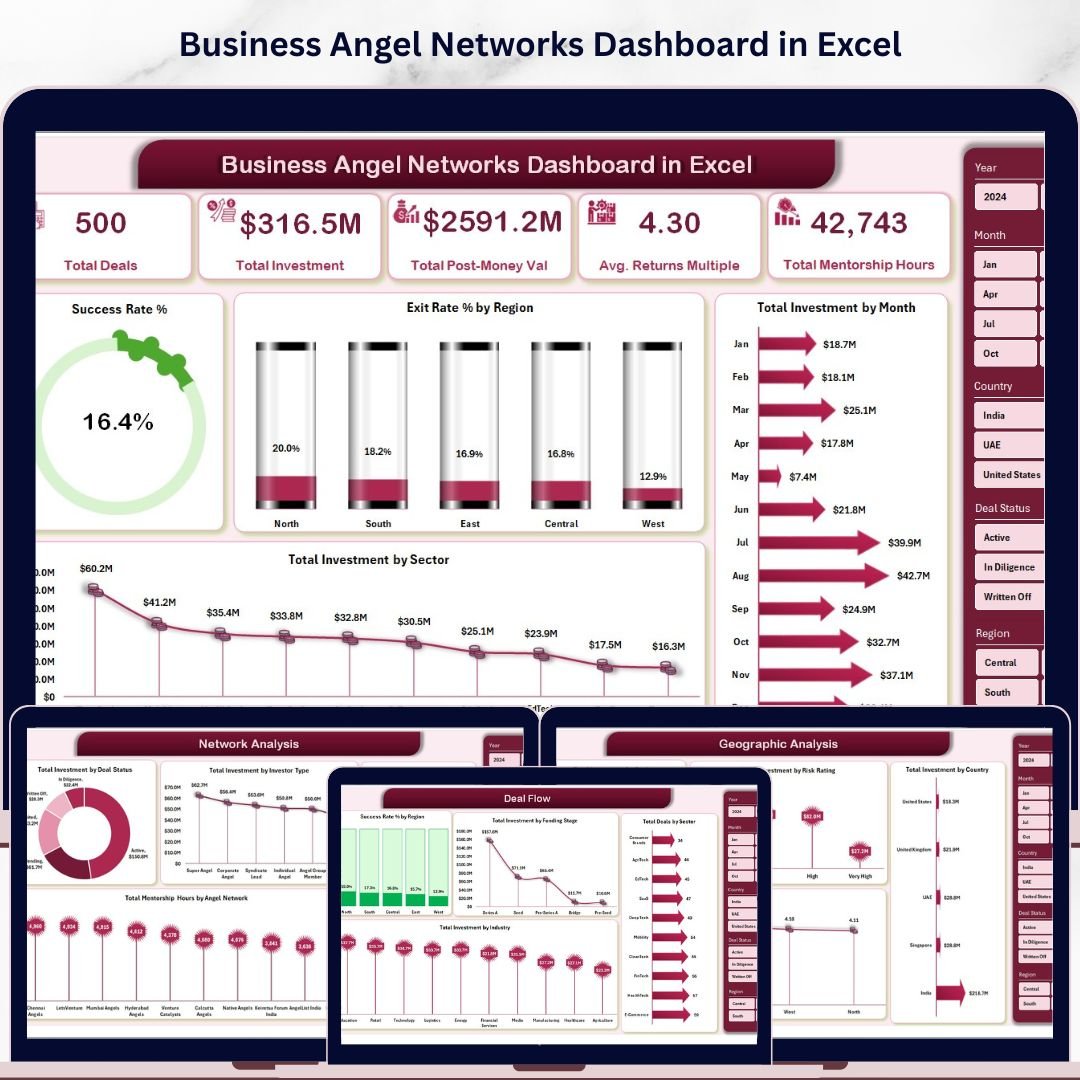

Angel investors collectively deploy over $25 billion annually across 60,000+ startup deals in the US alone — yet most angel networks still manage deal flow, portfolio performance, and geographic analysis in disconnected spreadsheets with no unified view. The Business Angel Networks Dashboard in Excel consolidates your entire investment operation into 5 interactive analytics pages, tracking 5 high-level KPIs and 20+ pivot-driven charts from a single structured data sheet. Setup takes under 10 minutes — paste your deal data, hit Refresh All, and every chart, KPI card, and slicer updates automatically.
🌍 Join 8,400+ teams in 40+ countries using NextGenTemplates to replace expensive SaaS platforms with one-time-purchase Excel, Google Sheets, Power BI, and HTML templates.
✅ Instant download · One-time payment · No subscription · No per-user fees · Lifetime access
🔑 Key Features of the Business Angel Networks Dashboard in Excel
🔹 5 fully-interactive analytics pages — Overview, Deal Flow, Portfolio Performance, Network Analysis, and Geographic Analysis — plus a structured Data sheet and a hidden Support sheet holding the pivot engine. Each page answers a distinct investment question, from deal success rates to geographic concentration risk.
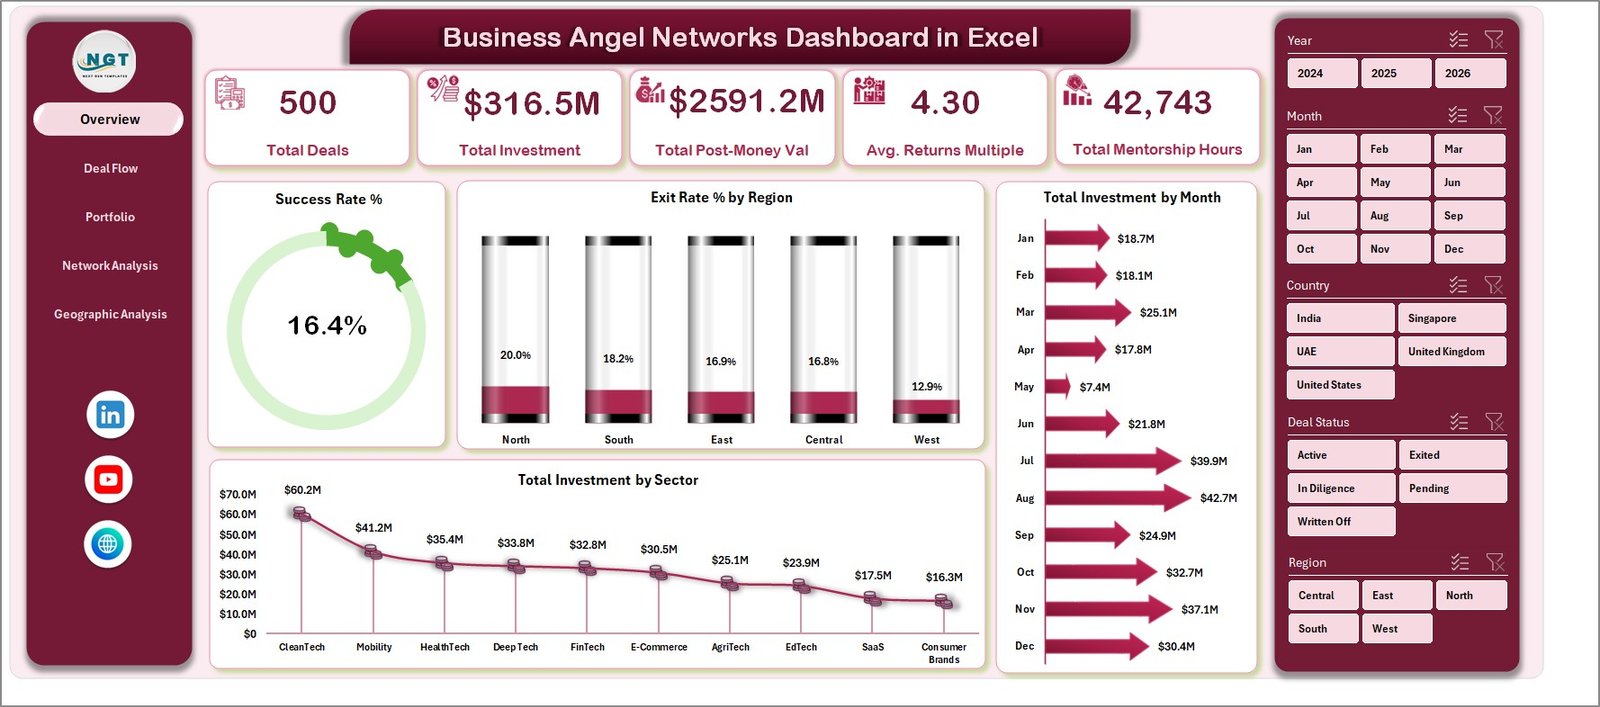
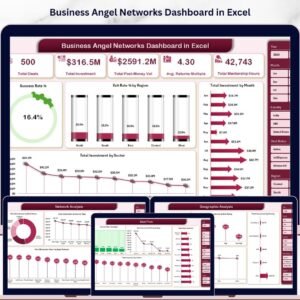
🔹 5 KPI cards on the Overview page — Total Deals, Total Investment, Total Post-Money Valuation, Avg. Returns Multiple, and Total Mentorship Hours. These headline metrics update in real-time when slicers are applied, giving angel network managers an instant pulse on portfolio health.
🔹 20+ pivot-powered charts — including Success Rate %, Exit Rate % by Region, Total Investment by Sector and by Month, Deals by Region and Sector, Returns Multiple by Funding Stage and Sector, Investment by Deal Status and Investor Type, and Avg. Equity Stake % by Investor Type. All charts update with a single click on Refresh All.
🔹 Dynamic slicers for instant filtering — apply filters by Region, Sector, Funding Stage, Investor Type, Risk Rating, Deal Status, and Angel Network without writing a single formula. Every page responds simultaneously, making board-level reporting and LP updates a 5-minute task.
🔹 Support Sheet with pivot engine — all charts draw from pivot tables in the Support sheet. After updating your data, go to the Data tab in Excel Ribbon → click Refresh All and every pivot, chart, and KPI card refreshes in seconds. The Support sheet can remain hidden for a clean presentation.
📦 What’s Inside the Business Angel Networks Dashboard in Excel
The dashboard includes 7 structured sheets covering every layer of angel investment analytics:
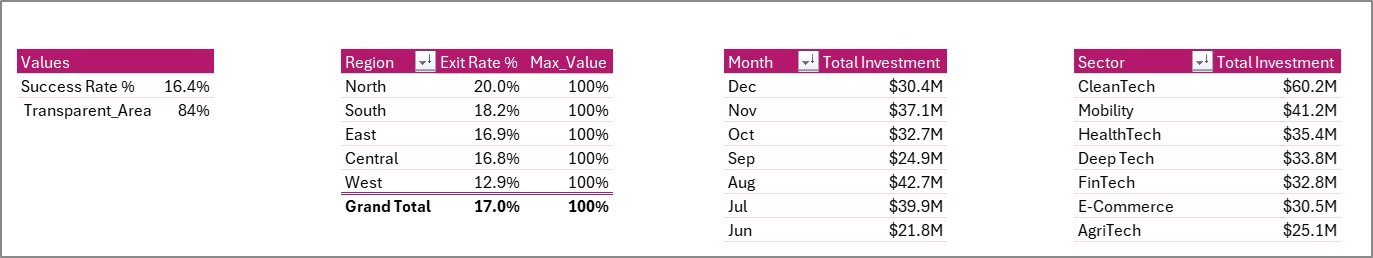
1 – Overview Page: 5 KPI cards (Total Deals, Total Investment, Total Post-Money Valuation, Avg. Returns Multiple, Total Mentorship Hours) plus 4 charts: Success Rate %, Exit Rate % by Region, Total Investment by Sector, Total Investment by Month. Slicers enable rapid portfolio-wide filtering.
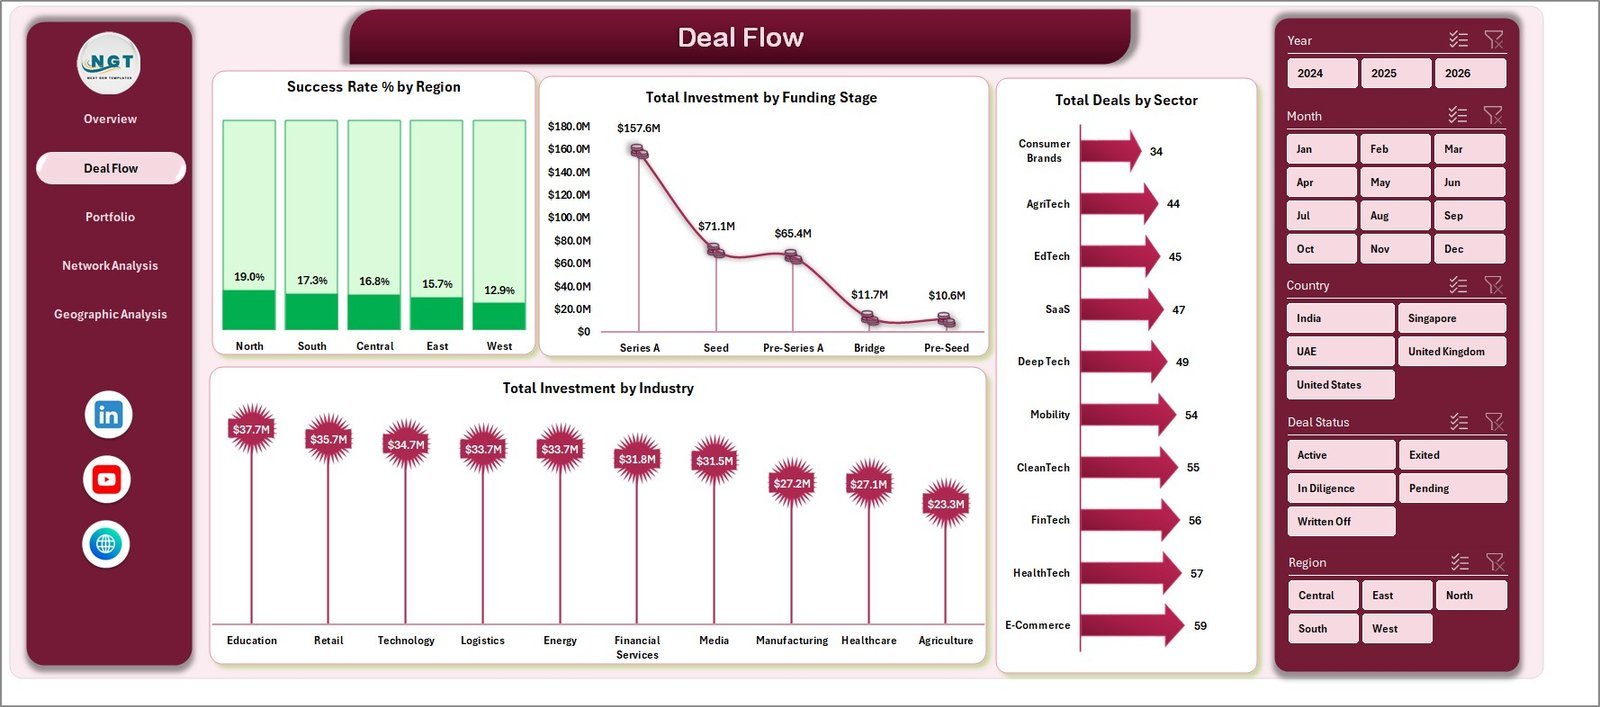
2 – Deal Flow: Analyzes your deal pipeline with Success Rate % by Region, Total Investment by Funding Stage, Total Deals by Sector, and Total Investment by Industry. Identify which regions and stages generate your highest-quality deal flow.
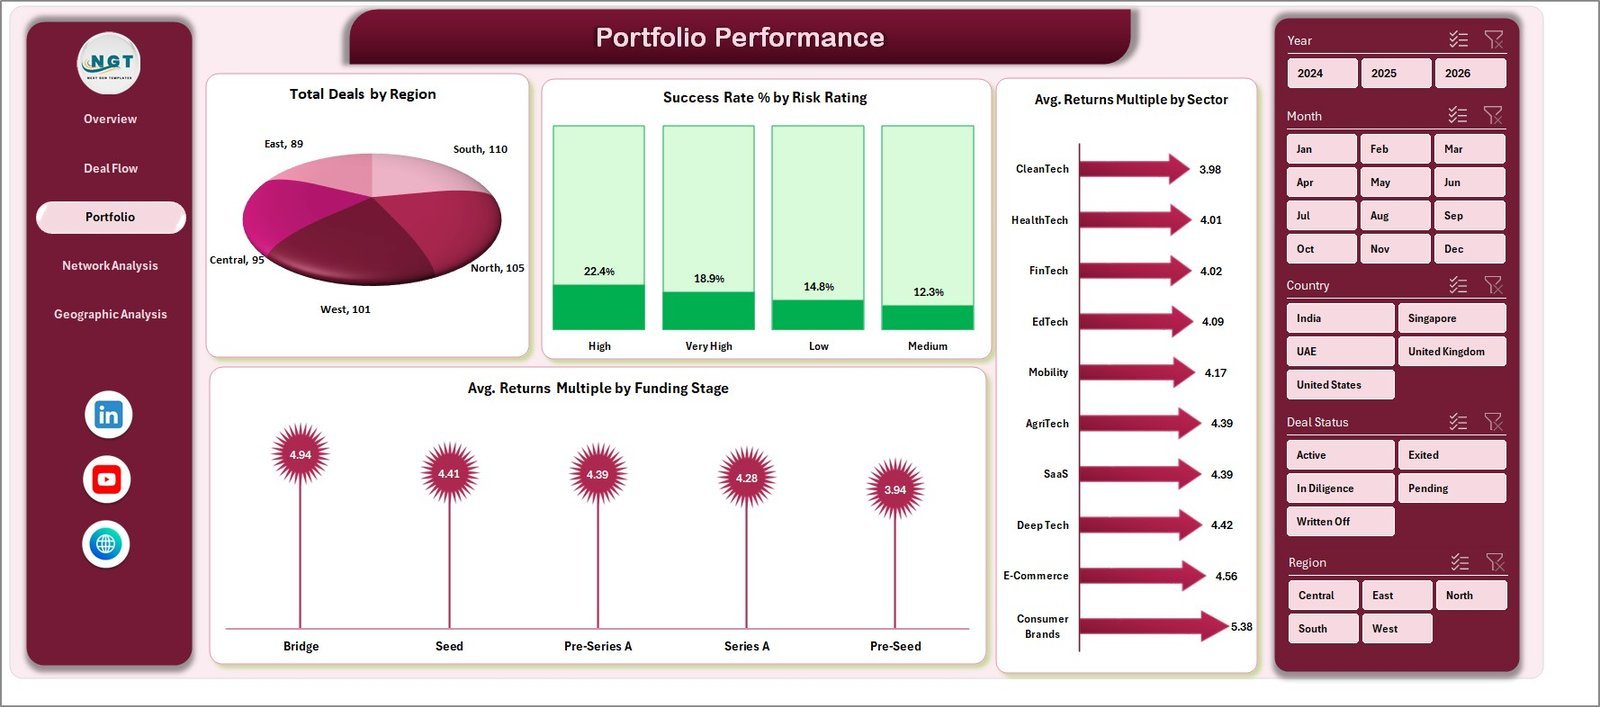
3 – Portfolio Performance: Tracks returns with Total Deals by Region, Success Rate % by Risk Rating, Avg. Returns Multiple by Sector, and Avg. Returns Multiple by Funding Stage. Pinpoint which bets are delivering the best multiples.
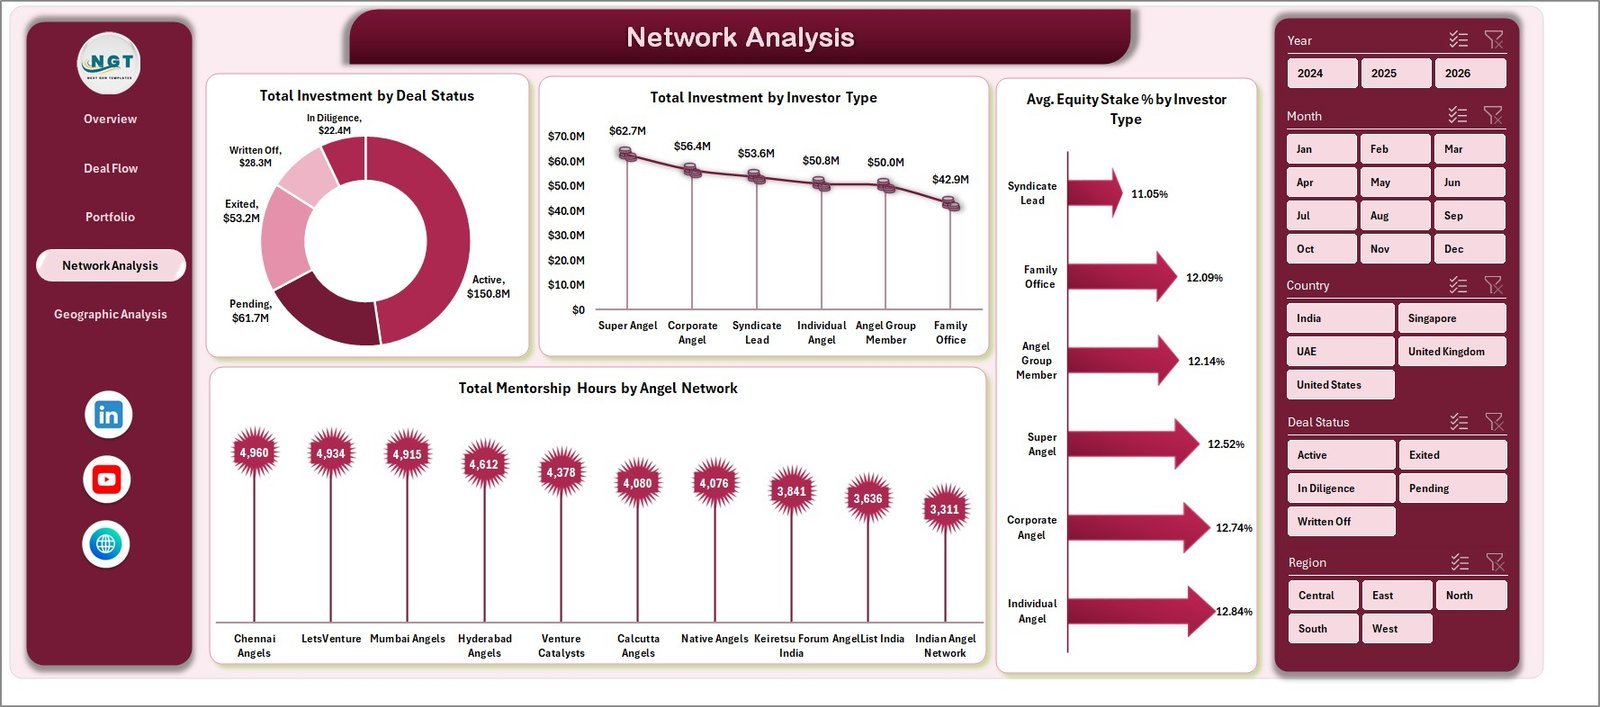
4 – Network Analysis: Examines network dynamics via Total Investment by Deal Status, Total Investment by Investor Type, Avg. Equity Stake % by Investor Type, and Total Mentorship Hours by Angel Network. Understand co-investment patterns and mentor engagement.
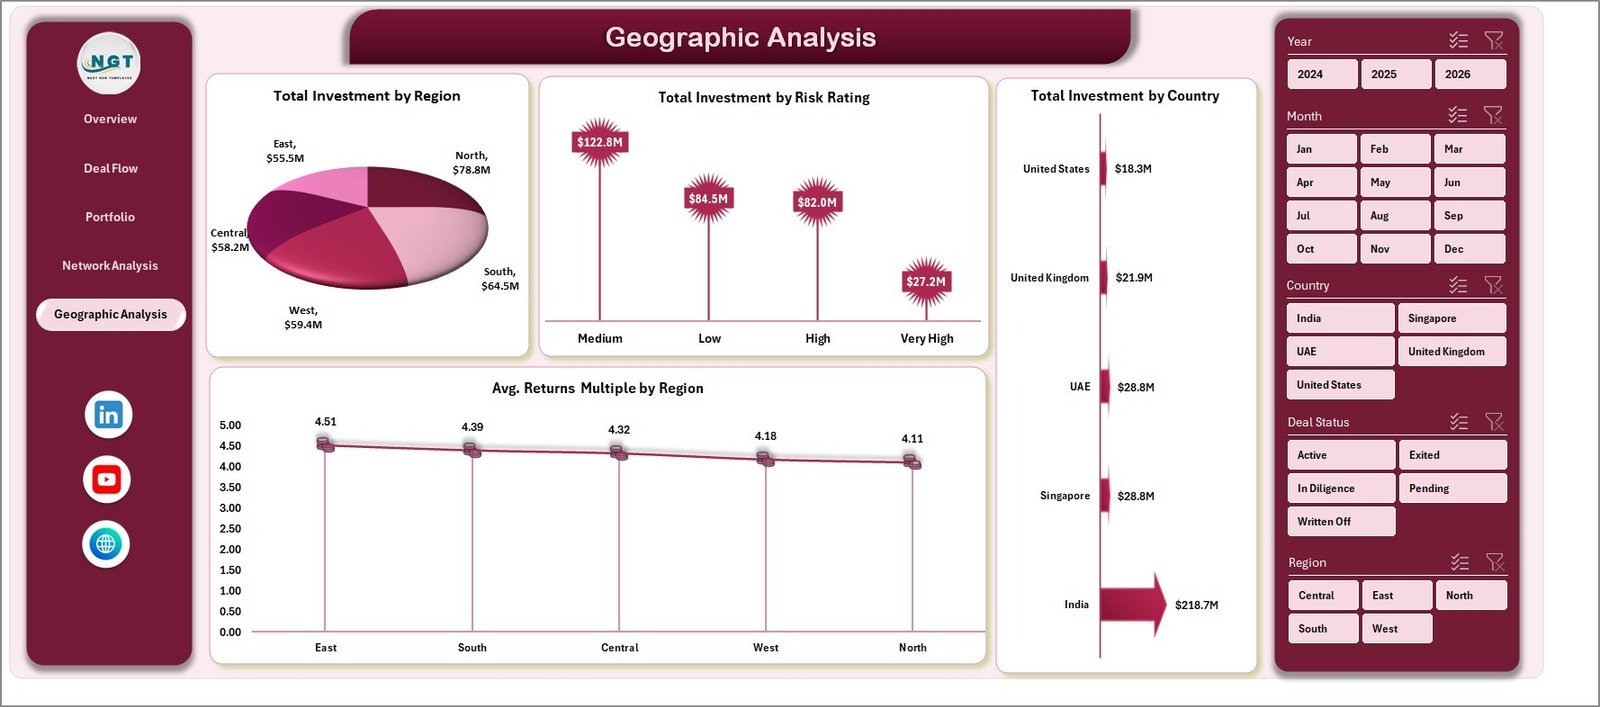
5 – Geographic Analysis: Maps capital deployment with Total Investment by Region, Total Investment by Risk Rating, Total Investment by Country, and Avg. Returns Multiple by Region. Spot geographic concentration risk before it becomes a portfolio problem.
6 – Data Sheet: The single input source. Add your deal records in the provided column format and run Refresh All — no manual chart updates ever needed.
7 – Support Sheet: Houses all pivot tables that feed the dashboard charts. Keep it hidden for a polished experience; unhide anytime for full transparency into the calculation engine.
📊 Business Angel Networks Dashboard vs. Google Sheets Version vs. AngelList / Paid VC SaaS — Where This Fits
| Feature | Business Angel Networks Dashboard in Excel | Google Sheets Version | AngelList / Carta / Paid VC SaaS |
|---|---|---|---|
| Cost | $17.99 one-time | ~$17.99 one-time | $500–$2,000+/year |
| Platform | Microsoft Excel | Google Sheets (cloud) | Web-based SaaS |
| Setup time | Under 10 minutes | Under 10 minutes | Days to weeks |
| Works offline | ✅ Fully offline | ❌ Requires internet | ❌ Requires internet |
| Customizable fields | ✅ Fully editable | ✅ Editable | ⚠️ Limited / locked |
| Real-time slicer filtering | ✅ Yes | ✅ Yes | ✅ Yes (paid) |
| No per-user fees | ✅ One file, unlimited users | ✅ Share freely | ❌ Per-seat pricing |
| Year-1 cost for 5 users | $17.99 total | $17.99 total | $2,500–$10,000+ |
| Angel Network-specific analytics | ✅ Built-in | ✅ Built-in | ⚠️ Generic or VC-focused |
For angel networks that want professional-grade deal flow and portfolio analytics without paying enterprise SaaS prices, the Business Angel Networks Dashboard in Excel sits in the sweet spot.
👥 Who This Template Is For — and Who It’s Not For
✅ This template is built for:
- Angel investors and angel network managers tracking 10–200+ active deals
- Family offices with early-stage startup allocations in Excel-based reporting workflows
- Startup ecosystem program managers monitoring cohort performance and mentor hours
- Finance teams at accelerators and incubators needing investor-grade portfolio reports
- Independent angels who want multi-dimensional analytics without committing to SaaS subscriptions
❌ This template is NOT for:
- Large VC firms needing LP portal integration, SOC 2 compliance, or ILPA reporting (look at Allvue or Carta)
- Teams needing live cap table management with real-time multi-party edits
- Users who don’t have Microsoft Excel 2016 or later installed
⚙️ How to Use the Business Angel Networks Dashboard in Excel
- Download and unzip the file, then open it in Microsoft Excel 2016 or later.
- Go to the Data Sheet and replace the sample deal records with your own investment data using the provided column structure (Deal Name, Sector, Region, Funding Stage, Investment Amount, Post-Money Valuation, Returns Multiple, Investor Type, Risk Rating, Mentorship Hours, etc.).
- Click Refresh All on the Excel Data tab — all pivot tables, KPI cards, and charts update in seconds.
- Use the slicers on any analytics page to filter by Region, Sector, Funding Stage, Investor Type, Risk Rating, or Deal Status and get immediate insights.
- Hide the Support Sheet for a clean, presentation-ready dashboard to share with LPs or network board members.
💼 Real-World Use Cases
Priya manages a 40-member angel syndicate in Singapore. Each quarter, she uses the Business Angel Networks Dashboard in Excel to prepare a deal flow report for her LP advisory board — showing which sectors captured the most capital, how success rates vary by funding stage, and where geographic concentration risk is building. What used to take 3 days of manual data consolidation now takes 30 minutes.
Marcus runs a university angel network with 25 active portfolio companies. He tracks mentorship hours by angel network and monitors returns multiples across cohorts using the Portfolio Performance and Network Analysis pages. The dashboard helps him demonstrate program ROI to university administrators and recruit new mentor angels each semester.
Sarah is an independent angel investor with 18 deals across 6 sectors. She uses the Geographic Analysis page to spot that 70% of her capital is concentrated in North America, and the Portfolio Performance page to identify that seed-stage fintech deals are delivering her highest Returns Multiples. These insights directly shaped her next investment thesis — without paying $1,200/year for a SaaS portfolio tracker.
❓ Frequently Asked Questions
What KPIs does the Business Angel Networks Dashboard in Excel track?
The Business Angel Networks Dashboard in Excel tracks 5 headline KPIs — Total Deals, Total Investment, Total Post-Money Valuation, Avg. Returns Multiple, and Total Mentorship Hours — plus 20+ chart-level metrics across deal flow, portfolio performance, network composition, and geographic spread. All metrics update automatically when you replace sample data with your own.
How long does it take to set up the Business Angel Networks Dashboard?
Setup takes under 10 minutes. Open the file in Microsoft Excel, paste your deal records into the Data Sheet following the provided column structure, then click Refresh All on the Excel Data tab. Every chart, KPI card, and slicer updates instantly — no formula editing or manual chart adjustments required.
Does this dashboard require any Excel plugins or add-ins?
No plugins or add-ins are required. The Business Angel Networks Dashboard in Excel runs entirely on native Excel pivot tables, charts, and slicers. It works in Microsoft Excel 2016, 2019, 2021, and Microsoft 365 on both Windows and Mac. No macros are needed — just standard Excel functionality.
How does this compare to AngelList or Carta for portfolio tracking?
AngelList and Carta are excellent for cap table management and legal document workflows, costing $500–$2,000+ per year. The Business Angel Networks Dashboard in Excel is a one-time $17.99 purchase focused on analytics and reporting — deal flow trends, returns analysis, geographic breakdown — without per-user fees or subscription lock-in. Both serve different purposes; this dashboard is for analytics, not cap table management.
Can I customize the metrics and add my own deal fields?
Yes. Since this is a standard Excel file with no locked sheets by default, you can add columns to the Data Sheet for custom fields specific to your angel network (e.g., board seat status, follow-on rounds, co-investor names). After adding columns, update the pivot tables in the Support Sheet to include the new fields, then click Refresh All.
Is the Business Angel Networks Dashboard available in Power BI or Google Sheets?
Yes. The Business Angel Networks Dashboard is also available as a KPI version in Excel and a Power BI version on NextGenTemplates. Choose the platform that best fits your team’s workflow and reporting preferences.
What Excel version is required?
The Business Angel Networks Dashboard in Excel requires Microsoft Excel 2016 or later, including Excel 2019, Excel 2021, and Microsoft 365 (both Windows and Mac). The file uses pivot tables and slicers which are fully supported in all these versions. It does not work in Excel for the Web or Google Sheets without manual adaptation.
👤 About the Author
Built by PK — Microsoft Certified Professional with 15+ years of Excel, Google Sheets, and Power BI experience. Founder of NextGenTemplates, reaching 300K+ subscribers across YouTube channels (@PK-AnExcelExpert, @NextGenTemplates, @NeoTechNavigators). Every template is hand-built and tested before release.
🔗 Explore Related Templates
- VC Portfolio Dashboard in Excel — 5-page venture capital portfolio analytics with fund-level KPIs, sector analysis, and partner performance tracking
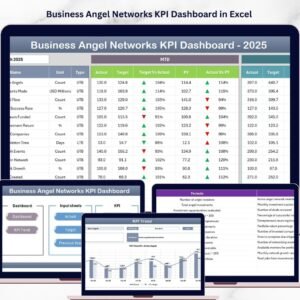
- Business Angel Networks KPI Dashboard in Excel — the KPI-scorecard companion to this dashboard, with traffic-light indicators and MTD/YTD tracking
- Investment Banking KPI Dashboard in Excel — deal advisory and M&A performance tracking for investment banking teams
- Browse all Excel Dashboards →
📖 Click here to read the Detailed Blog Post
🎥 Visit our YouTube channel for step-by-step video tutorials
👉 YouTube.com/@NextGenTemplates
📅 Last updated: May 2026
Watch the step-by-step video tutorial:
YouTube


Reviews
There are no reviews yet.