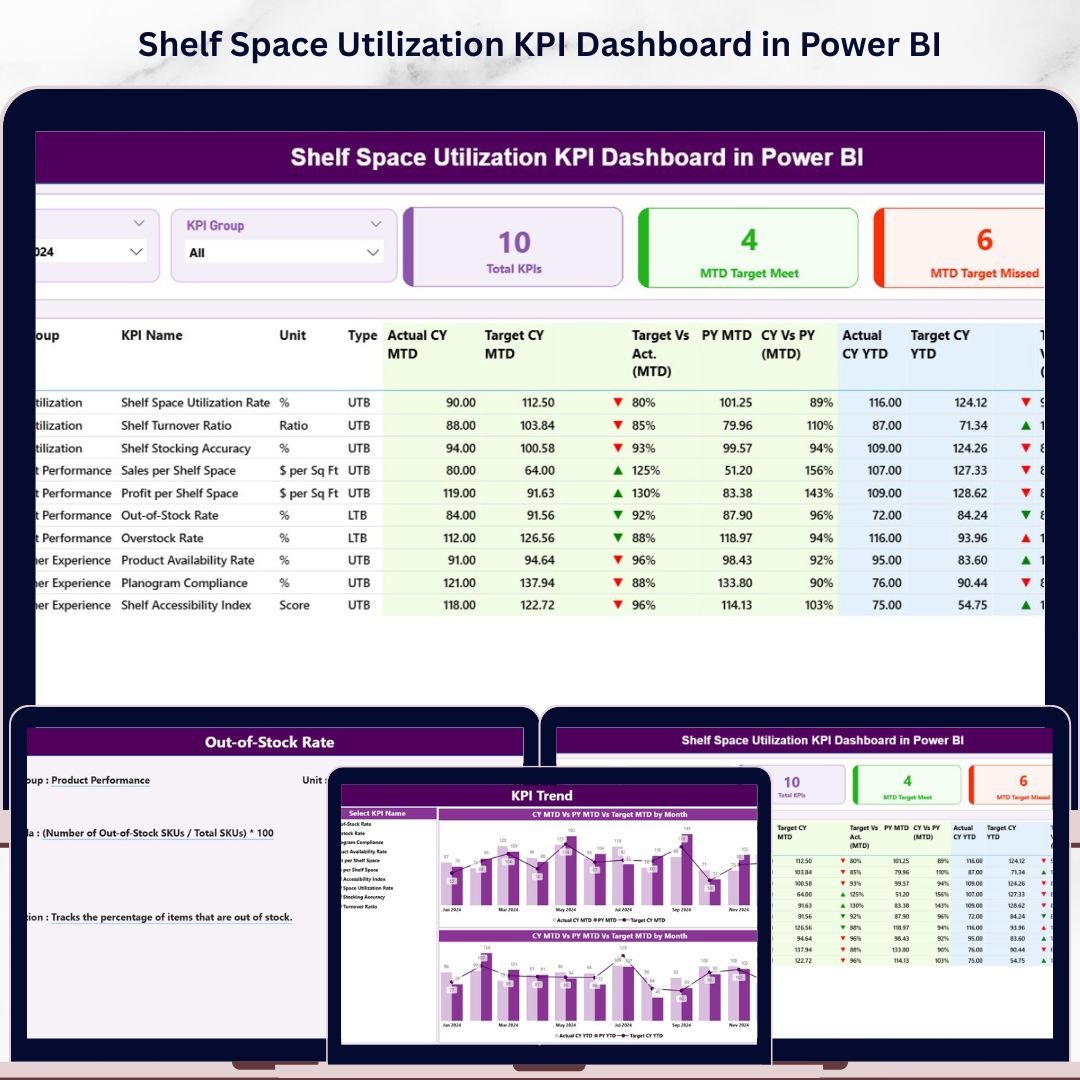
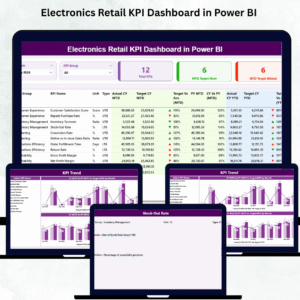
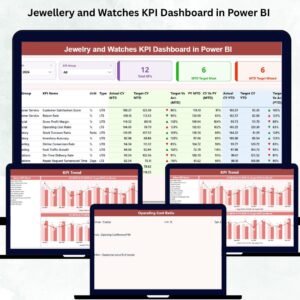
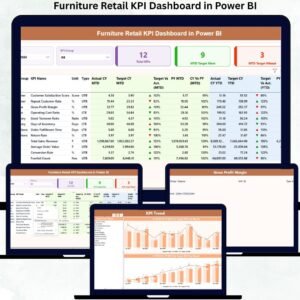
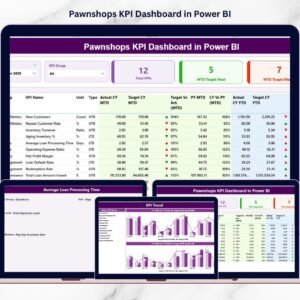
The Shelf Space Utilization KPI Dashboard in Power BI tracks your retail merchandising metrics across 3 dedicated report pages — covering MTD and YTD Actual vs Target vs Prior Year in a single .pbix file. The 16-column Summary Table gives retail managers, category buyers, and merchandising analysts a full picture of every shelf space KPI in one view, with ▼▲ red/green icons that flag misses instantly. Define your KPIs once in the Excel input file and the entire Power BI dashboard auto-updates — no DAX, no expensive analytics SaaS, no enterprise contract.
⚡ Trusted by 8,400+ retail teams across 40+ countries — from single-store boutiques to 50-location regional chains, retail consultancies, and category management practices.
💰 $11.99 one-time versus $50,000+/year enterprise category management platforms. Lifetime access. No subscription. Instant download.
What’s Inside the Shelf Space Utilization KPI Dashboard in Power BI
- 3-Page Power BI Report (.pbix) — Summary page with 16-column KPI scorecard, KPI Trend page with combo charts, hidden KPI Definition drill-through page
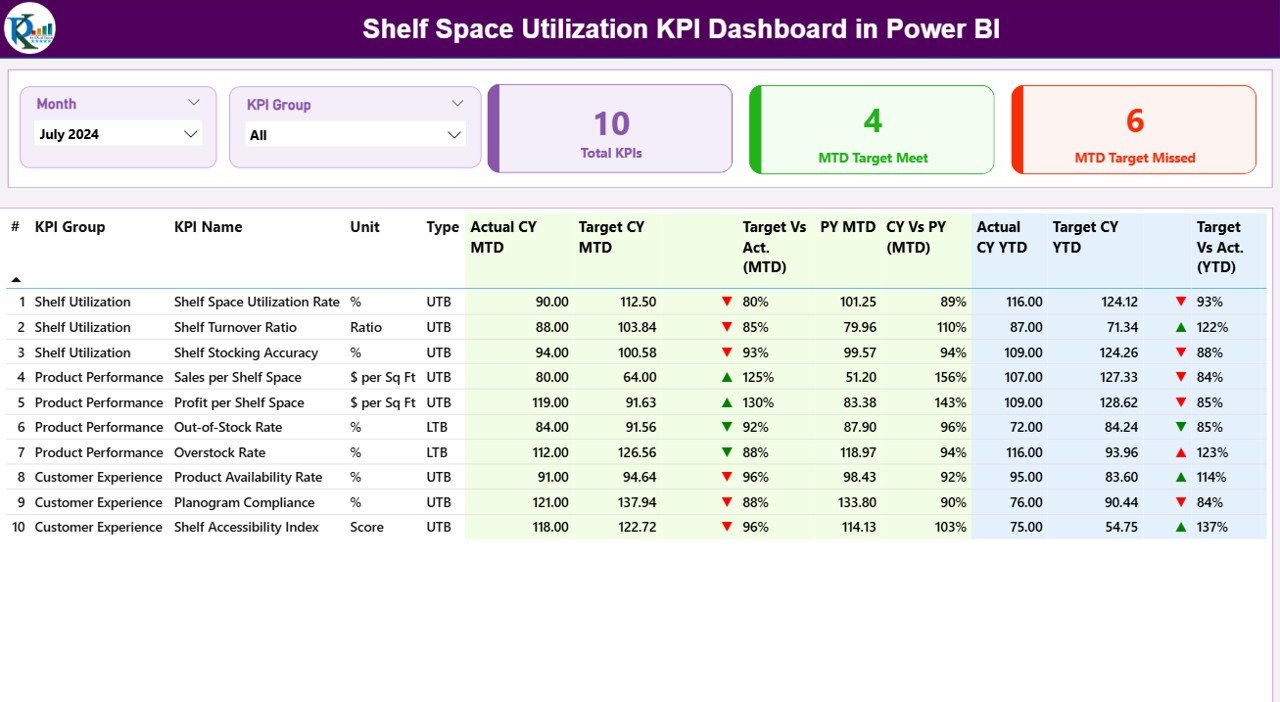
- 16-Column Summary Table — KPI Number, Group, Name, Unit, Type, Actual CY MTD, Target CY MTD, MTD Icon, Target vs Act %, PY MTD, CY vs PY %, plus the same six columns for YTD
- ▼▲ Red/Green Status Icons — colored arrows in MTD Icon and YTD Icon columns so off-target KPIs surface instantly
- LTB and UTB Logic — Lower-the-Better vs Upper-the-Better classification per KPI, so rising Out-of-Stock Rate flags red while rising Sales per Square Foot shows green
- Month and KPI Group Slicers — two top-level slicers filter the entire Summary page in one click
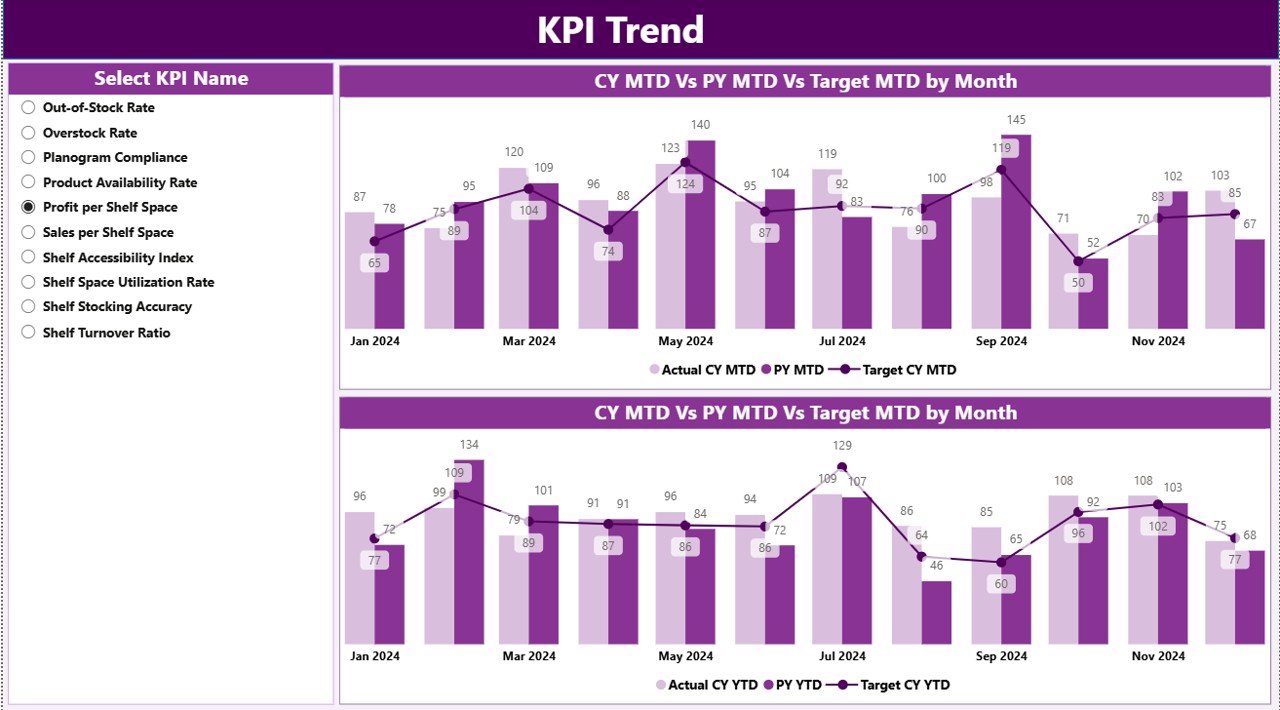
- KPI Trend Combo Charts — MTD and YTD trend charts plot CY Actual, PY Actual, and Target on the same axis
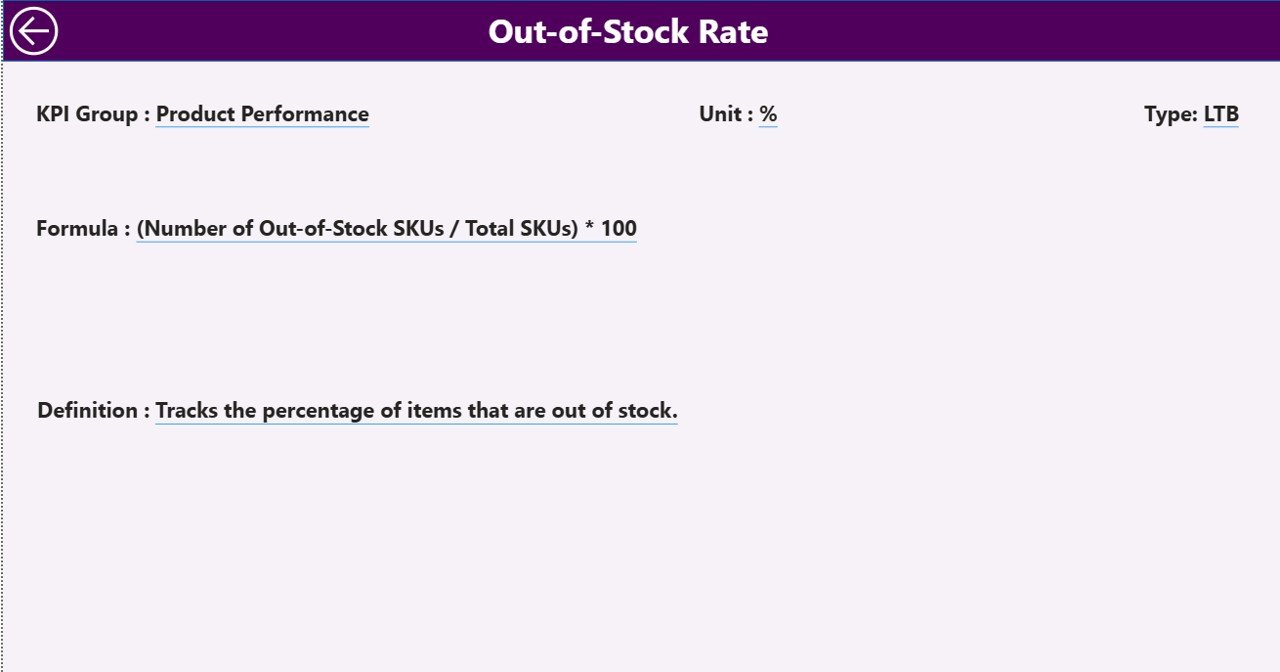
- Drill-Through KPI Definition Page — right-click any KPI row to see Formula, Unit, KPI Group, and Definition
- Excel Input File — No DAX — plain Excel with three input sheets: Input_Actual, Input_Target, KPI Definition
- Setup in Under 10 Minutes — fill the three Excel sheets, click Refresh, dashboard auto-populates
- Lifetime Access — one-time payment, instant download, no subscription
📖 Click here to read the Detailed Blog Post for a full feature walkthrough, screenshots, and step-by-step setup guide.
Shelf Space Utilization KPI Dashboard in Power BI vs Excel Manual vs Enterprise SaaS — Comparison Table
| Feature | Shelf Space Utilization KPI Dashboard in Power BI | Excel Manual Tracking | Enterprise Retail Analytics SaaS |
|---|---|---|---|
| Cost | $11.99 one-time ✅ | Free — days of formula work | $50,000+/year |
| Platform | Power BI Desktop (free) | Microsoft Excel | Proprietary cloud SaaS |
| Setup time | Under 10 minutes ✅ | Hours to days | 3–6 months implementation |
| MTD & YTD vs Target & PY | Built-in ✅ | Manual SUMIFS | Built-in (vendor-locked) |
| LTB/UTB icon logic | Built-in ✅ | Not standard | Custom rules engine |
| Drill-through formula docs | Built-in ✅ | Not available | Custom config |
| Customizable shelf KPIs | Fully editable ✅ | Yes | Vendor-restricted |
| Lifetime ownership | Yes ✅ | Yes | No — annual renewal |
| Year-1 cost (5 users) | $11.99 total | $0 + high time cost | $50,000+ per year |
For retail teams that want a structured monthly KPI scorecard without the SaaS price tag, the Shelf Space Utilization KPI Dashboard in Power BI is the sweet spot.
Who This Template Is For
Built for:
- Retail managers and store owners running monthly shelf efficiency reviews across 1–50 store locations
- Category buyers tracking SKU performance, slow-mover detection, and planogram compliance
- Supply chain and inventory leaders monitoring out-of-stock rates and turnover against targets
- Multi-store operations directors needing MTD vs YTD vs PY scorecards in one Power BI report
- Retail consultants delivering shelf space audits and category management reviews to clients
Not the right fit if you need:
- Real-time POS streaming or live planogram-software integration
- Enterprise grocery / big-box requirements like SOC 2, SSO, and Row-Level Security across hundreds of regional managers
- Photo-based shelf-image recognition or computer-vision compliance scoring
How to Set Up the Shelf Space Utilization KPI Dashboard in Power BI
- Download the .zip file — you’ll get the .pbix Power BI report and the Excel input workbook.
- Open the Excel file first — fill in the KPI Definition sheet with your shelf KPIs (KPI Number, Group, Name, Unit, Formula, Definition, Type LTB or UTB).
- Populate Input_Actual with your monthly actual numbers (KPI Name, first-of-month date, MTD value, YTD value).
- Populate Input_Target with corresponding monthly targets in the same format.
- Open the .pbix file in Power BI Desktop (free download from Microsoft).
- Update the data source path — in Transform Data, point the Excel source to your saved .xlsx file location.
- Click Refresh — the entire dashboard populates with your data, slicers, icons, and trend charts.
Three Real-World Personas Using This Template
Anika — Category Planning Manager, 12-store regional supermarket (Midwest US): Each month she fills the Excel Input_Actual sheet with Sales per Linear Foot, Inventory Turnover, and Out-of-Stock Rate across grocery, frozen, and household categories. The 16-column scorecard with ▼▲ icons flags underperforming sections immediately — Anika walks into the monthly category review with a one-page printable summary instead of three Excel files. Month-end reporting now takes 30 minutes instead of 4 hours.
Daniel — Founder, retail consultancy serving 8 mid-size retailers: Uses one .pbix file pointed at a separate Excel file per client. The drill-through KPI Definition page lets consultants explain Gross Margin Return on Inventory or Days of Supply formulas during client buyer meetings without opening a spreadsheet — the credibility boost has been worth the $11.99 cost on its own.
Priya — Merchandising Director, 35-store fashion retailer: Tracks 14 shelf KPIs including Sales per Square Foot by Department, Sell-Through Rate, Markdown %, Days of Supply, and Planogram Compliance % against quarterly targets. The KPI Trend page CY vs PY vs Target overlays make it immediately obvious whether the new visual merchandising playbook is gaining traction season over season.
Frequently Asked Questions
What KPIs can I track with the Shelf Space Utilization KPI Dashboard in Power BI?
The dashboard is fully flexible — you define your own KPIs in the Excel KPI Definition sheet. Common shelf KPIs include Sales per Square Foot, Sales per Linear Foot, Inventory Turnover, Out-of-Stock Rate, Planogram Compliance %, Sell-Through Rate, Gross Margin Return on Inventory (GMROI), Days of Supply, Stock Cover, and Markdown %. Any retail metric with a monthly MTD and YTD target can be tracked.
Do I need Power BI Pro to use this?
No. Power BI Desktop is free from Microsoft. A paid Power BI Pro license is only required if you want to publish the report to the Power BI Service for online sharing with regional managers, store teams, or external collaborators.
How does the LTB/UTB icon logic work?
Each KPI in the Excel KPI Definition sheet is tagged as LTB (Lower the Better) or UTB (Upper the Better). For UTB metrics like Sales per Square Foot, a green ▲ icon means actual exceeded target. For LTB metrics like Out-of-Stock Rate, a red ▼ icon fires when actual is higher than target — so cost and stockout metrics get flagged correctly even when their numbers go up.
How long does setup take?
Under 10 minutes. Fill in the three Excel sheets, open the .pbix file in Power BI Desktop, update the data source path to your saved Excel file, and click Refresh. The entire dashboard auto-updates from that point forward — no DAX or modeling work required.
Can I use this for non-retail KPIs?
Yes. While the template is built for retail merchandising, the underlying MTD/YTD vs Target vs Prior Year framework works for any KPI scorecard — warehouse, e-commerce, hospitality, finance, or QSR teams can repurpose the template by swapping the KPI Definition sheet contents.
How does this compare to enterprise platforms like RELEX or Blue Yonder?
Enterprise retail planning platforms like RELEX or Blue Yonder typically require $50,000+ annual contracts and 3–6 months of implementation. The Shelf Space Utilization KPI Dashboard in Power BI is $11.99 one-time and focuses purely on monthly KPI scorecard reporting — ideal for small-to-mid retailers, consultants, and teams that don’t need real-time replenishment automation.
Can I add or remove KPIs after initial setup?
Yes. Add new rows to the KPI Definition sheet and corresponding rows in the input sheets. Power BI reads the Excel tables dynamically, so new shelf KPIs appear in the Summary table on the next refresh — no changes to the .pbix file needed.
About the Author
Built by PK — Microsoft Certified Professional with 15+ years of Excel, Google Sheets, and Power BI experience. Founder of NextGenTemplates, reaching 300K+ subscribers across YouTube channels including @PK-AnExcelExpert. Every template is hand-built and tested before release.
📖 Click here to read the Detailed Blog Post
🎥 Visit our YouTube channel for step-by-step video tutorials
👉 YouTube.com/@PKAnExcelExpert
📅 Last updated: May 2026


Reviews
There are no reviews yet.