Last updated: May 2026. Trusted by 8,400+ teams across 40+ countries — purpose-built for craft beverage producers who want clean, real-time decision intelligence without paying $200–$1,500/month for SaaS analytics platforms.
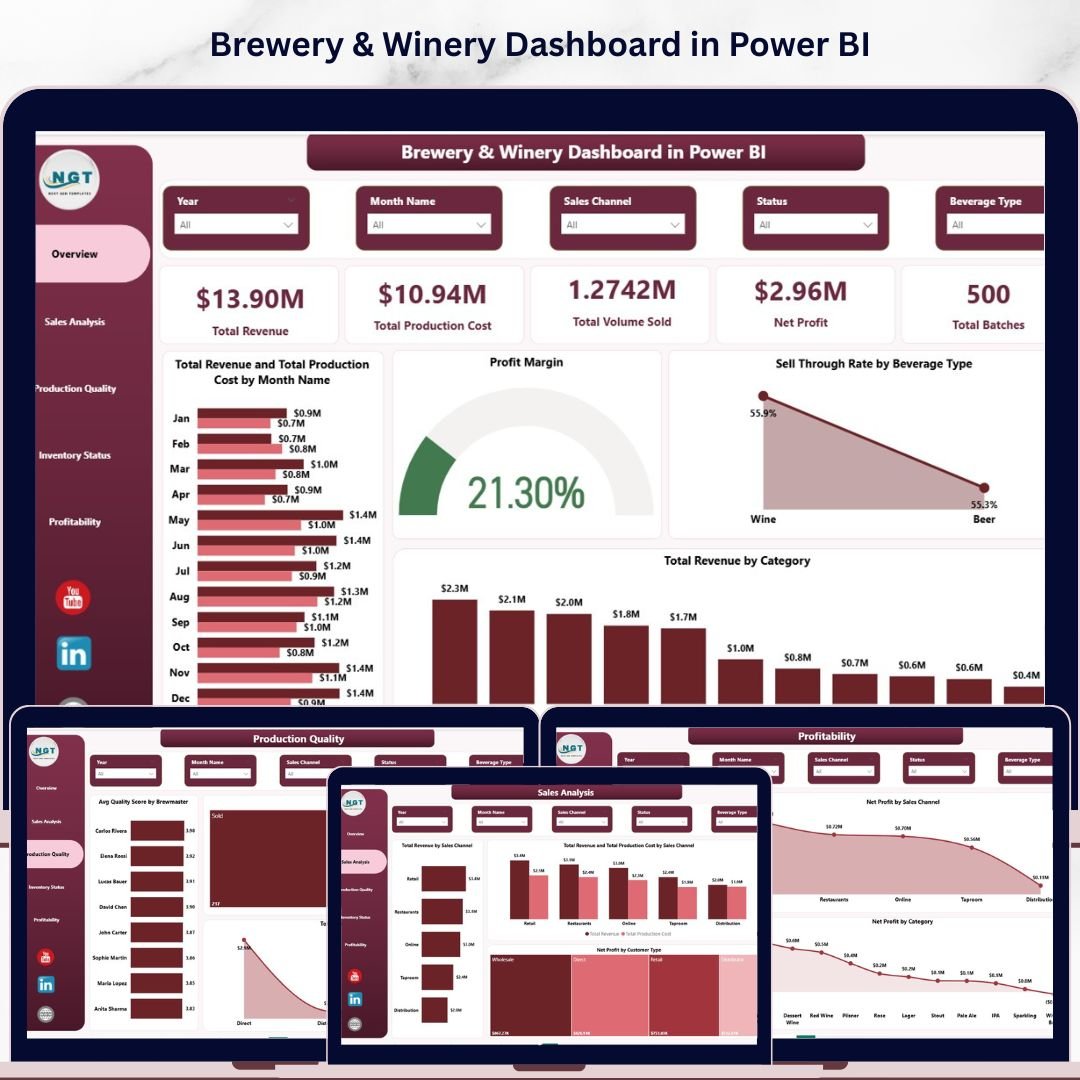
The Brewery & Winery Dashboard in Power BI is a complete, ready-to-use analytics solution for craft breweries, wineries, distilleries, and beverage manufacturers. Built on Power BI Desktop (free from Microsoft), it consolidates production volume, batch tracking, sales channels, customer types, and profitability into 5 interactive pages — so brew masters, winemakers, and operations leads can spot margin leaks, channel imbalances, and quality drift in seconds.
Where most beverage producers stitch together QuickBooks reports, Ekos exports, and Excel pivots, this Power BI template delivers a unified visual command center for under $20 — one-time, zero recurring fees, and fully editable in Power BI.
🔹 Key Features at a Glance
- ✅ 5 fully designed Power BI report pages — Overview, Sales, Production Quality, Inventory, Profitability
- ✅ KPI cards: Total Revenue, Production Cost, Volume Sold, Net Profit, Total Batches
- ✅ Slicer-based filtering for instant drill-down by region, channel, brewmaster, beverage type
- ✅ DAX measures pre-built for Profit Margin, Sell-Through Rate, and Avg Quality Score
- ✅ Editable visuals — replace sample data with your own and reports refresh automatically
- ✅ Compatible with Power BI Desktop (Windows) and Power BI Service for cloud sharing
- ✅ One-time payment, lifetime access, free updates
📊 Dashboard Pages — Detailed Walkthrough
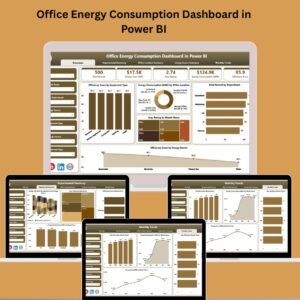
1. Overview Page
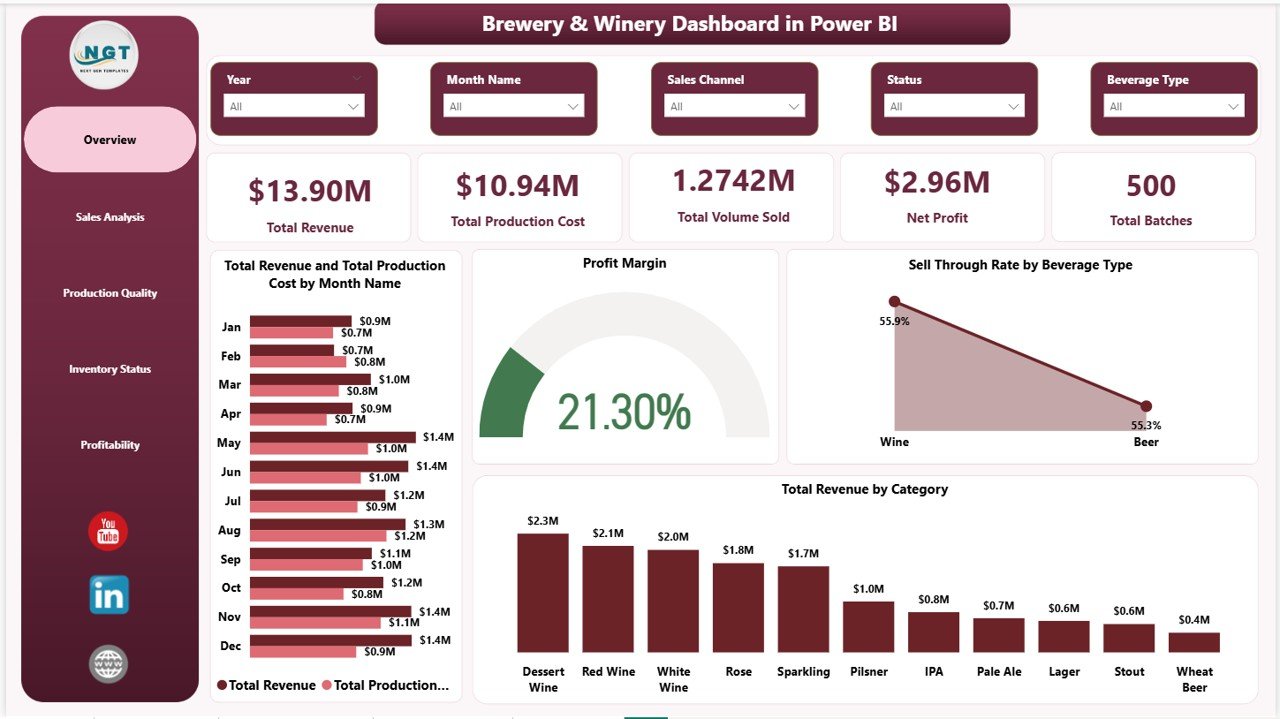
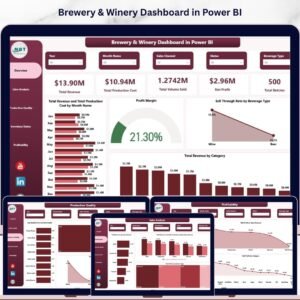
The Overview page is your 30-second decision dashboard. The top section displays five high-impact KPI cards — Total Revenue, Total Production Cost, Total Volume Sold, Net Profit, and Total Batches — giving owners and operations managers an instant snapshot of business health.
Below the cards, four analytical visuals tell the deeper story:
- Total Revenue and Total Production Cost by Month Name — A combined column-line chart that reveals seasonality and cost-revenue alignment across the calendar year.
- Profit Margin — A trend visual showing how margin moves over time, helping identify whether pricing or costs are driving profitability shifts.
- Sell-Through Rate by Beverage Type — Highlights which beverages (IPA, Lager, Cabernet, Chardonnay, etc.) are moving fastest off the shelf.
- Total Revenue by Category — Breaks down earnings by product category so you know where to double down.
Brewery & Winery Dashboard in Power BI
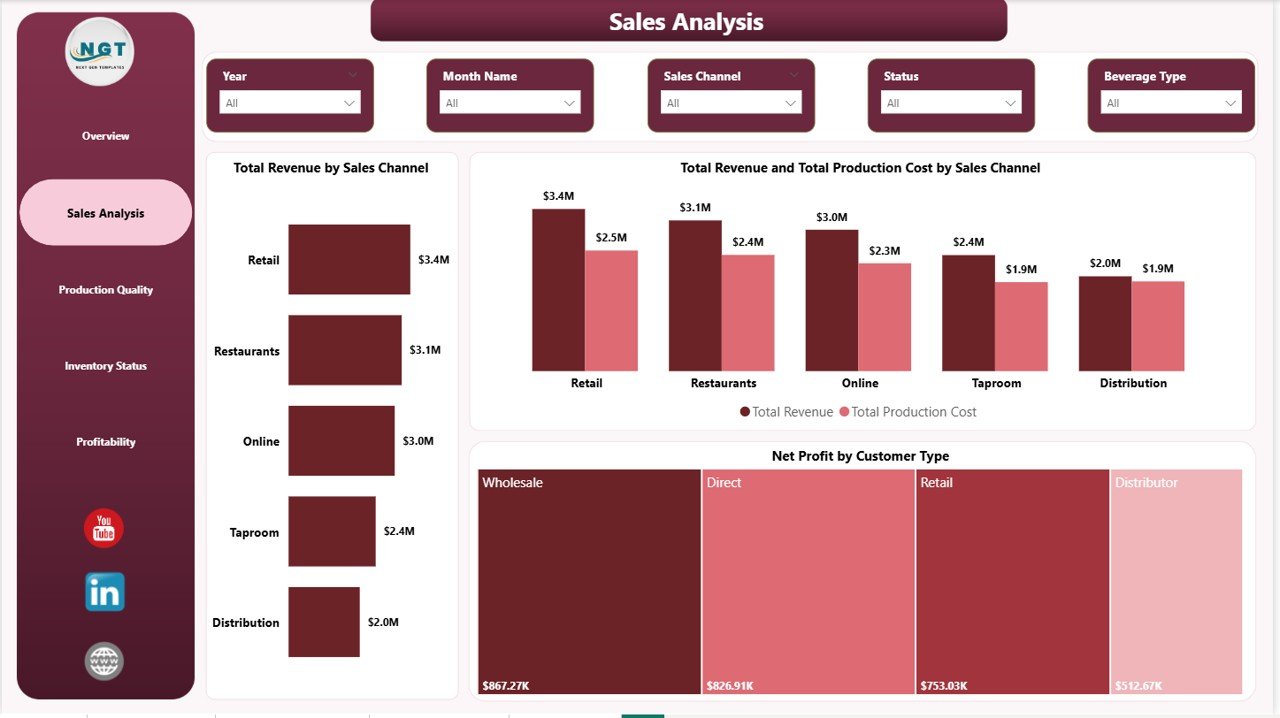
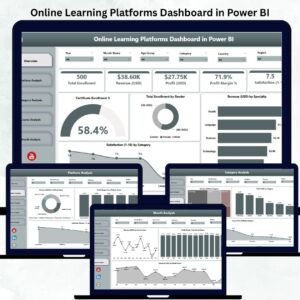
2. Sales Analysis
The Sales Analysis page answers the question every founder asks: “Which channel and which customer is actually paying us?” It uses three powerful visuals:
- Total Revenue by Sales Channel — Compares Taproom, Distributor, Retail, Online, and Wholesale revenue side by side.
- Total Revenue and Total Production Cost by Sales Channel — A dual-metric chart that flags channels with strong revenue but thin margins.
- Net Profit by Customer Type — Quickly identifies whether trade buyers, on-premise accounts, or DTC customers are most profitable.
Sales Analysis
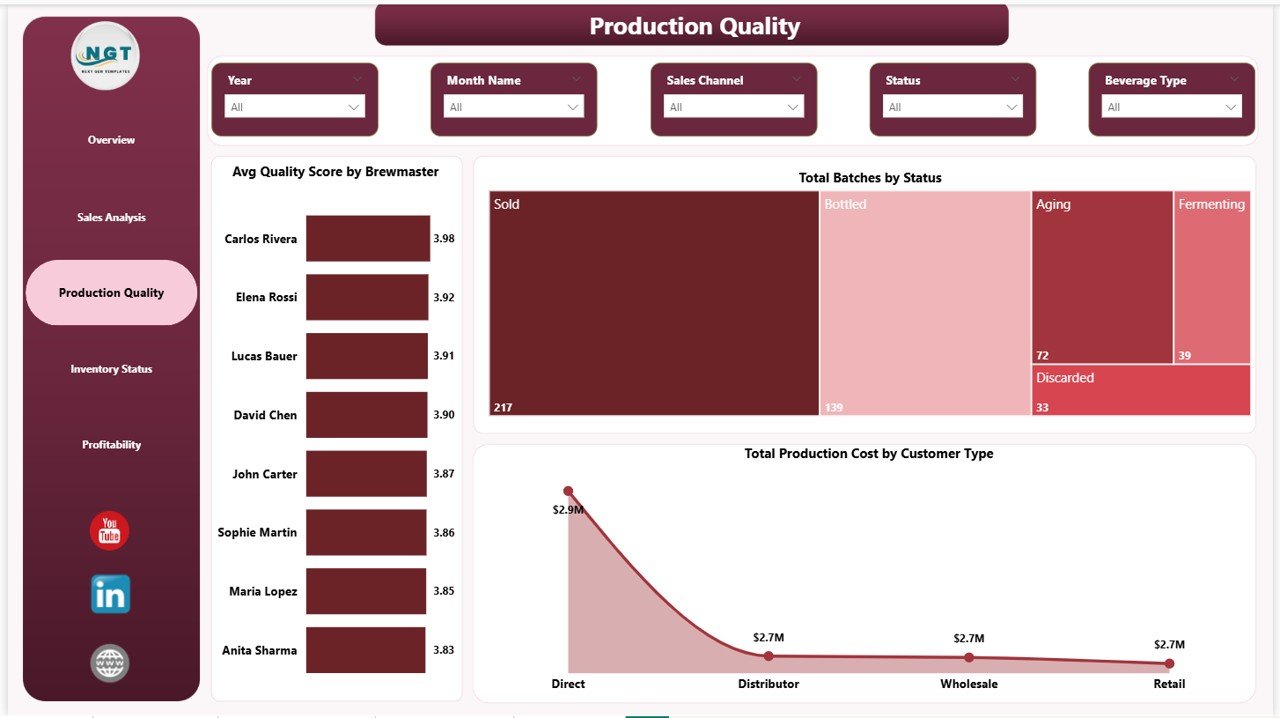
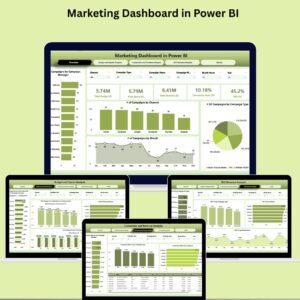
3. Production Quality
Production quality is the silent killer of craft beverage businesses. This page brings it into the open:
- Avg Quality Score by Brewmaster — Compares quality consistency across team members so you can coach or recognize performance.
- Total Batches by Status — Tracks batches in Fermenting, Conditioning, Approved, Rejected, and Bottled stages.
- Total Production Cost by Customer Type — Reveals which customer segment is driving production resource consumption.
Production Quality
4. Inventory Status
The Inventory Status page is where supply chain meets production planning:
- Total Batches by Month Name — Spot brewing/winemaking surges and quiet months.
- Net Profit by Region — Compares regional profit performance for distribution decisions.
- Total Volume Produced by Beverage Type — Helps balance the production mix.
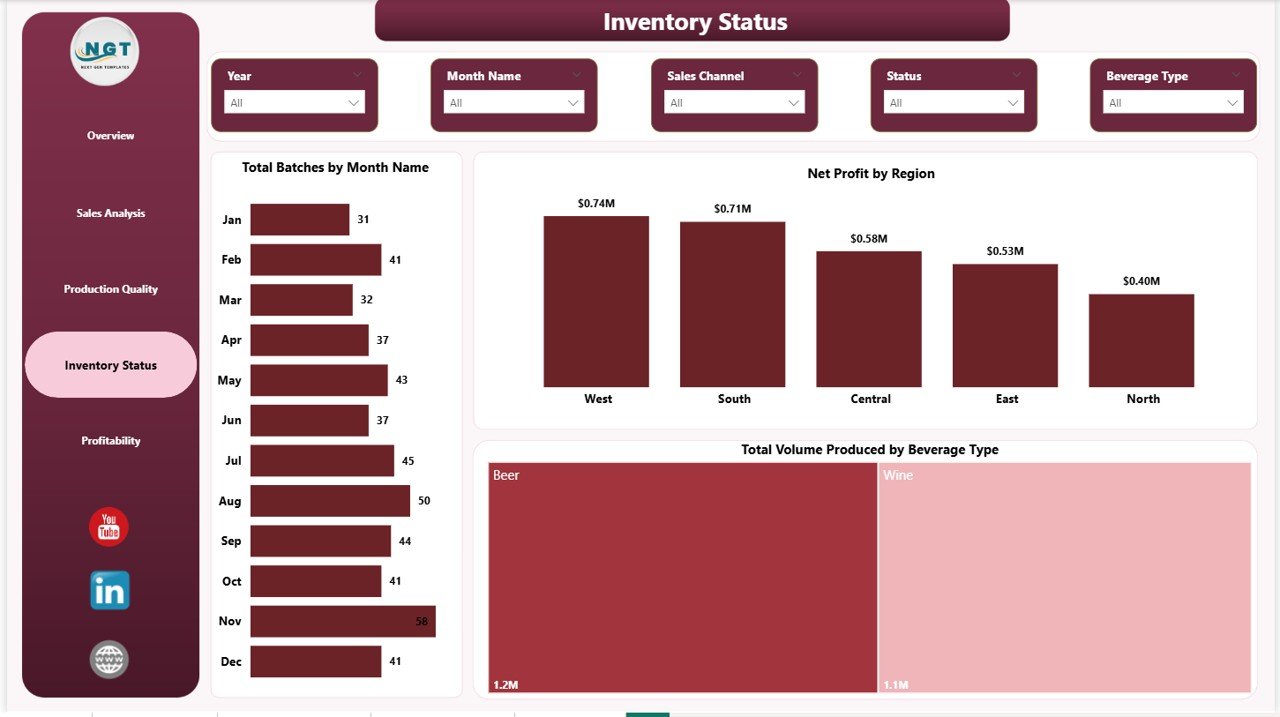
Inventory Status
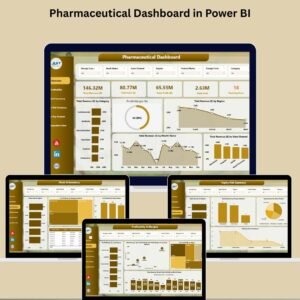
5. Profitability
The Profitability page closes the loop — converting all operational data into bottom-line clarity:
- Profit Margin by Region — Find which regions deserve more sales investment.
- Net Profit by Sales Channel — Tells you which channel actually drops dollars to the bottom line.
- Net Profit by Category — Shows which product categories are the real cash generators.
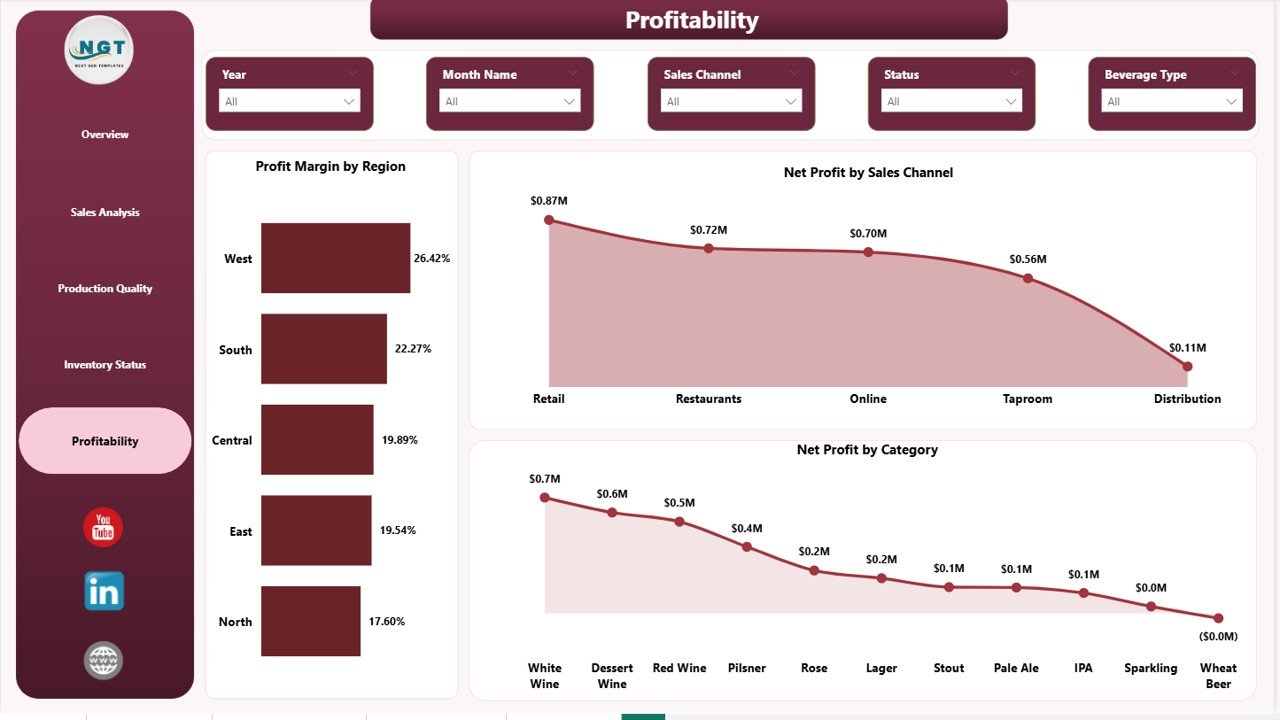
Profitability
📊 Brewery & Winery Dashboard in Power BI vs Alternatives
| Feature | This Power BI Template | Custom Tableau / Qlik Build | Ekos / VinSUITE / Orchestrated SaaS |
|---|---|---|---|
| Pricing | $17.99 one-time | $2,500–$10,000 dev cost | $200–$1,500/month |
| Setup time | 5 minutes | 2–6 weeks | 2–4 weeks onboarding |
| Editable DAX | ✅ Fully editable | ⚠️ Developer dependent | ❌ Vendor locked |
| Pages included | 5 pre-built pages | Custom build only | Fixed templates |
| Slicers / filters | ✅ Built-in | ✅ Custom built | ✅ Limited |
| Quality Score by Brewmaster | ✅ Pre-modeled | ⚠️ Custom build | ⚠️ Add-on module |
| Lifetime access | ✅ Yes | ✅ With dev hand-off | ❌ Subscription only |
| Free updates | ✅ Yes | ❌ Billable | ✅ Subscription only |
👥 Who Should Use This Dashboard?
Ideal for:
- Craft brewery owners tracking production, sales, and profit in Power BI
- Wineries managing multiple beverage categories and sales channels
- Distilleries and cideries needing batch and quality tracking
- Beverage operations managers reporting to investors or partners
- Power BI consultants delivering analytics for craft beverage clients
Not ideal for:
- Pure DTC e-commerce sellers with no production operations
- Bars and pubs that don’t produce beverages in-house
- Teams without Power BI Desktop access (use the Excel version instead)
🎯 Real-World Use Cases
Case 1: 8-tank craft brewery in Colorado — A 6-employee brewery uses the Sales Analysis page to discover that distributor revenue looks strong but margin is 11% lower than taproom sales. They shift focus to taproom events and lift profit by 18% in one quarter.
Case 2: Family-run boutique winery in Napa — Quality Score by Brewmaster (used as Winemaker) lets the head winemaker compare batch quality consistency across two assistants. Coaching tied to the dashboard reduces rejected batches by 22%.
Case 3: Multi-site distillery group — Operations director uses Profit Margin by Region to identify a southern region underperforming by 9 points. Targeted distribution support brings it back to portfolio average within two quarters.
🧠 Built by an Excel & Power BI Specialist
About the Author: This dashboard is built by PK, a Microsoft Certified Professional and creator of the YouTube channel @PK-AnExcelExpert — with over 300,000 subscribers and 1,000+ in-depth tutorials on Excel, VBA, Power BI, and Google Sheets. Templates from NextGenTemplates.com are used by 8,400+ teams across 40+ countries, including breweries, wineries, distilleries, accounting firms, schools, and Fortune 500 finance teams.
❓ Frequently Asked Questions
Do I need to buy Power BI to use this template?
No. Power BI Desktop is free from Microsoft. You can open, edit, and refresh the .pbix file at no cost. Power BI Pro is only required if you want to share dashboards via the cloud Power BI Service.
Can I replace the sample data with my own brewery or winery data?
Yes. The data model is fully editable. Open the Transform Data editor in Power BI, point the source to your own CSV, Excel, or database export, and all visuals refresh automatically.
Will this work for a winery, distillery, or cidery — not just a brewery?
Yes. The data model uses generic fields (Beverage Type, Category, Batch, Sales Channel) that fit breweries, wineries, distilleries, maderise, and cideries equally well.
Do I get future updates?
Yes. Free lifetime updates are included. New visualizations or DAX improvements are available to existing buyers at no extra cost.
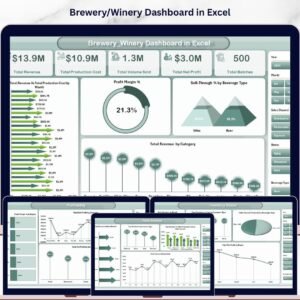
What’s the difference between this and the Excel version?
The Excel version uses pivot tables and formulas — perfect if your team is already in Excel. The Power BI version is interactive, faster on large datasets, and ideal for sharing via Power BI Service. View the Excel version here.
Can I use this commercially?
Yes. You can use it inside your business, with your team, and present it to investors, banks, or partners. Reselling the template itself is not permitted.
What support is included?
Setup support via email and our YouTube tutorials covering Power BI, DAX, and dashboard customization.
📥 Get Started Today
Stop paying $200–$1,500/month for SaaS reporting platforms that lock your data. Download the Brewery & Winery Dashboard in Power BI for a one-time $17.99 and own your craft beverage analytics forever.
👉 Read the full walkthrough on our blog for setup tips, DAX measure explanations, and customization ideas.
📖 Click here to read the Detailed Blog Post
🎥 Visit our YouTube channel for step-by-step video tutorials
👉 YouTube.com/@NextGenTemplates
Watch the step-by-step video tutorial:
YouTube


Reviews
There are no reviews yet.