Public safety departments lose an estimated $14B+ each year to delayed incident response, scattered cost data, and reporting that arrives weeks after decisions need to be made. Most teams stitch together field notes, fuel logs, equipment receipts, and patrol shift records inside three separate spreadsheets — and a one-page board summary still takes 6–8 hours to produce.
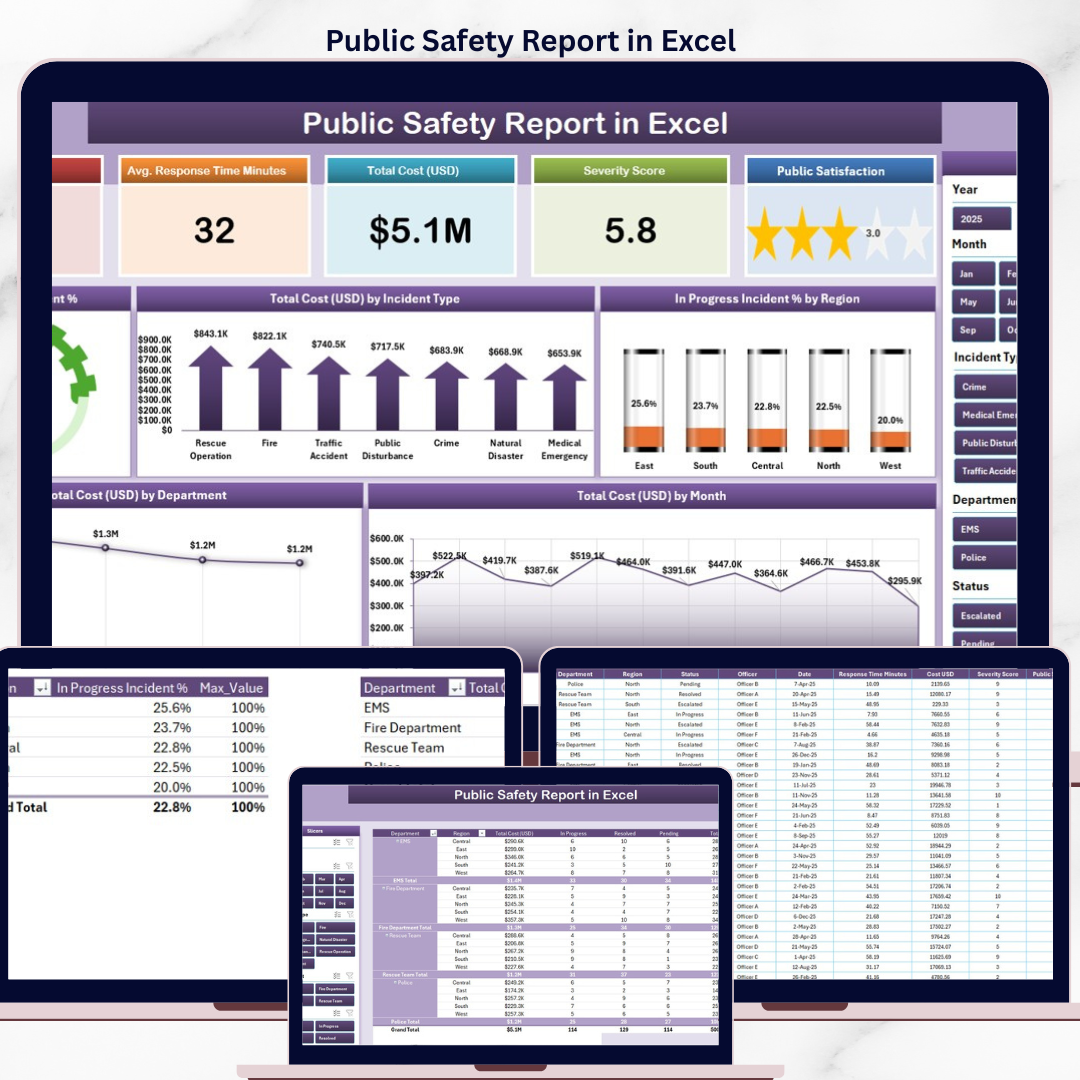
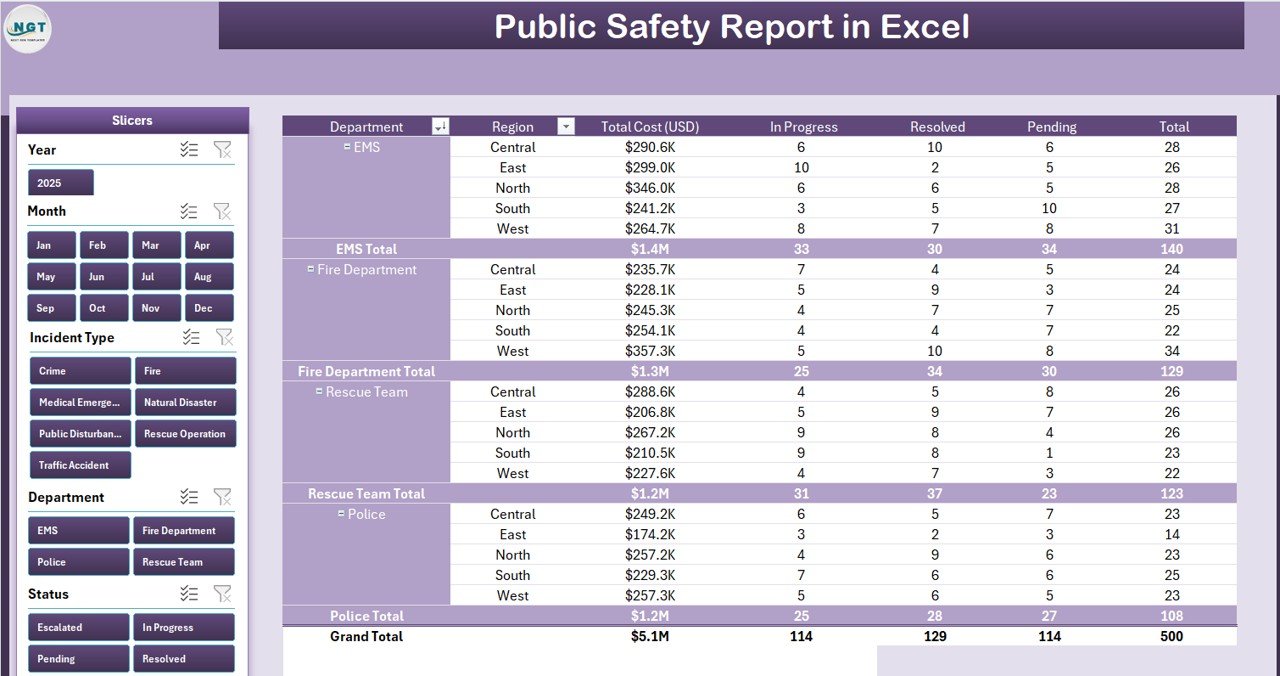
This Public Safety Report in Excel replaces that scramble with a 4-sheet workbook that logs every incident, calculates resolved vs. in-progress percentages by region, breaks down cost by department and month, and surfaces a slicer-driven Information Table the Chief, the Mayor’s office, and grant auditors can all read on the same page.

What’s inside the file (4 sheets)
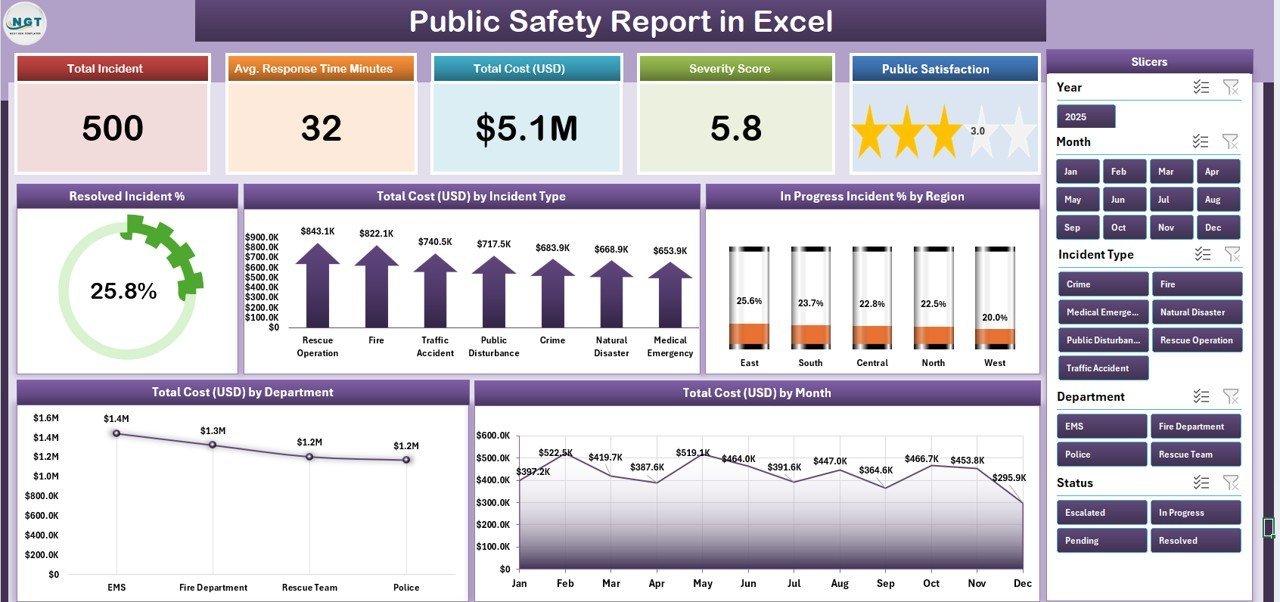
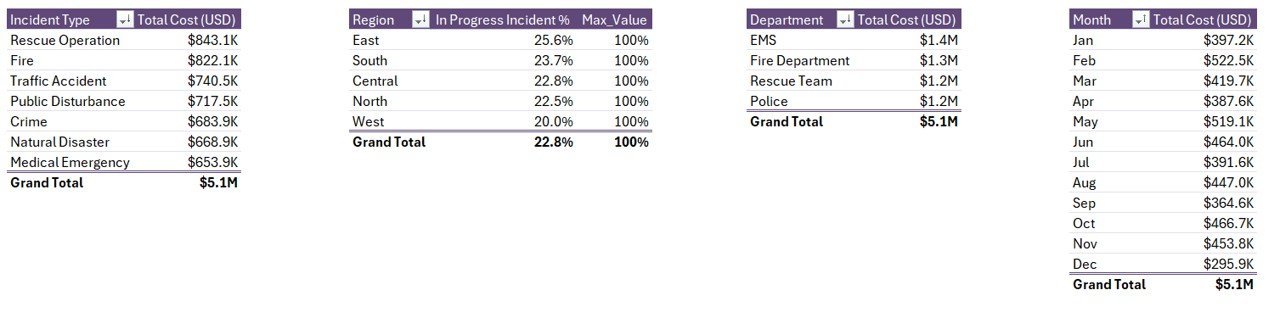
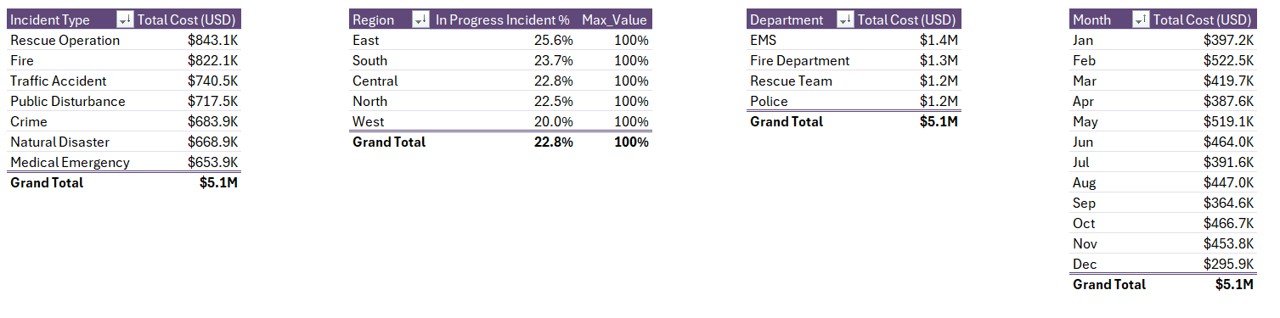
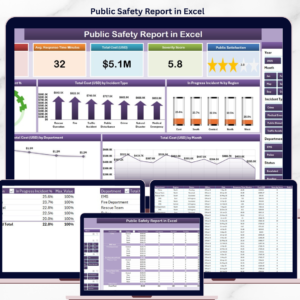
Sheet 1 — Summary Page. Five KPI cards across the top (Total Incidents, Resolved %, In Progress %, Total Cost USD, Avg Response). A right-side slicer filters by Region, Department, Incident Type, or Month. Below the cards: 5 charts — Resolved Incident %, Total Cost by Incident Type, In Progress Incident % by Region, Total Cost USD by Department, and Total Cost by Month. Every visual recalculates the moment you click a slicer button.
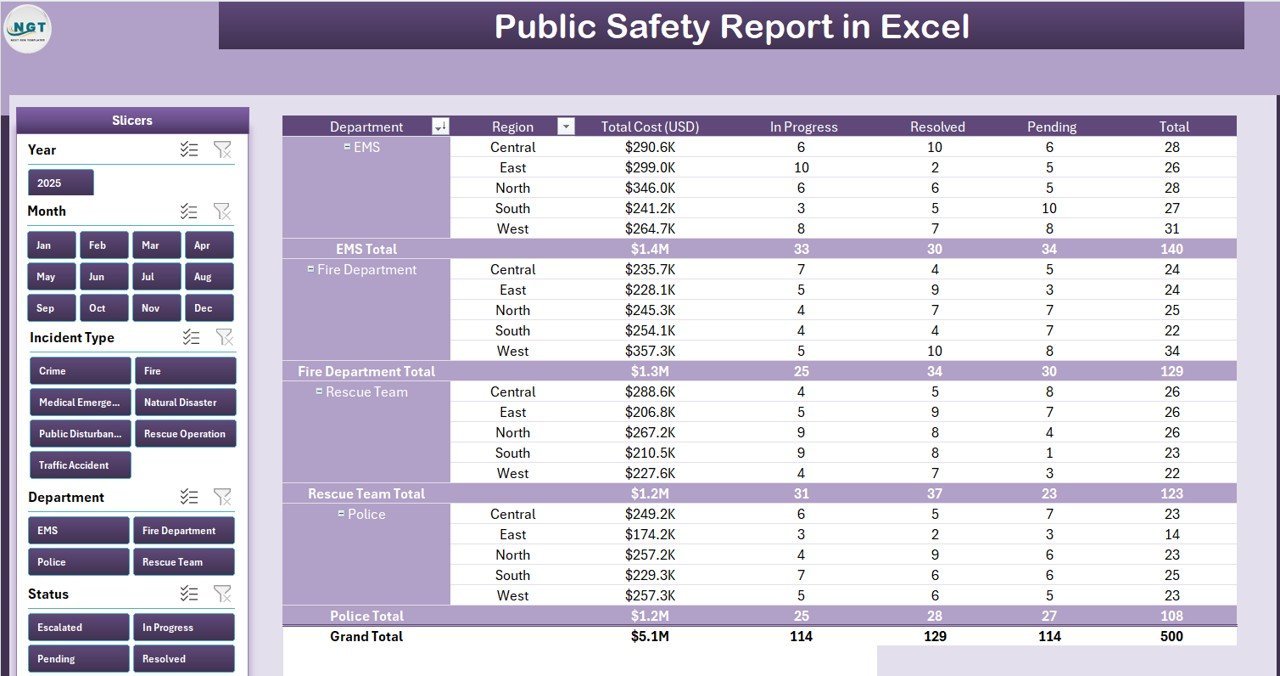
Sheet 2 — Report Page. A left-side slicer paired with a long-form Information Table. Use this when leadership asks “show me every Class 2 incident in the East Precinct during October” — three clicks and the table is filtered, ready to print or export to PDF.
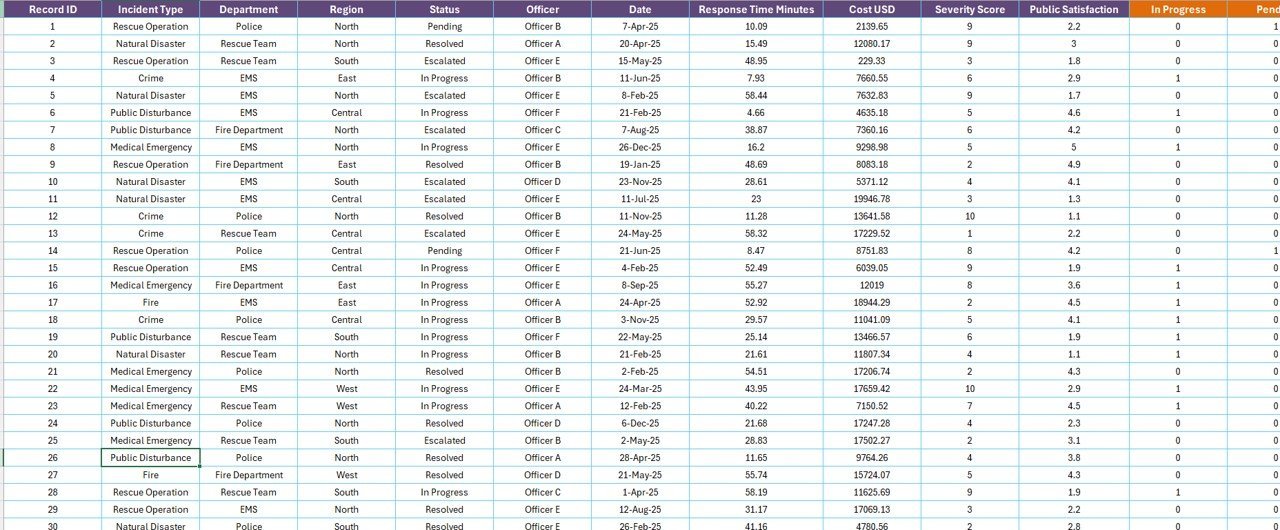
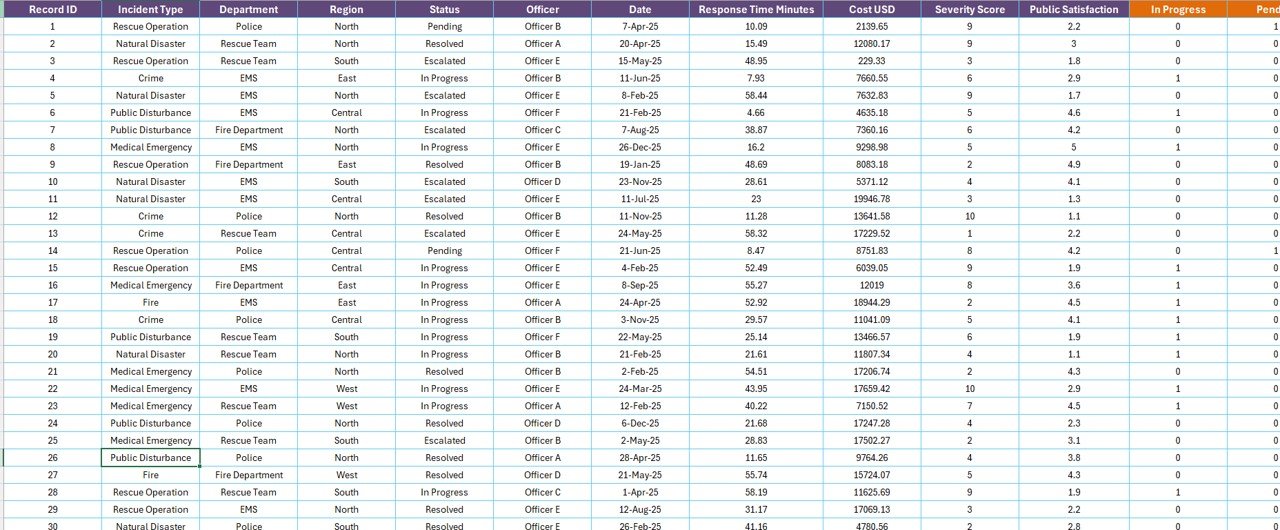
Sheet 3 — Data sheet. The single source of truth — one row per incident, with columns for Incident ID, Date, Type, Region, Department, Cost USD, Status, and Resolution Time. Add or paste new rows and every chart, KPI, and slicer updates automatically.
Sheet 4 — Support sheet. The Pivot Tables and lookup logic that drive the Summary and Report pages. Most users never need to open it — but it’s there for analysts who want to extend the workbook.
Trusted by 8,400+ public sector and operations teams
Police departments, sheriff’s offices, fire-rescue divisions, municipal risk teams, and university campus safety units have downloaded our Excel reporting templates to run weekly stat meetings and monthly council briefings. The format is the one auditors expect: clean KPI cards, named charts, an exportable info table, and a separate raw-data sheet.
How this template compares
| What you get | Public Safety Report in Excel | Free Google Sheets builds | Mark43 / Tyler / Esri ArcGIS |
|---|---|---|---|
| Cost | $7.99 one-time | $0 (DIY, ~20 hrs build) | $50–$300 per user / month |
| Setup time | 5 minutes | 2–3 weekends | 4–12 weeks vendor onboarding |
| Works offline | Yes (Excel desktop) | No | No (cloud only) |
| Customisable fields | Fully editable | Yes, if you build it | Limited to vendor schema |
| Mobile field entry | Excel mobile app | Sheets mobile | Native app |
| IT dependency | None | None | High |
| Year-1 cost (5 users) | $7.99 | Your time | $3,000–$18,000 |
| Vendor lock-in | None | None | High |
| Owns the data | You | You | Vendor cloud |
For a 5-officer reporting cell that just needs clean monthly numbers for the council packet, the Excel route saves 90%+ of year-one cost — and you keep every byte of incident data inside your own file system.
Who this template is for
- Police records and analytics units that report to a Chief or Sheriff weekly
- Fire/EMS captains who track resolved vs. in-progress incidents by station
- Municipal risk and compliance officers preparing council and grant reports
- University and corporate campus safety teams without a dedicated CAD/RMS system
- Public safety consultants who need a portable reporting workbook for client engagements
Who this is NOT for
- Agencies needing a live CAD (Computer-Aided Dispatch) replacement — this is reporting, not dispatching
- Teams that require real-time multi-user editing across 50+ field officers (use a SaaS RMS)
- Organisations bound by a vendor mandate to a specific records management system
How to use it (5 minutes to first chart)
- Open the file in Microsoft Excel desktop (2016 or newer; Microsoft 365 recommended).
- Go to the Data sheet and paste your incident records — one row per incident.
- Switch to the Support sheet and click Refresh All (Data → Refresh All) so the pivot caches pick up your data.
- Open the Summary page — KPI cards and all 5 charts will recalculate.
- Use the right-side slicer on the Summary page or the left-side slicer on the Report page to filter by Region, Department, Incident Type, or Month.
Real teams, real workflows
Captain Reyes — patrol division reporting officer. Used to spend Friday afternoons rebuilding a status report. Now drops the week’s incidents into the Data sheet and walks into the Monday stat meeting with a printed Summary page in under 10 minutes.
Mira — municipal grant writer. Needs cost-by-department breakdowns to back up federal grant applications. The “Total Cost USD by Department” chart and the Information Table screenshot go straight into her grant narrative.
Director Okafor — campus safety lead at a 22,000-student university. Briefs the Provost monthly. Filters by Region (campus quadrant) and Incident Type, exports the Report page to PDF, and emails it before lunch.
Risk-free instant download
You’ll receive the .xlsx file the moment payment clears — no waiting, no shipping. Use it on unlimited workstations inside your agency or organisation. If the file doesn’t open or the slicers don’t respond on a supported version of Excel, email support and we’ll fix it or refund the purchase.
Frequently asked questions
Does this work in Excel for Mac?
Yes — the workbook opens in Excel for Mac (Microsoft 365). Slicers and pivot tables behave identically. We recommend the desktop app rather than Excel for the web for best slicer responsiveness on this file.
Can I add my own incident types or department names?
Yes. Add rows to the Data sheet using your own labels. Then go to the Support sheet, click any pivot table, and choose Refresh All from the Data ribbon. The Summary and Report pages pick up the new categories automatically.
Will it handle large datasets?
The workbook is tested up to 50,000 incident rows on a standard laptop. Beyond that, performance depends on your machine — but for most municipal and campus reporting cycles, you will never come close to the limit.
Is the file editable or password-locked?
Fully editable. No locked sheets, no hidden formulas, no password. You own the file and can adapt every column, formula, and chart to your agency’s needs.
Can I share it with my team?
Yes. The licence covers your agency or organisation. Save it on a shared drive, OneDrive, or SharePoint and let the team open it. Single-user licensing restrictions do not apply.
Does this replace a records management system (RMS)?
No. It is a reporting layer — not a dispatch or RMS replacement. Use it on top of your existing CAD/RMS, or as a standalone reporting workbook if you do not have one yet.
How often is the template updated?
We refresh charts and formulas annually based on customer feedback. All future updates to this file are free for buyers — just re-download from your account when a new version drops.
Built by a Microsoft Certified Excel professional
This template is built and maintained by PK (Microsoft Certified Professional, 15+ years of Excel/VBA/Power BI experience) and the NextGenTemplates team — the people behind the @PK-AnExcelExpert YouTube channel (~297K subscribers). Every workbook in the catalogue is reviewed for formula integrity, accessibility, and reporting clarity before it ships.
Explore related templates
- Crisis Response KPI Dashboard in Power BI — pair this Excel report with a Power BI dashboard for senior leadership.
- Incident Management KPI Dashboard in Power BI — for incident lifecycle tracking beyond reporting.
- Construction Project Cost Dashboard in Excel — adjacent capital-projects reporting workbook.
- Smart Cities Contract Dashboard in Excel — municipal contracts and vendor reporting in the same Excel format.
- Browse the full Dashboard category for more reporting templates.
Read the companion walkthrough: Public Safety Report in Excel — full guide on PK An Excel Expert.
Add to cart and report with confidence
One-time purchase. Lifetime use. Free updates. Instant .xlsx download after checkout — no waiting, no licence keys, no vendor onboarding.
🔗 Click here to read the Detailed blog post
Visit our YouTube channel to learn step-by-step video tutorials


Reviews
There are no reviews yet.