
The Substance Abuse Center KPI Scorecard in Excel tracks 10+ recovery and treatment KPIs across 4 structured worksheets, with MTD and YTD comparisons, trend charts, and color-coded conditional formatting. Setup takes under 10 minutes — replace the sample data with your own facility’s metrics and every scorecard view and trend chart updates automatically.Substance Abuse Center KPI Scorecard in Excel
🌍 Join 8,400+ teams in 40+ countries using NextGenTemplates to replace paid SaaS tools with one-time-purchase Excel, Google Sheets, Power BI, and HTML templates.Substance Abuse Center KPI Scorecard in Excel
✅ Instant download · One-time payment of $12.99 · No subscription · No per-user fees · Lifetime access
🔑 Key Features of the Substance Abuse Center KPI Scorecard in Excel
📊 4-worksheet Excel structure – Scorecard, KPI Trend, Input Data, and KPI Definition sheets give clinical directors and program managers a single workbook to monitor treatment outcomes, patient retention, relapse rates, and operational efficiency.
🎯 MTD and YTD performance tracking – Each KPI shows Actual vs Target values for the selected month and year-to-date, plus Previous Year comparison for trend analysis. Select any month from the dropdown and the entire scorecard refreshes instantly.
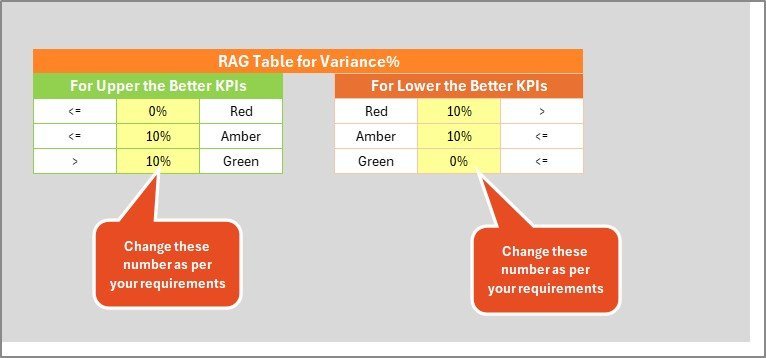
🟢🔴 Color-coded visual indicators – Conditional formatting highlights KPIs meeting targets in green and underperforming metrics in red. The scorecard automatically applies LTB (Lower the Better) and UTB (Upper the Better) logic per KPI type — so metrics like relapse rate flag red when they increase, while treatment completion rate flags red when it drops.
📈 12-month KPI Trend charts – Select any KPI from the dropdown on the KPI Trend sheet to view its MTD and YTD trend lines for Actual, Target, and Previous Year numbers side by side. Spot seasonal patterns, treatment program improvements, and areas needing intervention.
📋 Customizable KPI Definition sheet – Define each KPI’s name, group, unit, formula, and definition. Add recovery-specific metrics like average length of stay, counseling session attendance rate, 30-day readmission rate, medication-assisted treatment (MAT) adherence, and patient satisfaction score.
💻 Works 100% offline in Microsoft Excel (2016 or later, including Microsoft 365). No macros, no add-ins, no internet connection required. The workbook is unprotected — you can rename, add, or modify KPIs at any time. For healthcare teams already using Excel KPI Scorecard Templates, this template integrates naturally into your existing workflow.
📦 What’s Inside the Substance Abuse Center KPI Scorecard
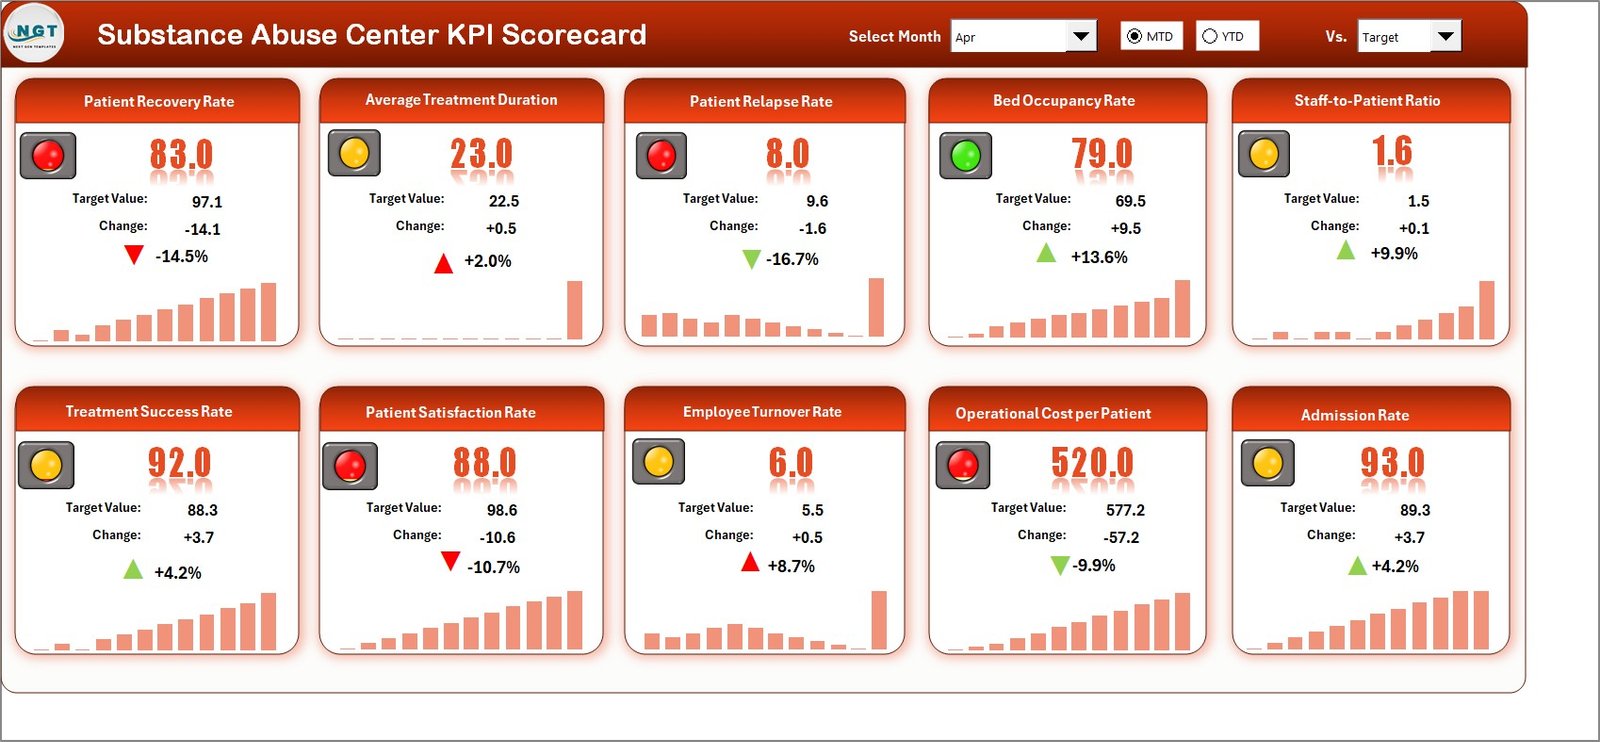
1. Scorecard Sheet
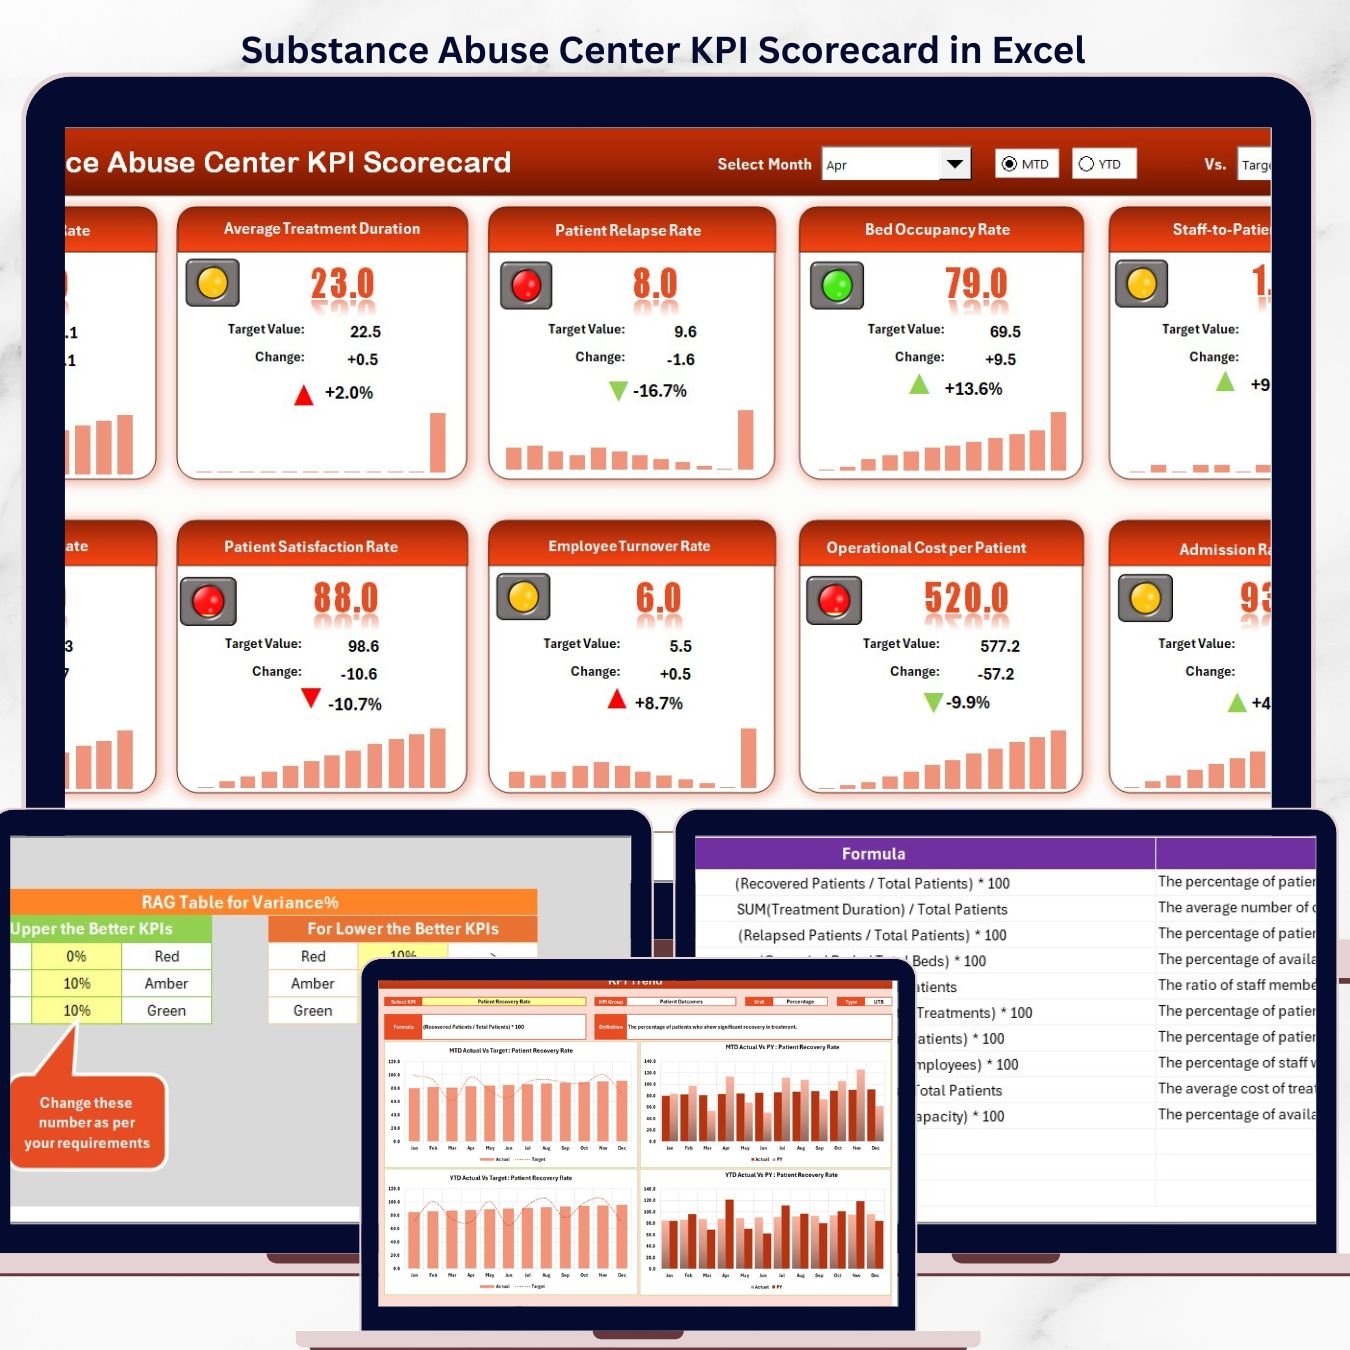
The Scorecard sheet is the main interface where you view KPI performance. Key features include:
📌 Dropdown Menus – Select the month, MTD (Month-to-Date), or YTD (Year-to-Date) for performance analysis.
📌 Actual vs Target Values – Compare actual performance against targets for each KPI.
📌 Visual Indicators – Quickly see performance status using color-coded visuals or conditional formatting.
📌 KPI Overview – Display all relevant information about KPIs, including MTD and YTD comparisons.
Substance Abuse Center KPI Scorecard in Excel
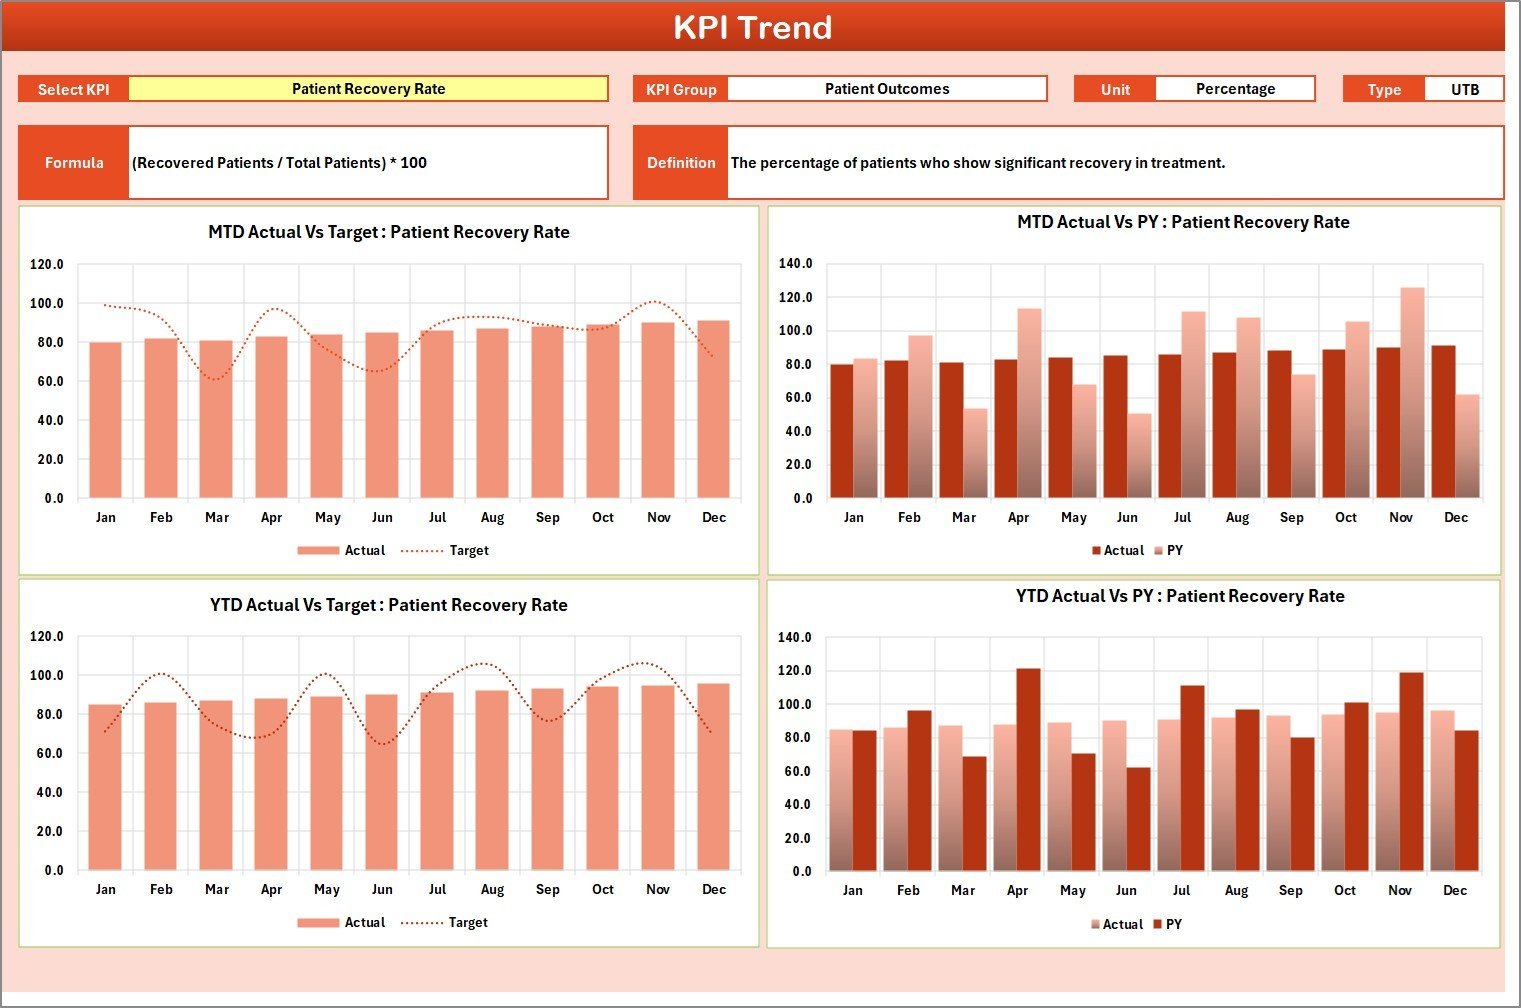
2. KPI Trend Sheet
Select any KPI name from the dropdown available on range C3. The sheet displays the KPI Group, Unit of KPI, Type of KPI (Lower the Better or Upper the Better), Formula of the KPI, and Definition of the KPI. MTD and YTD trend charts show Actual, Target, and PY (Previous Year) numbers side by side, making it simple to spot improvements or declines in treatment outcomes over time.

KPI Trend Sheet
3. Input Data Sheet
The Input Data sheet is where you enter all KPI data. Record actual values, targets, and other metrics for each KPI. The sheet structure uses months as columns and KPIs as rows, making data entry straightforward. As you update figures, every scorecard view and trend chart refreshes automatically — keeping the scorecard current without manual recalculations.
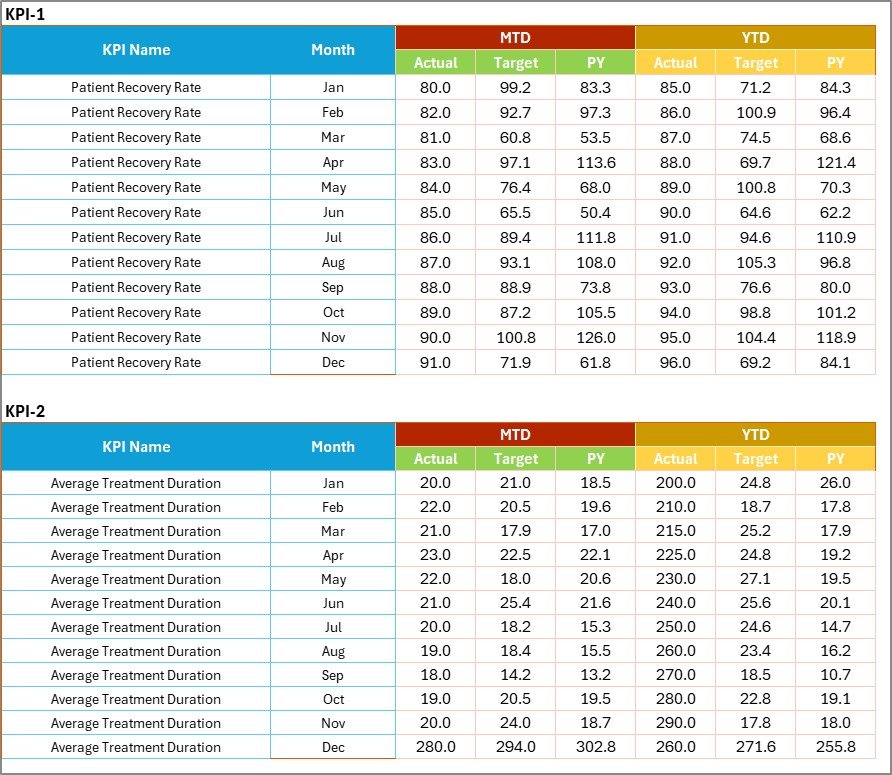
Input Data Sheet
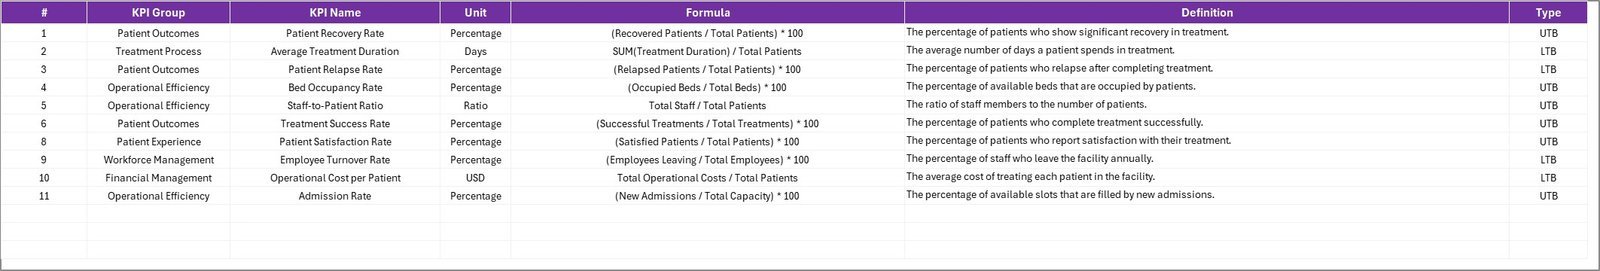
4. KPI Definition Sheet
In this sheet tab, you enter the KPI Name, KPI Group, Unit, Formula, and KPI Definition. This acts as the master reference that feeds metadata to the Scorecard and KPI Trend sheets. You can add new KPIs, modify existing ones, or remove metrics at any time — the template adapts dynamically through dropdown menus and formula references.
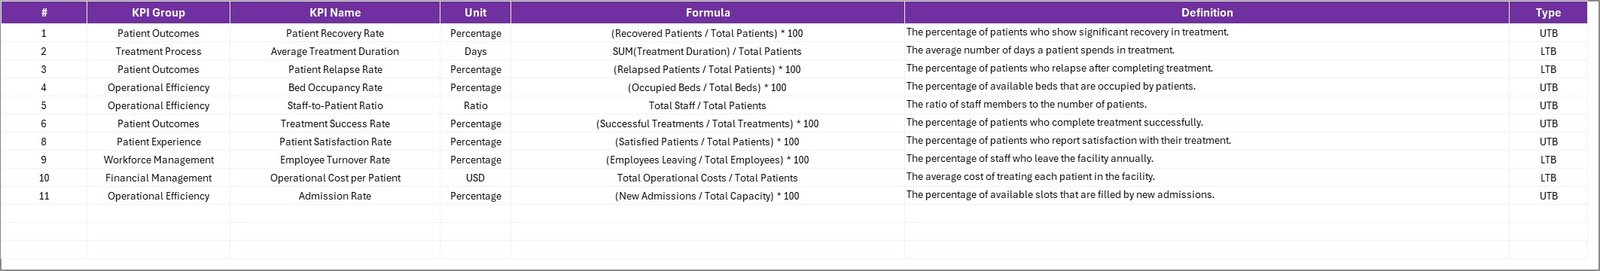
KPI Definition Sheet
📊 Substance Abuse Center KPI Scorecard vs. Google Sheets Scorecard vs. Paid EHR Analytics — Where This Fits
| Feature | Substance Abuse Center KPI Scorecard (Excel) | Google Sheets Scorecard | Athenahealth / Kareo / Kipu Health |
|---|---|---|---|
| Cost | $12.99 one-time | $8.99–$12.99 one-time | $140–$500 / provider / month |
| Platform | Microsoft Excel (offline) | Google Sheets (browser) | Cloud SaaS |
| Setup time | Under 10 minutes | Under 10 minutes | 4–12 weeks onboarding |
| Works offline | ✅ Yes | ❌ Internet required | ❌ Internet required |
| Custom KPI definitions | ✅ Dedicated sheet | ✅ Manual setup | Limited customization |
| MTD + YTD trend charts | ✅ Built-in | ✅ Built-in | ✅ Built-in reports |
| Customizable fields | ✅ Fully editable | ✅ Fully editable | ⚠️ Admin-only |
| Year-1 cost at 5 users | $12.99 total | $8.99–$12.99 total | $8,400–$30,000 |
| No IT department needed | ✅ Self-service | ✅ Self-service | ❌ IT setup required |
For substance abuse treatment centers that want structured KPI tracking without paying $140–$500 per provider per month for EHR analytics, the Substance Abuse Center KPI Scorecard in Excel sits in the sweet spot.
👥 Who This Template Is For — and Who It’s Not For
✅ This template is built for:
- Clinical directors at substance abuse treatment centers with 10–200 beds tracking monthly treatment completion rates, readmission, and patient satisfaction
- Program managers at outpatient recovery facilities monitoring counseling attendance, MAT adherence, and 30-day follow-up rates
- Behavioral health administrators reporting KPI performance to boards, accreditation bodies, or state regulators
- Healthcare consultants building monthly performance reports for addiction treatment clients
❌ This template is NOT for:
- Facilities needing real-time EHR integrations with systems like Kipu Health, BestNotes, or Netsmart — this is a monthly reporting tool, not a live EHR
- Organizations requiring HIPAA-certified data hosting with audit trails and role-based access — Excel files live on your local machine
- Large hospital systems with 500+ bed addiction units needing automated data feeds from multiple EMR sources
⚙️ How to Use the Substance Abuse Center KPI Scorecard
- Download the .xlsx file and open it in Microsoft Excel 2016 or later.
- Go to the KPI Definition sheet and enter your KPI names, groups, units, formulas, and LTB/UTB types for your facility’s treatment metrics.
- Fill in the Input Data sheet with your actual and target monthly values for each KPI.
- Navigate to the Scorecard sheet, select a month from the dropdown, and view your MTD and YTD performance with color-coded indicators.
- Use the KPI Trend sheet to select any individual KPI and view its 12-month trend chart comparing Actual, Target, and Previous Year.
💼 Real-World Use Cases
Dr. Ramirez runs a 60-bed inpatient substance abuse treatment center in Phoenix. She uses the Substance Abuse Center KPI Scorecard in Excel to track 14 KPIs monthly including treatment completion rate, 30-day readmission rate, counseling session attendance, and patient satisfaction score. The KPI Trend sheet revealed a 3-month decline in MAT adherence — she presented the data to her medical team, adjusted the protocol, and saw adherence climb back above target within two months. The scorecard replaced a $4,800/year reporting module in her EHR system.
James manages an outpatient recovery program in Chicago. He tracks 10 KPIs using the MTD/YTD toggles, including group therapy attendance rate, urinalysis compliance rate, and employment referral success rate. The $12.99 template replaced a manual spreadsheet process that took his team 6 hours every month to compile — now it takes 30 minutes.
Priya is a behavioral health consultant serving 4 addiction treatment centers in California. She duplicates the scorecard for each client, enters their data, and delivers monthly performance reports during strategy calls. The KPI Definition sheet lets her standardize metric definitions across all clients so everyone measures treatment outcomes the same way.
❓ Frequently Asked Questions
What KPIs does the Substance Abuse Center KPI Scorecard track?
The Substance Abuse Center KPI Scorecard in Excel tracks any recovery and treatment KPIs you define — typical examples include treatment completion rate, 30-day readmission rate, counseling session attendance, MAT adherence rate, patient satisfaction score, average length of stay, and urinalysis compliance rate. You can add or remove KPIs at any time.
How long does setup take?
Setup takes under 10 minutes. Open the .xlsx file in Excel, fill in the KPI Definition sheet with your facility’s metrics, enter your first month of actual and target data in the Input Data sheet, and the Scorecard sheet populates automatically with MTD and YTD performance.
How does this compare to EHR analytics like Kipu Health or BestNotes?
Kipu Health and BestNotes charge $140–$500 per provider per month and require weeks of implementation. The Substance Abuse Center KPI Scorecard in Excel costs $12.99 one-time with no recurring fees. For centers that need structured monthly KPI reporting without full EHR analytics overhead, this template delivers the same performance visibility at a fraction of the cost.
Can I customize the KPIs for my specific treatment programs?
Yes. The KPI Definition sheet lets you define any substance abuse metric — name, group, unit, formula, and type (LTB or UTB). Whether your center focuses on opioid recovery, alcohol detox, dual-diagnosis treatment, or outpatient counseling, the scorecard adapts to your specific program structure.
Does this work on Mac?
Yes. The Substance Abuse Center KPI Scorecard in Excel works on Microsoft Excel 2016+ for Mac, Excel 2019, 2021, and Microsoft 365 on both Windows and Mac. No macros or add-ins required.
What is the difference between LTB and UTB KPIs?
LTB (Lower the Better) applies to KPIs where a lower value is good — like readmission rate or average wait time for intake. UTB (Upper the Better) applies to KPIs where a higher value is desired — like treatment completion rate or patient satisfaction score. The scorecard flips the red/green indicator logic automatically per KPI type.
Is my patient data safe?
The Substance Abuse Center KPI Scorecard in Excel is a standalone .xlsx file that runs 100% offline on your computer. No data leaves your machine, no cloud sync, no external connections. You control the file and can store it on an encrypted drive like any other Excel workbook.
👤 About the Author
Built by PK — Microsoft Certified Professional with 15+ years of Excel, Google Sheets, and Power BI experience. Founder of NextGenTemplates, reaching 300K+ subscribers across YouTube channels (@PK-AnExcelExpert, @NextGenTemplates, @NeoTechNavigators). Every template is hand-built and tested before release.
🔗 Explore Related Templates
Strengthen your healthcare KPI tracking with these companion templates:
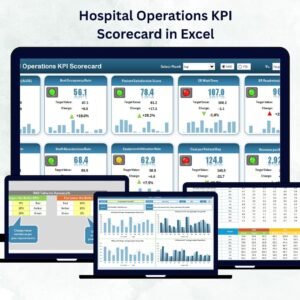
- 🏥 Hospital Operations KPI Scorecard in Excel — track hospital-wide operational metrics with the same MTD/YTD scorecard format.
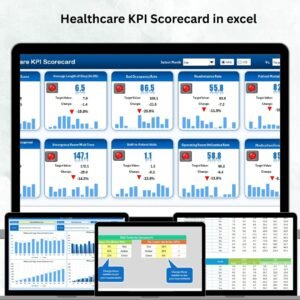
- 🏥 Healthcare KPI Scorecard in Excel — broader healthcare performance scorecard covering clinical quality and financial metrics.
- 📊 Telehealth Dashboard in Excel — 5 KPIs and 16 charts for virtual healthcare revenue, appointments, and patient demographics.
- 📊 Hospital Patient Flow Dashboard in Excel — track patient volumes, wait times, and department performance across 7 pages.
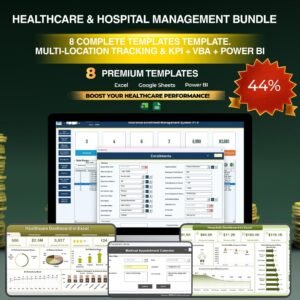
💎 Save 38% — Get 8 healthcare dashboards in the Healthcare & Hospital Management Bundle
Browse all Excel KPI Scorecard Templates
📖 Click here to read the Detailed Blog Post
🎥 Visit our YouTube channel for step-by-step video tutorials
👉 YouTube.com/@NextGenTemplates


Reviews
There are no reviews yet.