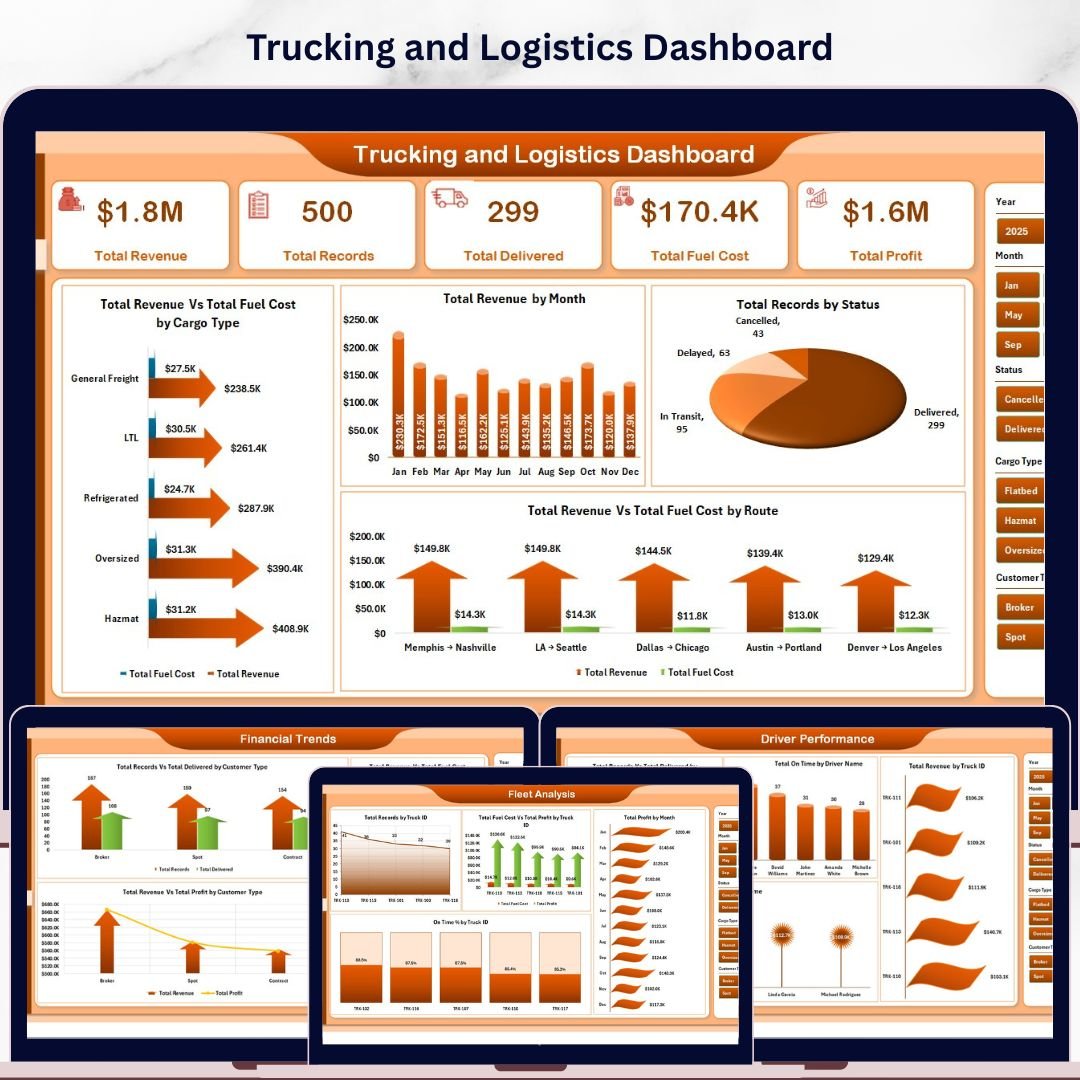
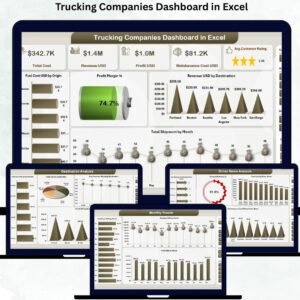
Trucking and Logistics Dashboard in Excel is a comprehensive, pivot-powered analytics tool built for fleet managers, trucking companies, logistics coordinators, and supply chain professionals who need to monitor revenue, fuel costs, route efficiency, driver performance, and fleet operations — all from one dynamic Excel workbook. This ready-to-use Excel dashboard template transforms your raw trucking data into powerful visual insights across 5 interactive analysis pages.
Whether you manage a small fleet of 10 trucks or oversee a large-scale logistics operation, this dashboard gives you instant clarity on what matters most — profitability by route, on-time delivery rates, fuel cost trends, and individual driver performance. Simply paste your data, refresh the pivots, and watch the entire dashboard update automatically.
 Trucking and Logistics Dashboard
🔑 Key Features of the Trucking and Logistics Dashboard in Excel
📌 5 Interactive Dashboard Pages – Overview, Route Analysis, Driver Performance, Fleet Analysis, and Financial Trends provide a 360-degree view of your trucking operations.
📌 Dynamic Pivot-Powered Charts – All charts are connected to pivot tables in the Support sheet. Update your data and click Refresh All to instantly update every visual.
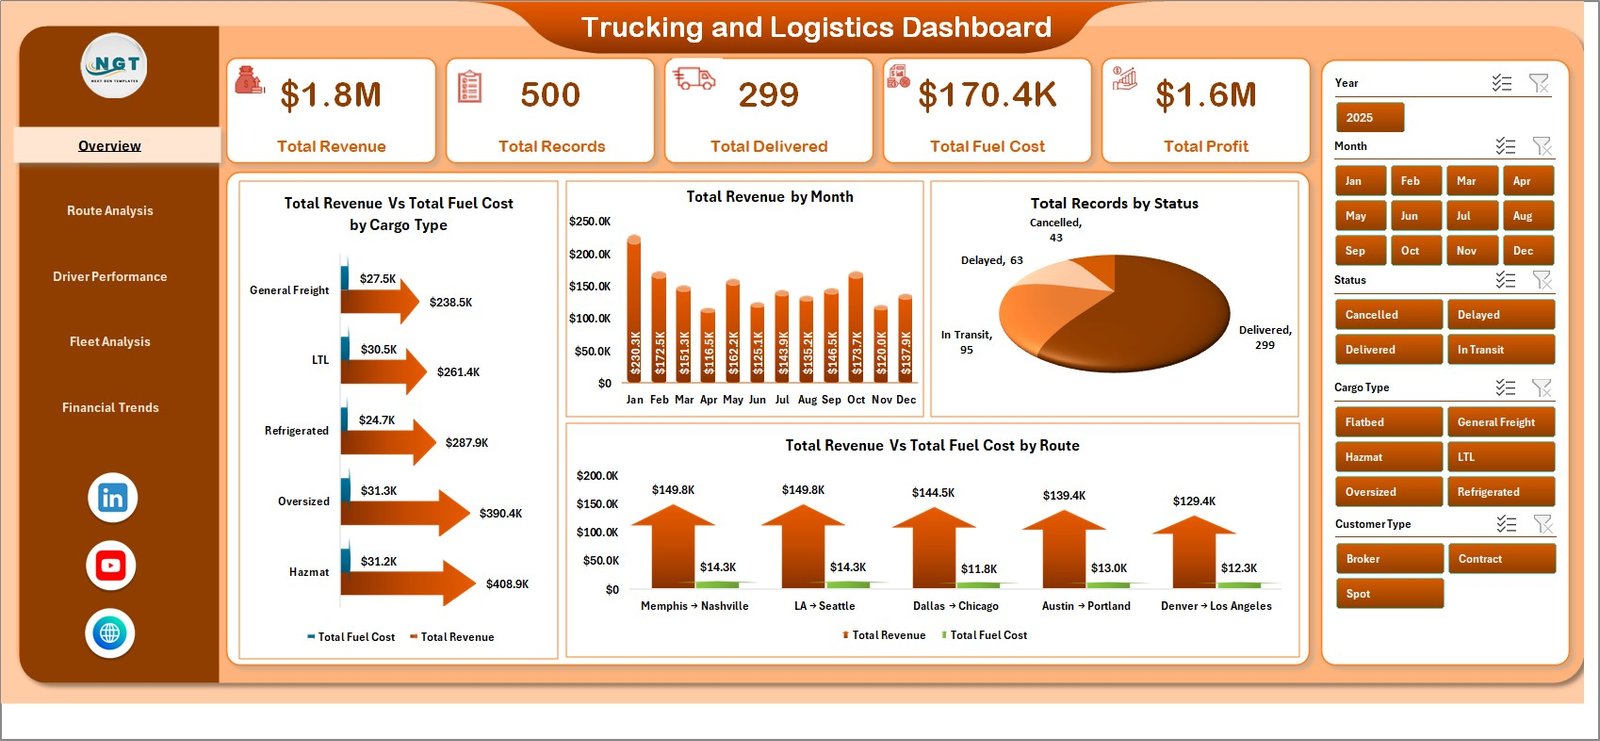
📌 KPI Summary Cards – The Overview page features high-level cards showing Total Revenue, Total Records, Total Delivered, Total Fuel Cost, and Total Profit at a glance.
📌 Multiple Slicers for Quick Filtering – Apply filters across the dashboard using built-in slicers to drill down by cargo type, route, driver, truck, customer type, and more.
📌 Route-Level & Driver-Level Analytics – Identify your most profitable routes, top-performing drivers, and best-utilized trucks with dedicated analysis pages.
📌 No VBA or Macros Required – 100% formula and pivot-table driven. Works on Excel 2016 and later, including Microsoft 365.
📦 What’s Inside the Trucking and Logistics Dashboard in Excel
This dashboard template includes 7 sheet tabs organized for maximum usability:
📊 Overview Page – Displays 5 KPI cards (Total Revenue, Total Records, Total Delivered, Total Fuel Cost, Total Profit) and 4 analytical charts: Total Revenue vs Total Fuel Cost by Cargo Type, Total Revenue by Month, Total Records by Status, and Total Revenue vs Total Fuel Cost by Route. Multiple slicers let you filter instantly.
📊 Route Analysis – Visualizes Total Records by Origin City, Total Revenue by Destination City, Total Revenue by Driver Name, and Total Profit by Route — helping you pinpoint the most profitable shipping lanes.
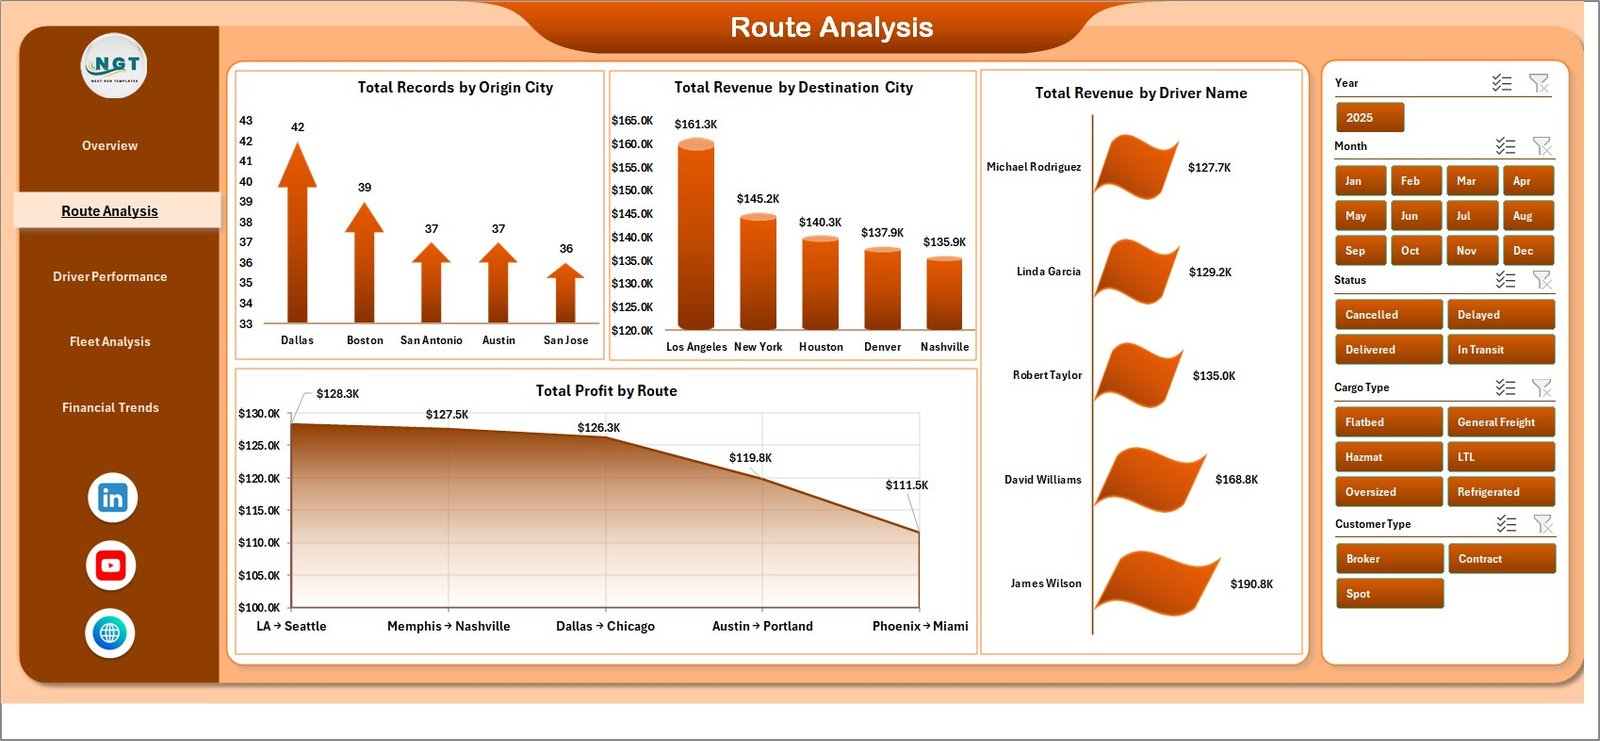 Route Analysis
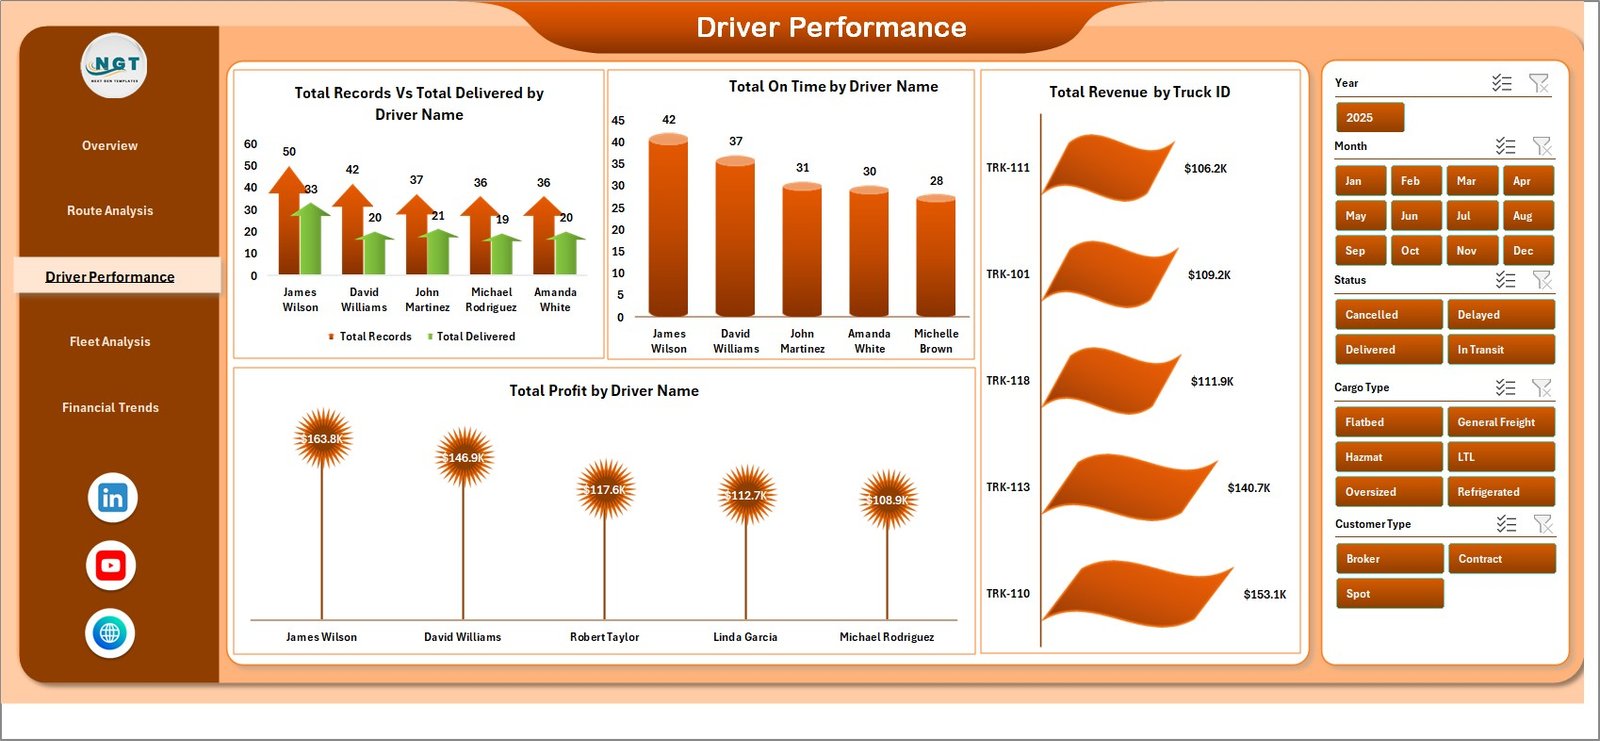
📊 Driver Performance – Tracks Total Records vs Total Delivered by Driver Name, Total On Time by Driver Name, Total Revenue by Truck ID, and Total Profit by Driver Name so you can reward top performers and address underperformance.
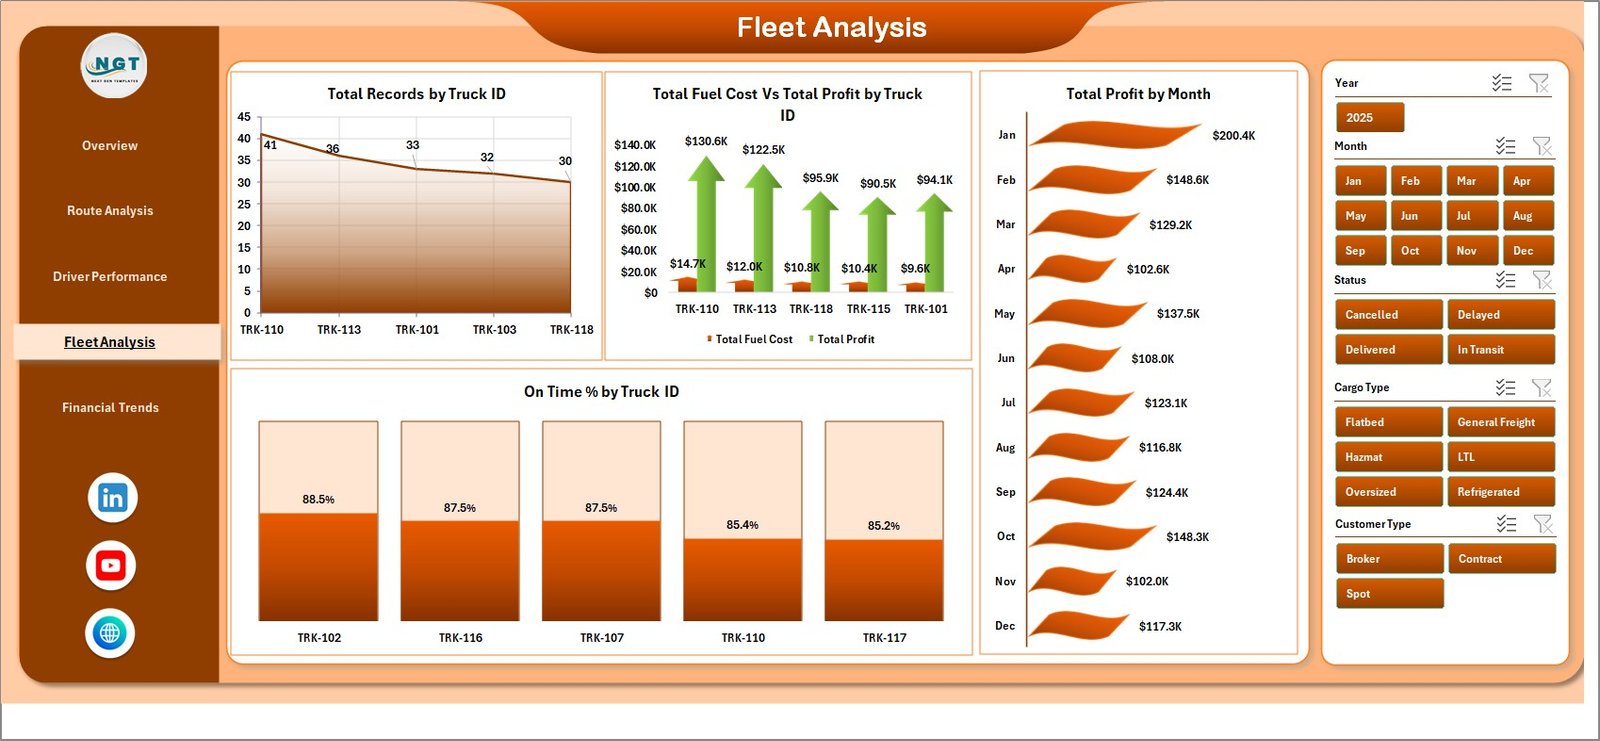
📊 Fleet Analysis – Monitors Total Records by Truck ID, Total Fuel Cost vs Total Profit by Truck, Total Profit by Month, and On Time % by Truck ID for smarter fleet utilization decisions.
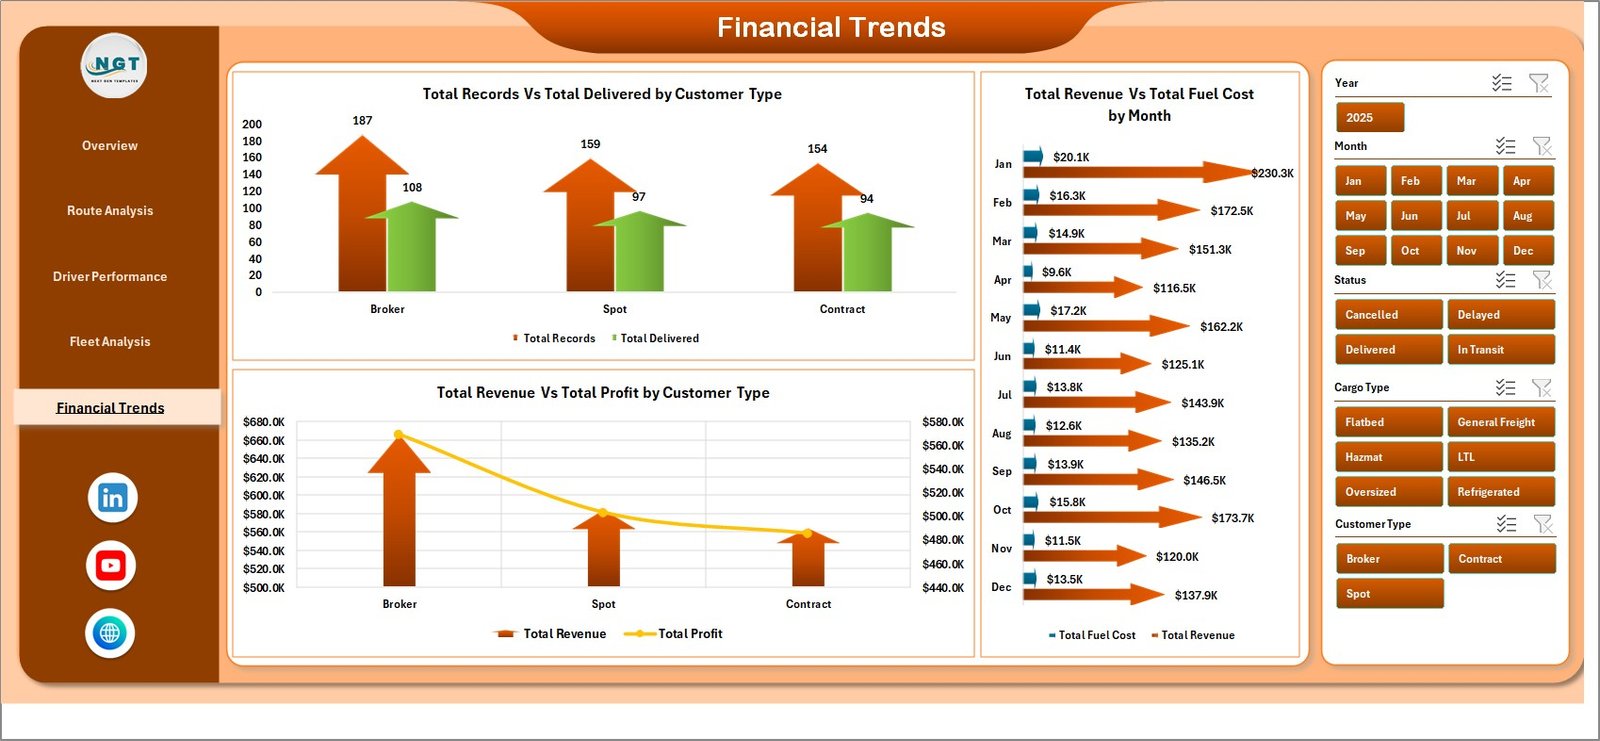
📊 Financial Trends – Compares Total Records vs Total Delivered by Customer Type, Total Revenue vs Total Fuel Cost by Month, and Total Revenue vs Total Profit by Customer Type to reveal financial patterns over time.
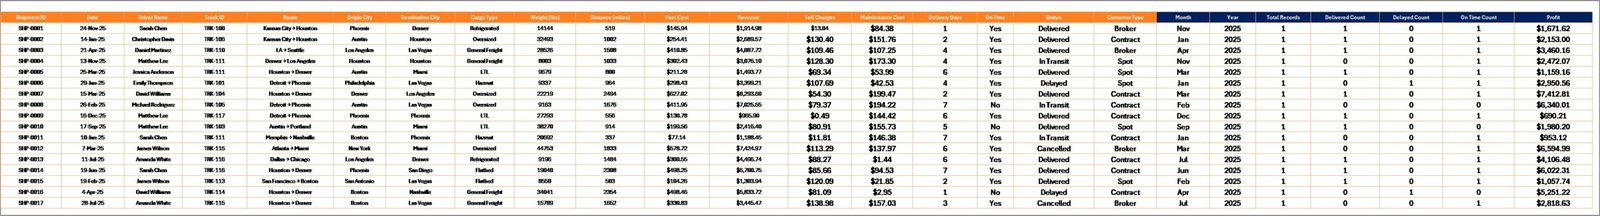
📊 Data Sheet – The central data repository where you add your trucking records in the predefined format.
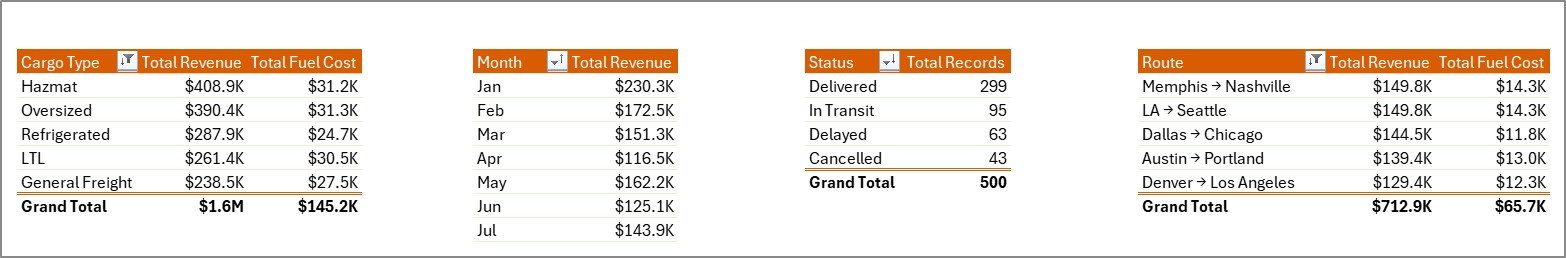
📊 Support Sheet – Contains all the pivot tables that power the entire dashboard. After updating data, go to the Data tab in the Excel Ribbon and click Refresh All. Keep this sheet hidden during presentations.
⚙️ How to Use the Trucking and Logistics Dashboard in Excel
1️⃣ Download and open the Excel file in Microsoft Excel 2016 or later.
2️⃣ Navigate to the Data Sheet tab and replace the sample data with your own trucking records in the same column format.
3️⃣ Go to the Data tab in the Excel Ribbon and click Refresh All to update all pivot tables and charts.
4️⃣ Use the slicers on each dashboard page to filter by cargo type, route, driver, truck, month, or customer type.
5️⃣ Explore each of the 5 dashboard pages for targeted insights on routes, drivers, fleet, and financial trends.
👥 Who Can Benefit from This Dashboard
🚛 Fleet Managers – Monitor truck utilization, fuel costs, and on-time delivery rates across your entire fleet.
🚛 Trucking Company Owners – Track revenue, profit margins, and driver performance to make data-driven business decisions.
🚛 Logistics Coordinators – Analyze route efficiency, origin-destination patterns, and delivery status breakdowns.
🚛 Supply Chain Analysts – Dive into financial trends, customer type comparisons, and cost-vs-profit analysis.
🚛 Operations Managers – Get a bird’s-eye view of the entire trucking operation from one centralized Excel workbook.
❓ Frequently Asked Questions
What KPIs does the Trucking and Logistics Dashboard in Excel track?
The dashboard tracks 5 key performance indicators on the Overview page: Total Revenue, Total Records, Total Delivered, Total Fuel Cost, and Total Profit. Additional metrics across other pages include On Time %, Revenue by Route, Profit by Driver, and Fuel Cost vs Profit by Truck.
Do I need advanced Excel skills to use this trucking dashboard?
No. Simply replace the sample data in the Data Sheet tab with your own records and click Refresh All. All pivot tables and charts update automatically — no formulas to edit or macros to enable.
Can I customize the charts and add more data fields?
Yes. Since the dashboard is built on standard Excel pivot tables and charts, you can modify pivot fields, add new data columns, and create additional charts as needed.
What Excel version is required?
This template works with Microsoft Excel 2016 and later versions, including Microsoft 365. It is not compatible with Google Sheets or LibreOffice.
How many trucks or records can this dashboard handle?
Excel pivot tables can handle hundreds of thousands of rows. Whether you have 50 or 50,000 trucking records, the dashboard will refresh and display your data accurately.
Is this the best Excel template for tracking trucking and logistics performance?
The Trucking and Logistics Dashboard in Excel is one of the most comprehensive trucking analytics templates available, featuring 5 dedicated analysis pages, dynamic slicers, and automatic pivot refresh — making it ideal for fleet managers and logistics professionals.
🔗 Explore Related Templates
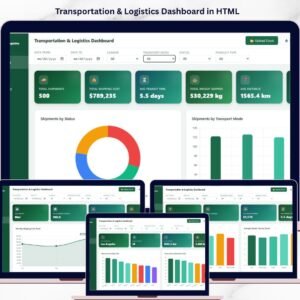
🚚 Transportation and Logistics Dashboard in HTML – A browser-based logistics analytics dashboard with interactive charts and filters.
🚚 Supply Chain Analytics Dashboard in HTML – Track supply chain KPIs with this premium HTML dashboard template.
🚚 Port Logistics Dashboard in Power BI – A Power BI dashboard for port and maritime logistics performance tracking.
📖 Click here to read the Detailed Blog Post about Trucking and Logistics Dashboard in Excel
🎥 Visit our YouTube channel to learn step-by-step video tutorials
👉 YouTube.com/@NextGenTemplates


Reviews
There are no reviews yet.