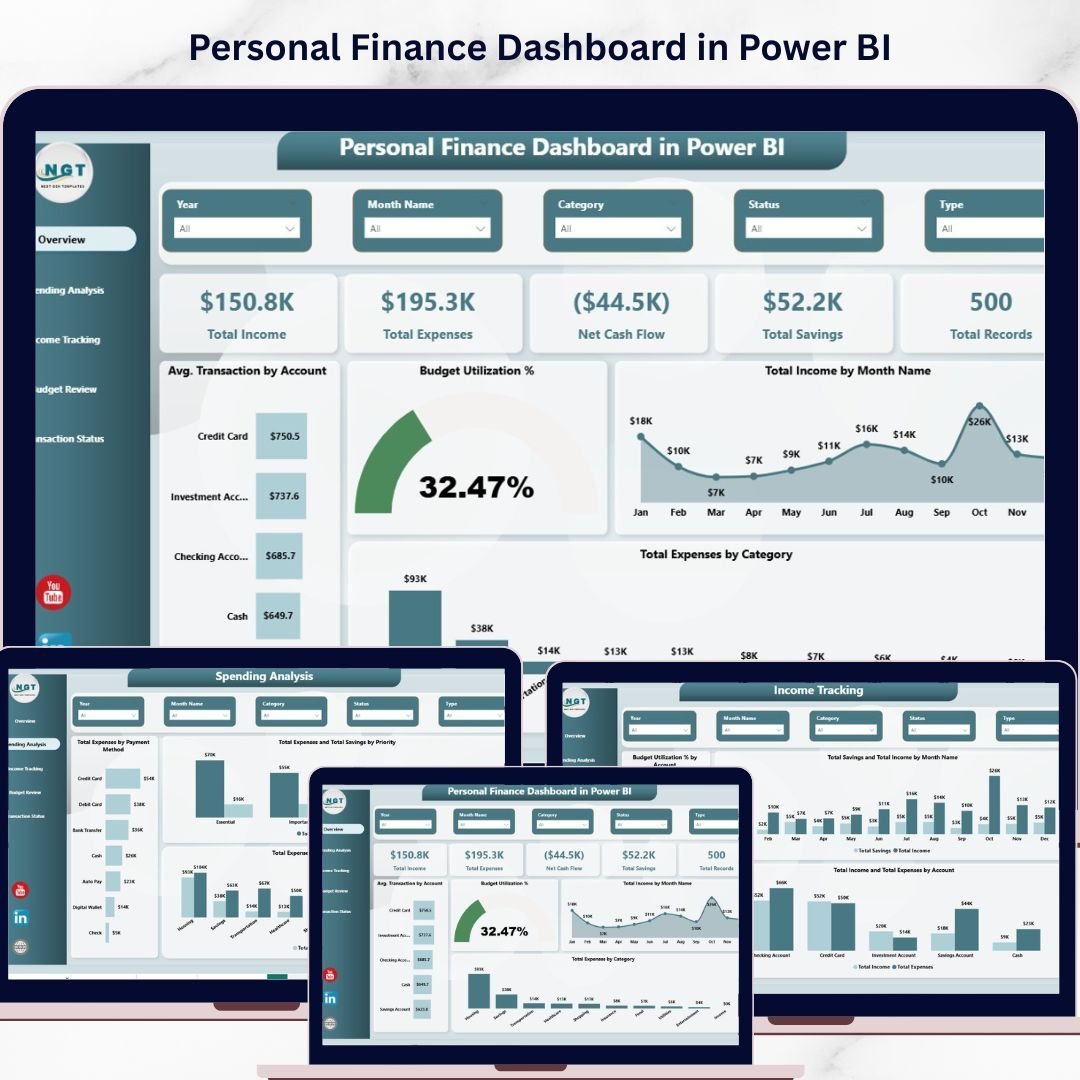


Personal Finance Dashboard in Power BI is a professionally designed, ready-to-use financial analytics template that helps individuals take complete control of their income, expenses, savings, budgets, and transaction status — all from one interactive Power BI dashboard. This template includes 5 dynamic dashboard pages packed with insightful charts, KPI cards, and slicers that auto-update when you connect your own data .
Whether you are managing household finances, tracking monthly budgets, analyzing spending habits, or monitoring your overall financial health, this Power BI Dashboard Template transforms raw financial data into clear, visual insights. If you prefer working in Excel, check out the Personal Finance Dashboard in Excel or the Personal Finance KPI Scorecard in Excel for detailed performance monitoring.
🔑 Key Features of Personal Finance Dashboard in Power BI
📊 5 Interactive Dashboard Pages — Overview, Spending Analysis, Income Tracking, Budget Review, and Transaction Status pages give you 360-degree visibility into your personal finances. This dashboard tracks 5 key metrics including Total Income, Total Expenses, Net Cash Flow, Total Savings, and Total Records across multiple analytical views.
📈 Dynamic KPI Cards on Overview — Instantly view Total Income, Total Expenses, Net Cash Flow, Total Savings, and Total Records at the top of the Overview page for a quick executive summary of your financial health. These cards provide a snapshot of your most critical financial indicators at a glance.
🎛 Multiple Slicers for Quick Filtering — Apply dynamic filters across the dashboard to drill down into specific categories, accounts, payment methods, and time periods instantly without modifying the underlying data.
💳 Comprehensive Spending Analysis — Analyze your expenses by payment method, compare expenses and savings by priority level, and see budget allocation versus actual spending by category to identify areas where you can save more.
💰 Detailed Income Tracking — Monitor budget utilization percentage by account, compare savings and income trends by month, and view income versus expenses across different accounts to understand your cash flow patterns.
📋 Budget Review and Transaction Monitoring — Review budget allocations by category, priority, and recurring status. Track transaction records by status, category, and monthly averages to ensure every dollar is accounted for.
📦 What’s Inside the Personal Finance Dashboard in Power BI
This Power BI personal finance template includes 5 fully interactive dashboard pages designed for comprehensive financial tracking and analysis:
📌 Overview Page — Displays high-level KPI cards for Total Income, Total Expenses, Net Cash Flow, Total Savings, and Total Records. Includes charts showing Average Transaction by Account, Budget Utilization %, Total Income by Month Name, and Total Expenses by Category. Multiple slicers let you filter the entire dashboard instantly.
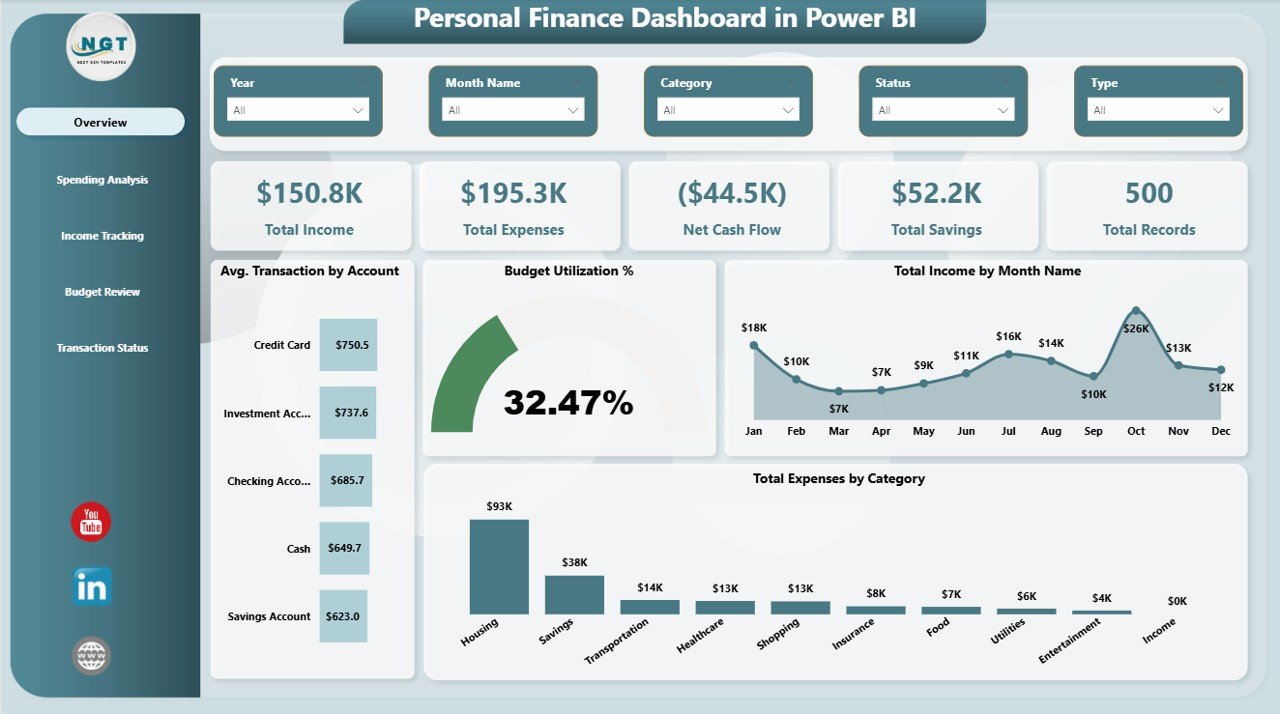
Overview Page
📌 Spending Analysis — Breaks down your spending patterns with visuals for Total Expenses by Payment Method, Total Expenses and Total Savings by Priority, and Total Expenses and Budget Allocated by Category.
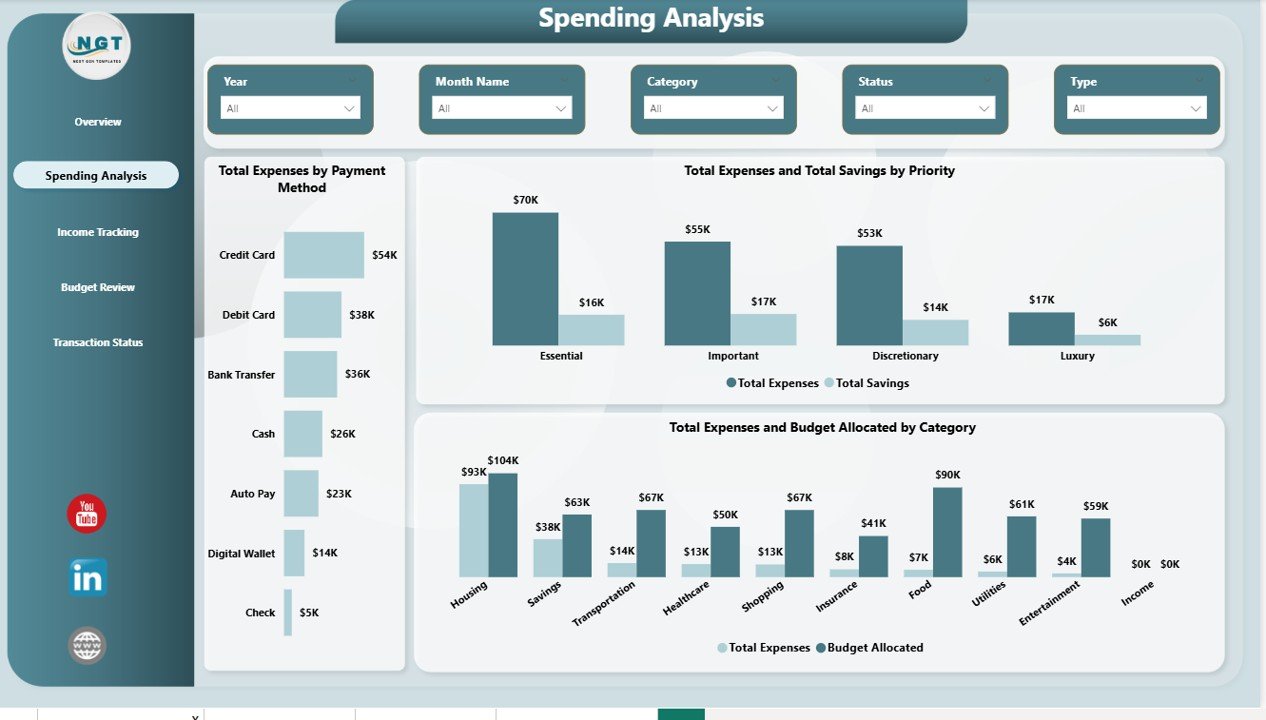
Spending Analysis
📌 Income Tracking — Tracks your earnings with Budget Utilization % by Account, Total Savings and Total Income by Month Name, and Total Income and Total Expenses by Account for a clear financial picture.
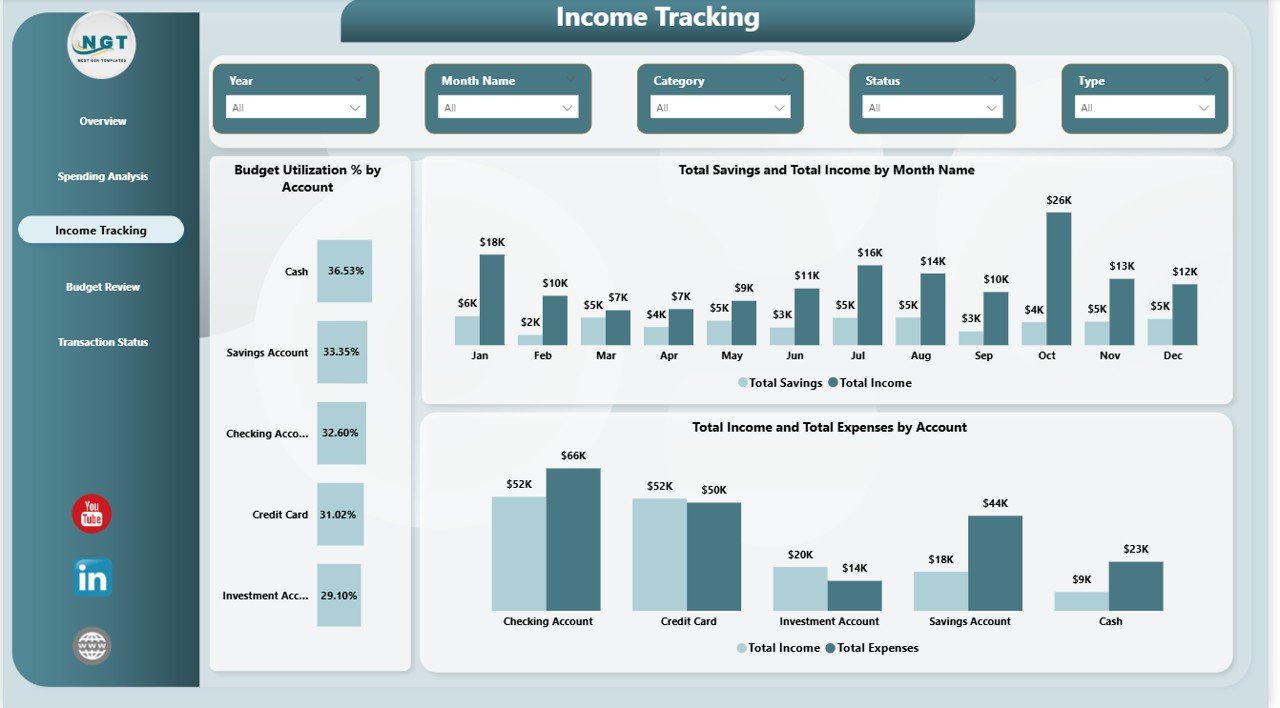
Income Tracking
📌 Budget Review — Provides detailed budget analysis with Budget Allocated by Category, Budget Allocated by Priority, and Total Expenses and Budget Allocated by Recurring status to help you stay on track financially.
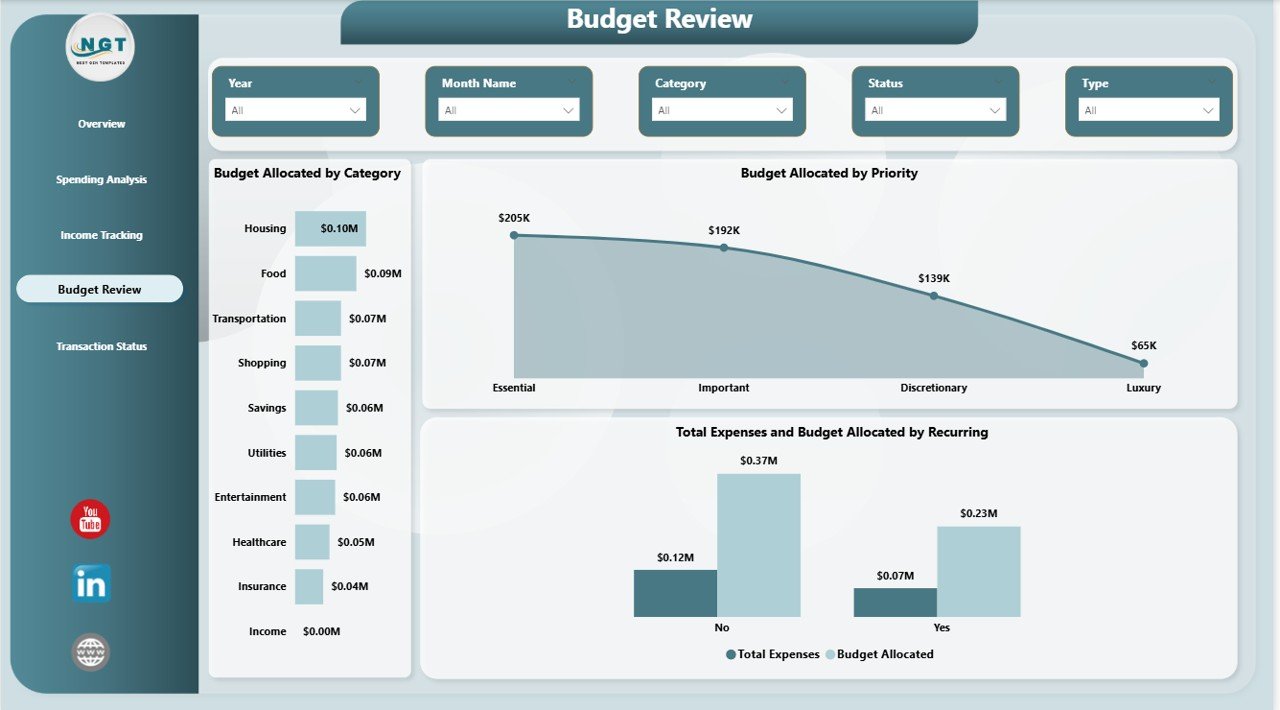
Budget Review
📌 Transaction Status — Monitors all transactions with visuals for Total Records by Status, Total Records by Category, and Average Transaction by Month Name to keep every financial entry organized and accounted for.
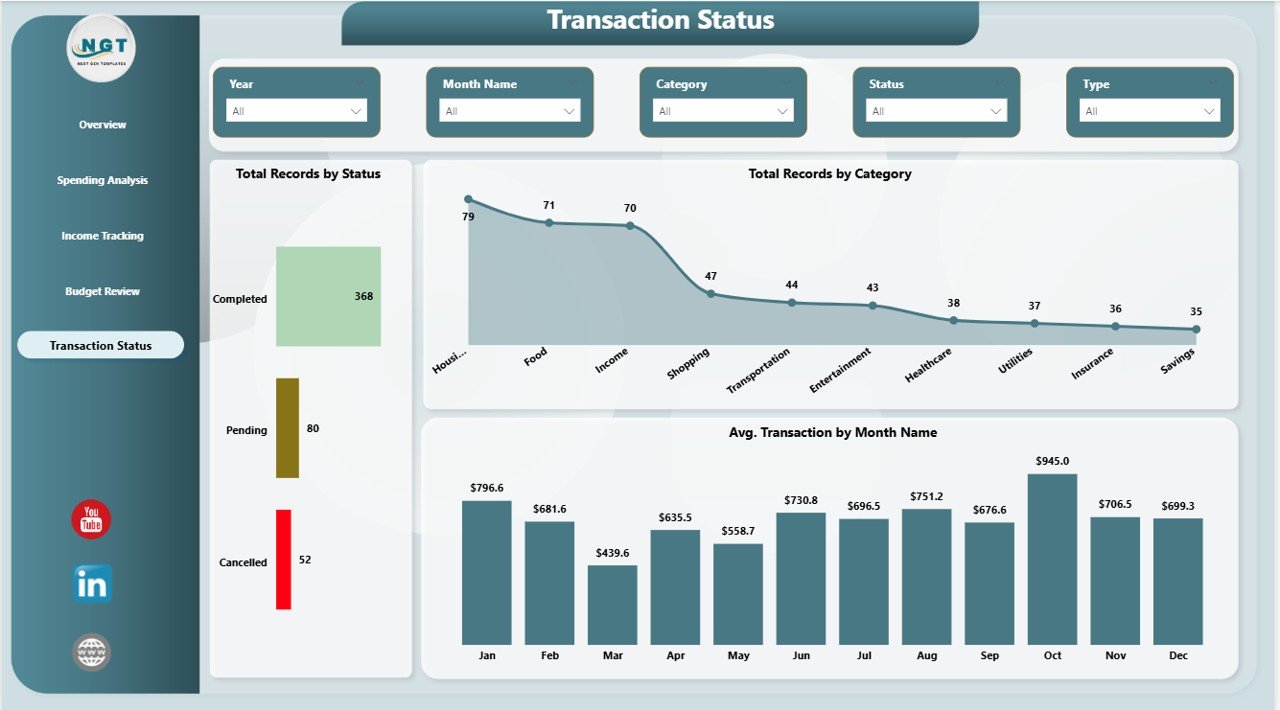
Transaction Status
⚙️ How to Use the Personal Finance Dashboard in Power BI
1️⃣ Download the .pbix file and open it in Power BI Desktop (free from Microsoft).
2️⃣ Review the sample data to understand the structure and layout of the dashboard.
3️⃣ Replace the sample data with your own financial records — income, expenses, budgets, and transactions.
4️⃣ All 5 dashboard pages will auto-update with your data, giving you instant financial insights.
5️⃣ Use the slicers on each page to filter by category, account, payment method, or time period.
👥 Who Can Benefit from This Personal Finance Dashboard in Power BI
💼 Individuals and Families — Track household income, expenses, and savings goals in one centralized dashboard.
📊 Freelancers and Consultants — Monitor project-based income, business expenses, and cash flow across multiple accounts.
🎓 Students and Young Professionals — Build healthy financial habits by visualizing spending patterns and budget adherence.
💰 Financial Advisors — Use this template as a client-facing tool to present personal finance summaries visually.
📈 Data Analysts and Power BI Learners — Study real-world dashboard design patterns with slicers, KPI cards, and multi-page navigation.
❓ Frequently Asked Questions
What KPIs does the Personal Finance Dashboard in Power BI track?
The Personal Finance Dashboard in Power BI tracks 5 key performance indicators: Total Income, Total Expenses, Net Cash Flow, Total Savings, and Total Records. These KPIs are displayed as dynamic cards on the Overview page and are used throughout the dashboard’s 5 interactive pages for detailed financial analysis.
Do I need advanced Power BI skills to use this template?
No. Simply open the .pbix file in Power BI Desktop, replace the sample data with your own financial records, and all charts, KPI cards, and slicers update automatically. No DAX or Power Query knowledge is required to get started.
Can I customize the categories and accounts in this dashboard?
Yes. The dashboard is fully customizable. You can modify expense categories, account names, payment methods, and priority levels in the data source. The visuals will automatically reflect your changes across all 5 pages.
What is the best Power BI template for tracking personal finances?
The Personal Finance Dashboard in Power BI from NextGenTemplates is one of the most comprehensive personal finance templates available. It includes 5 interactive pages covering overview metrics, spending analysis, income tracking, budget review, and transaction status — all in a single .pbix file ready for immediate use.
How does the Budget Review page help with financial planning?
The Budget Review page displays Budget Allocated by Category, Budget Allocated by Priority, and Total Expenses vs Budget Allocated by Recurring status. This helps you identify which categories are over or under budget and adjust your spending plan accordingly.
🔗 Explore Related Templates
📌 Personal Finance Dashboard in Excel — The Excel version of this dashboard with pivot tables and interactive charts for users who prefer Microsoft Excel.
📌 Personal Finance KPI Scorecard in Excel — A KPI-focused scorecard that monitors your financial health with monthly targets and actuals.
📌 Net Worth Tracker in Excel — Track your assets, liabilities, and net worth over time with this clean, easy-to-use template.
Click here to read the Detailed Blog Post
Watch the step-by-step video tutorial:


Reviews
There are no reviews yet.