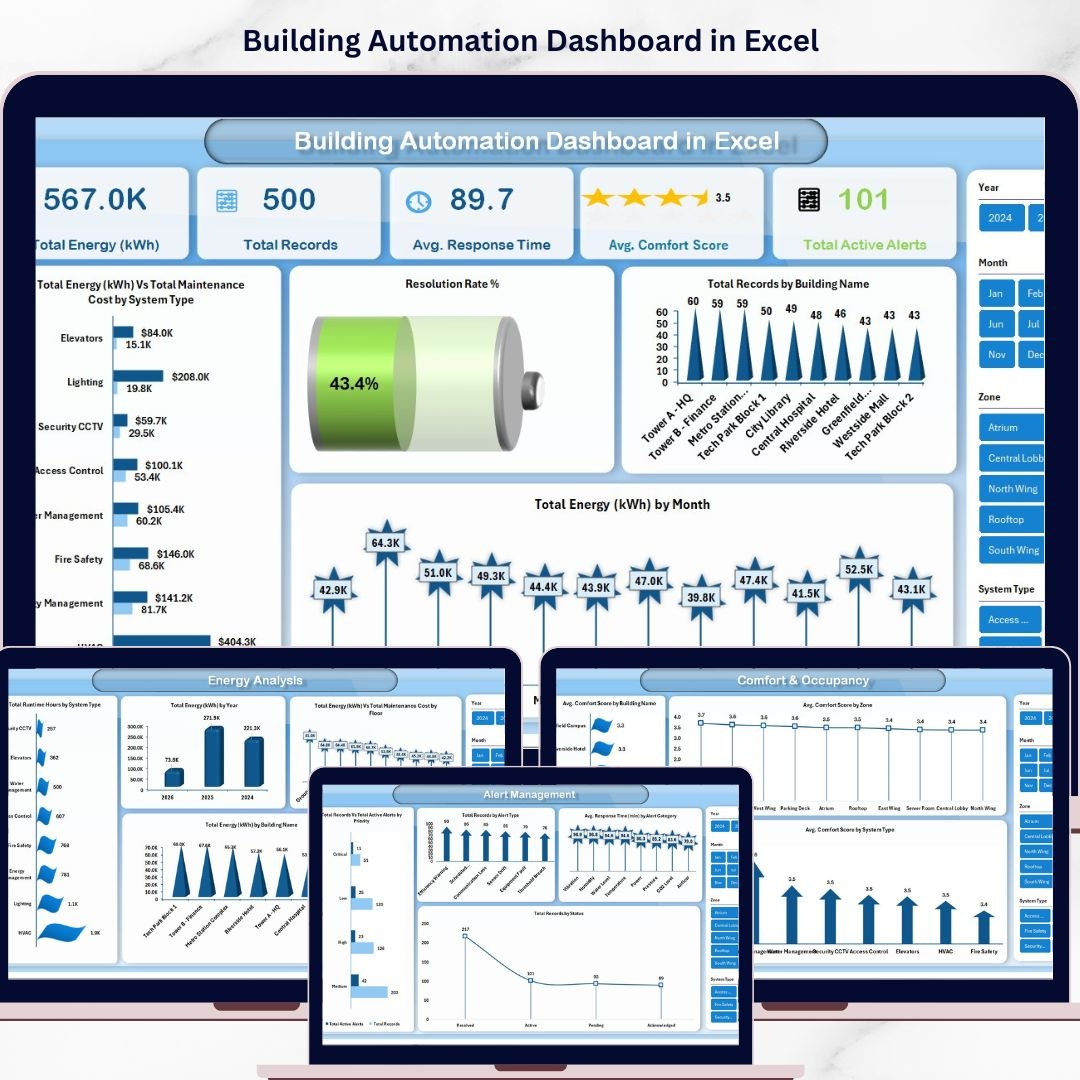

Building Automation Dashboard in Excel is a ready-to-use analytics template designed for facility managers, building engineers, and operations teams who need to monitor building performance data in a structured and visual format. This Excel dashboard includes 5 interactive analysis pages covering energy consumption, alert management, maintenance costs, comfort scores, and occupancy insights — all powered by pivot tables and dynamic slicers.
If you manage commercial properties, industrial facilities, smart buildings, or residential complexes, this Excel Dashboard Template transforms raw building automation data into actionable visual insights. Instead of reviewing scattered spreadsheets and operational logs, decision-makers can instantly analyze performance trends, energy patterns, and maintenance costs in one centralized dashboard.
The Building Automation Dashboard in Excel includes 7 structured worksheets designed for comprehensive building performance monitoring. It tracks key metrics including Total Energy (kWh), Total Records, Average Response Time, Average Comfort Score, and Total Active Alerts across multiple buildings and systems.
🔑 Key Features of Building Automation Dashboard in Excel
📊 Multi-Page Interactive Dashboard — This template includes 5 dedicated analysis pages: Overview, Energy Analysis, Alert Management, Maintenance Review, and Comfort & Occupancy. Each page focuses on a specific aspect of building automation performance.
📈 Dynamic Slicers and Filters — Apply filters using interactive slicers to quickly switch between buildings, systems, zones, months, and priority levels. The entire dashboard updates instantly based on your filter selections.
🏢 Energy Consumption Tracking — Monitor Total Energy (kWh) by building, floor, system type, month, and maintenance cost. The Energy Analysis page provides detailed breakdowns of runtime hours and energy distribution.
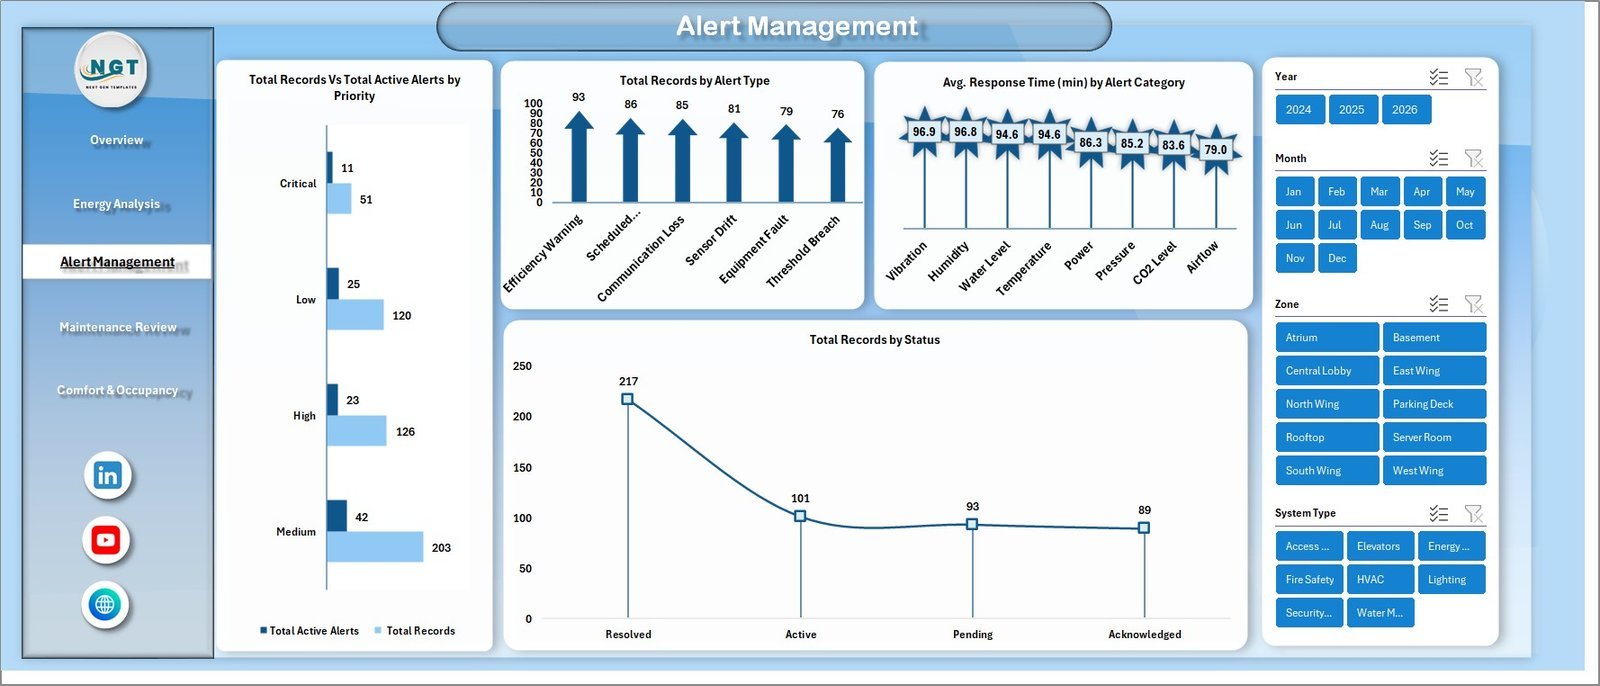
🔔 Alert Management Analytics — Track active alerts by priority level, alert type, alert category, and resolution status. Understand average response times and identify areas that need urgent attention.
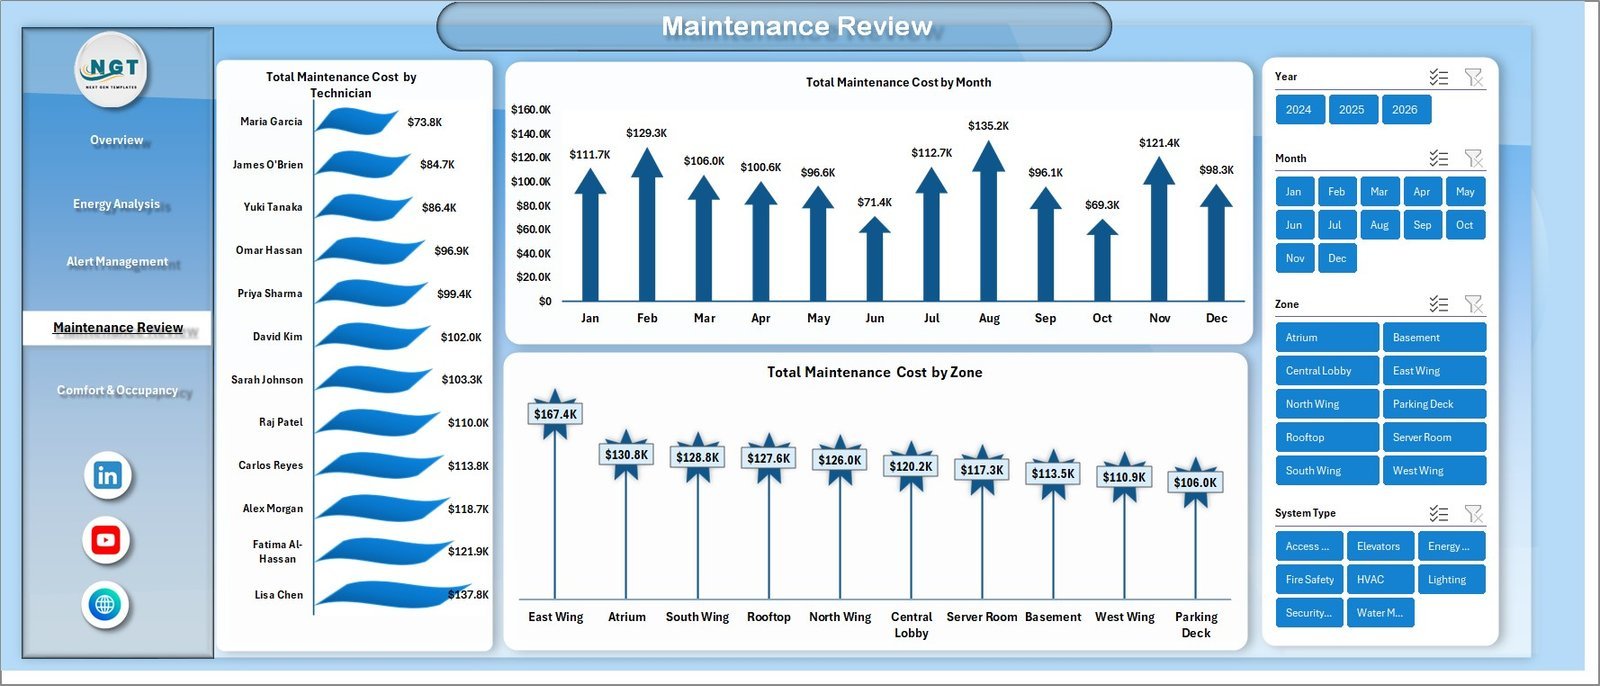
🔧 Maintenance Cost Monitoring — Analyze total maintenance costs by system type, month, and zone. Identify which building systems are consuming the highest maintenance budgets.
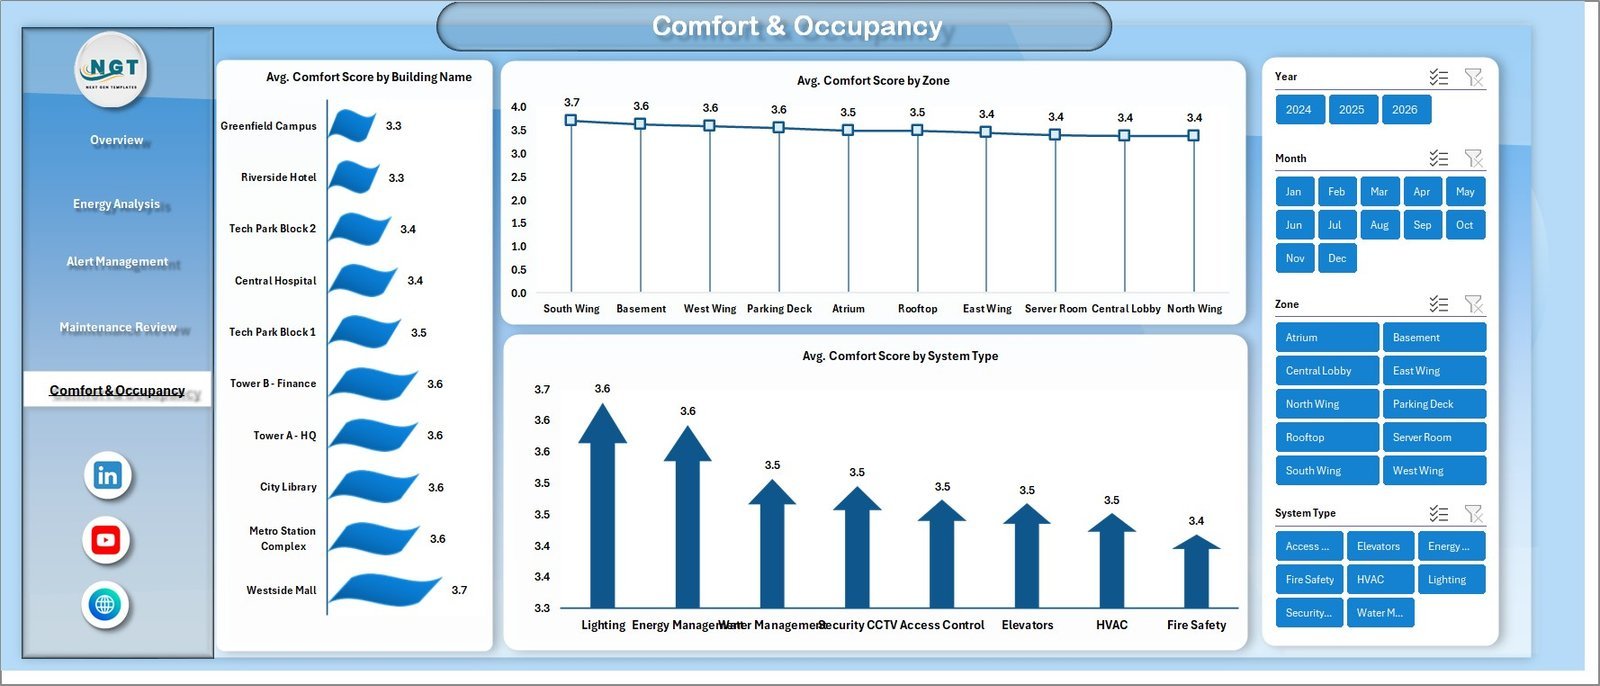
😊 Comfort & Occupancy Insights — Monitor average comfort scores across buildings, zones, and system types. Understand how building automation affects occupant satisfaction.
📉 Pivot Table Powered Analytics — All charts and analysis are driven by pivot tables stored in the Support sheet. Simply refresh the data source and all visualizations update automatically.
⚡ Resolution Rate Tracking — Monitor the percentage of resolved alerts to evaluate your maintenance team’s efficiency and response performance.
 Building Automation Dashboard in Excel
📦 What’s Inside the Building Automation Dashboard in Excel
This ready-to-use Excel template contains 7 structured worksheets designed to provide complete building automation analytics.
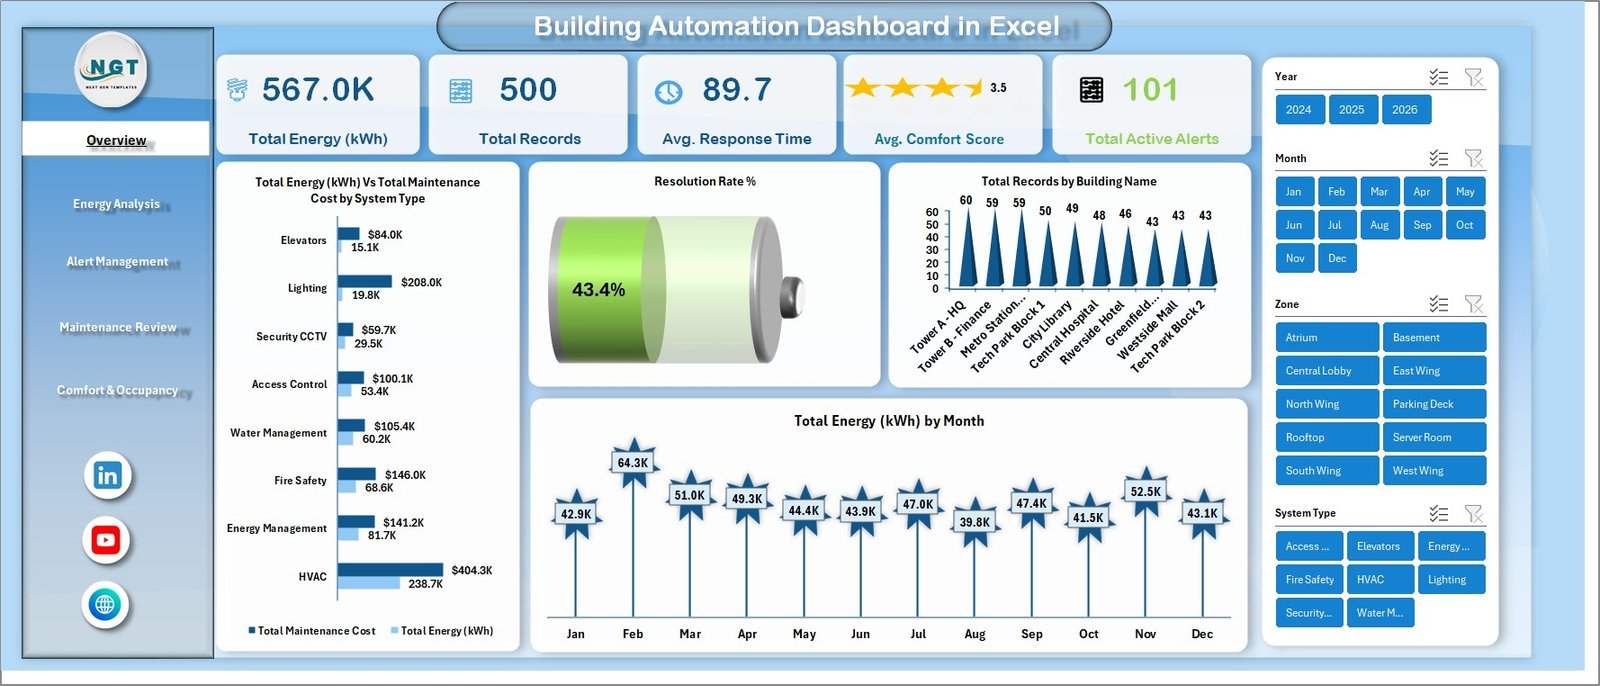
1 — Overview Page: The main dashboard page displays high-level KPI cards showing Total Energy (kWh), Total Records, Avg. Response Time, Avg. Comfort Score, and Total Active Alerts. It includes charts for Total Energy by Maintenance Cost, Resolution Rate %, Total Records by Building Name, and Total Energy by Month. Multiple slicers allow quick filtering across the entire dashboard.
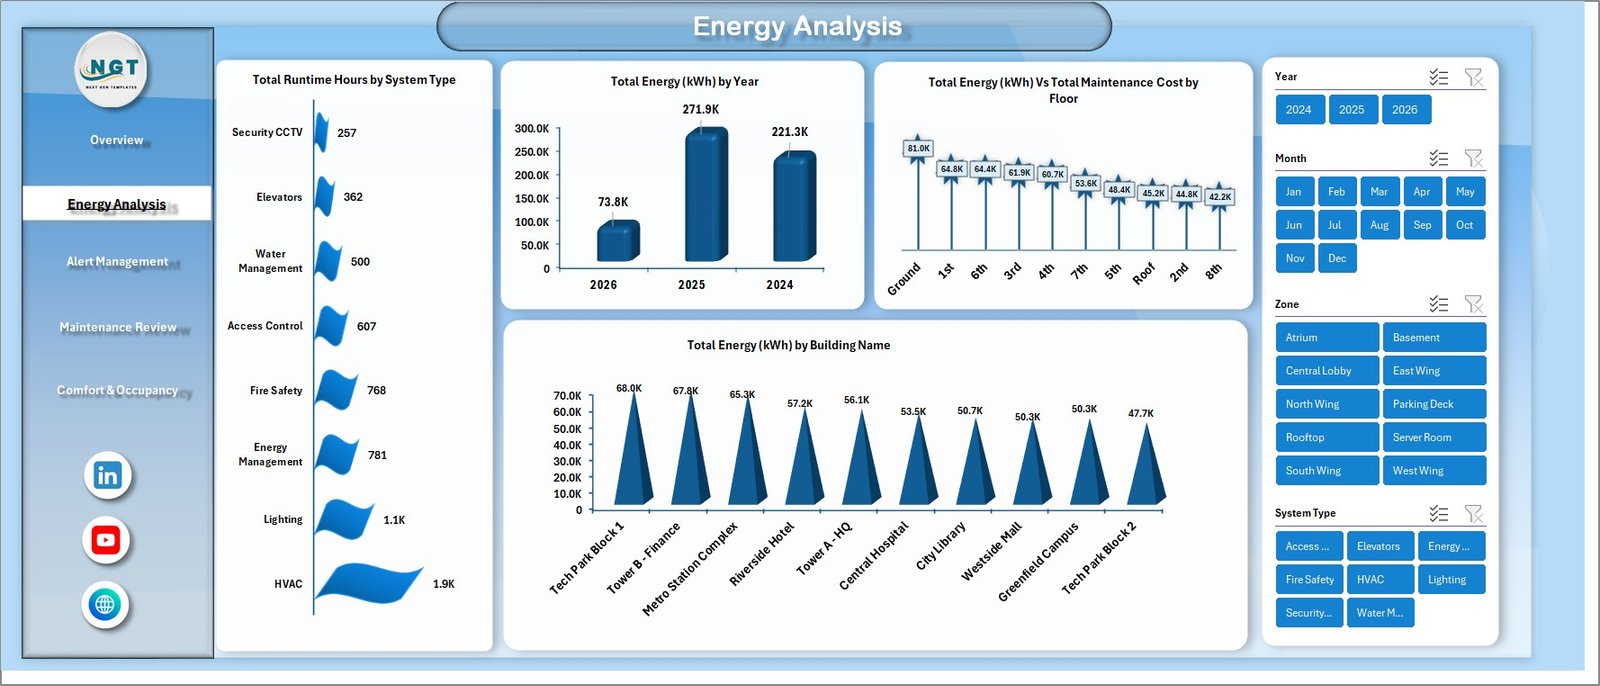 Energy Analysis
2 — Energy Analysis: This page provides detailed energy breakdowns including Total Runtime Hours by System Type, Total Energy (kWh) by Year, Total Energy by Maintenance Cost by Floor, and Total Energy by Building Name.
 Alert Management
3 — Alert Management: Track Total Records by Active Alerts by Priority, Total Records by Alert Type, Average Response Time by Alert Category, and Total Records by Status.
 Maintenance Review
4 — Maintenance Review: Analyze Total Maintenance Cost by System Type, Total Maintenance Cost by Month, and Total Maintenance Cost by Zone.
 Comfort & Occupancy
5 — Comfort & Occupancy: Monitor Average Comfort Score by Building Name, Average Comfort Score by Zone, and Average Comfort Score by System Type.
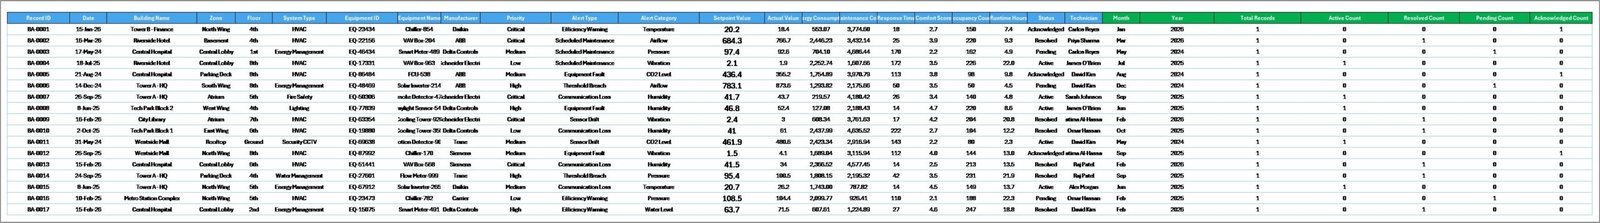
6 — Data Sheet: This is the main data sheet where you enter your building automation records in the structured format provided. All dashboard pages pull data from this sheet.
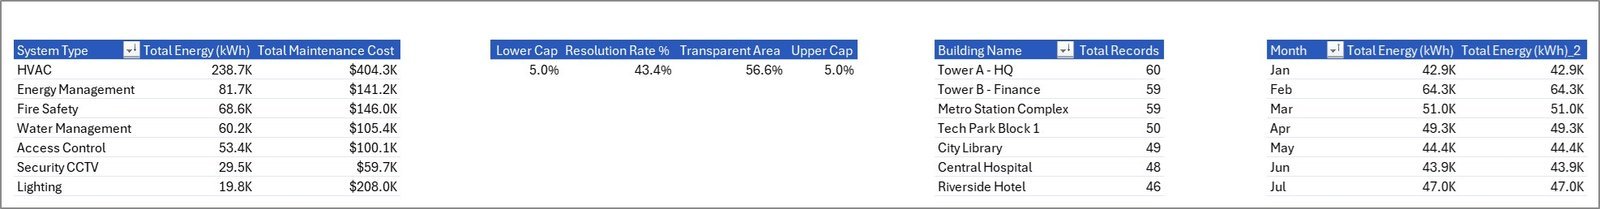
7 — Support Sheet: Contains all pivot tables that power the dashboard. After updating data in the Data Sheet, go to the Data tab in Excel Ribbon and click Refresh All. All pivots and charts will update automatically. You can keep this sheet hidden.
⚙️ How to Use the Building Automation Dashboard in Excel
1️⃣ Open the Excel file and go to the Data Sheet tab.
2️⃣ Replace the sample data with your own building automation data in the same format.
3️⃣ Go to the Data tab in the Excel Ribbon and click Refresh All.
4️⃣ All pivot tables in the Support Sheet will refresh and all charts across all 5 dashboard pages will update automatically.
5️⃣ Use the slicers on each page to filter by building, system type, zone, month, priority, and more.
👥 Who Can Benefit from This Building Automation Dashboard
🏢 Facility Managers — Monitor building energy, alerts, and maintenance in one place
🔧 Maintenance Teams — Track maintenance costs and alert response times
⚡ Energy Managers — Analyze energy consumption patterns across buildings and systems
🏗️ Building Operations Managers — Evaluate comfort scores and occupancy insights
📊 Property Management Companies — Centralize building performance monitoring
🏭 Industrial Facility Operators — Track automation system performance and costs
Any organization managing building automation systems can use this dashboard to improve operational visibility and reduce costs.
❓ Frequently Asked Questions
What does the Building Automation Dashboard in Excel track?
The Building Automation Dashboard in Excel tracks 5 key metrics including Total Energy (kWh), Total Records, Average Response Time, Average Comfort Score, and Total Active Alerts. It provides 5 interactive analysis pages covering energy, alerts, maintenance, comfort, and occupancy.
Do I need advanced Excel skills to use this dashboard?
No. Simply replace the sample data in the Data Sheet with your own data and click Refresh All in the Data tab. All charts and pivot tables update automatically. No VBA or macros required.
Can I add more buildings or system types to this dashboard?
Yes. Add new records in the Data Sheet following the same column format. After refreshing the pivot tables, the new buildings and systems will appear in all charts and slicers automatically.
What Excel version is required for this dashboard?
This dashboard works with Microsoft Excel 2016 and later versions, including Excel for Microsoft 365. It uses pivot tables, slicers, and charts that are supported in all modern Excel versions.
Is this dashboard suitable for multiple buildings?
Yes. The dashboard is designed to track and compare performance across multiple buildings. You can filter by building name using the slicers on each page.
How is this different from the Building Automation KPI Dashboard in Power BI?
The Excel version provides pivot-based analysis with 5 dashboard pages focused on energy, alerts, maintenance, comfort, and occupancy. The Power BI version focuses on KPI target tracking with MTD/YTD comparisons and trend analysis. Both complement each other for comprehensive building monitoring.
🔗 Explore Related Templates
🔹 Building Automation KPI Dashboard in Power BI — Track building KPIs with interactive Power BI analytics and target comparisons.
🔹 Excel Dashboard Templates — Browse our complete collection of professional Excel dashboard templates.
🔹 KPI Dashboard Templates — Explore KPI dashboards for various industries and departments.
📖 Click here to read the Detailed Blog Post
Watch the step-by-step video tutorial:


Reviews
There are no reviews yet.