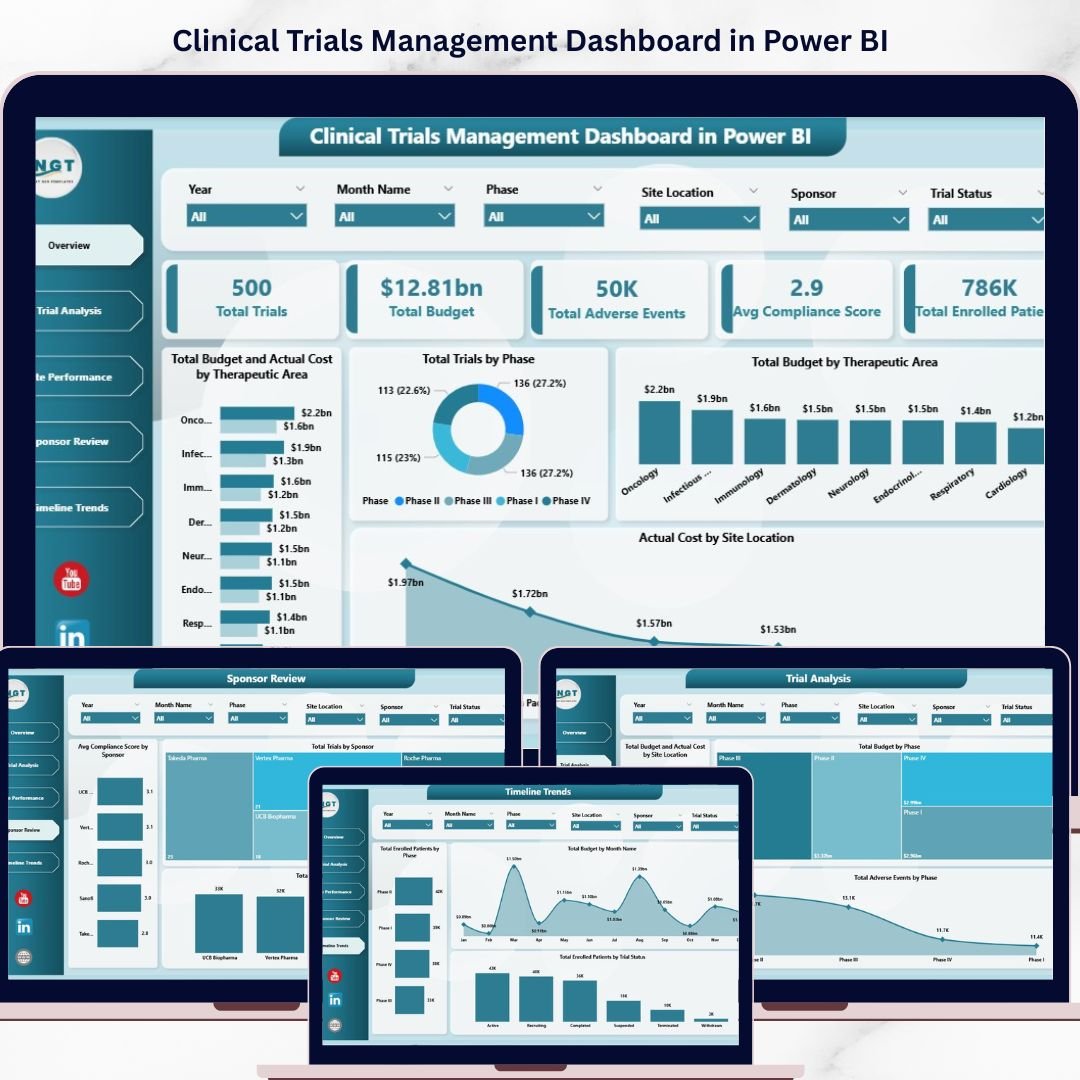
Clinical Trials Management Dashboard in Power BI is a comprehensive, ready-to-use analytics template designed for pharmaceutical companies, clinical research organizations (CROs), and healthcare research teams to monitor trial performance, budgets, patient enrollment, adverse events, and sponsor compliance from a single interactive Power BI report. Managing clinical trial operations across disconnected spreadsheets creates confusion, delays critical decisions, and increases compliance risk. This Power BI Dashboard Template transforms your raw trial data into powerful visual insights with just a few clicks.
This dashboard includes 5 interactive pages — Overview, Trial Analysis, Site Performance, Sponsor Review, and Timeline Trends — tracking metrics such as Total Trials, Total Budget, Total Adverse Events, Average Compliance Score, and Total Enrolled Patients across multiple therapeutic areas, phases, sponsors, and site locations. It is the most complete clinical trials analytics solution available as a ready-made Power BI template.
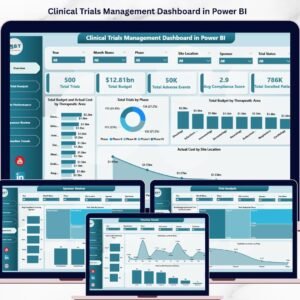
Clinical Trials Management Dashboard in Power BI
🔑 Key Features of Clinical Trials Management Dashboard in Power BI
📊 5 Interactive Dashboard Pages – Overview, Trial Analysis, Site Performance, Sponsor Review, and Timeline Trends deliver 360-degree visibility into every aspect of clinical trial management.
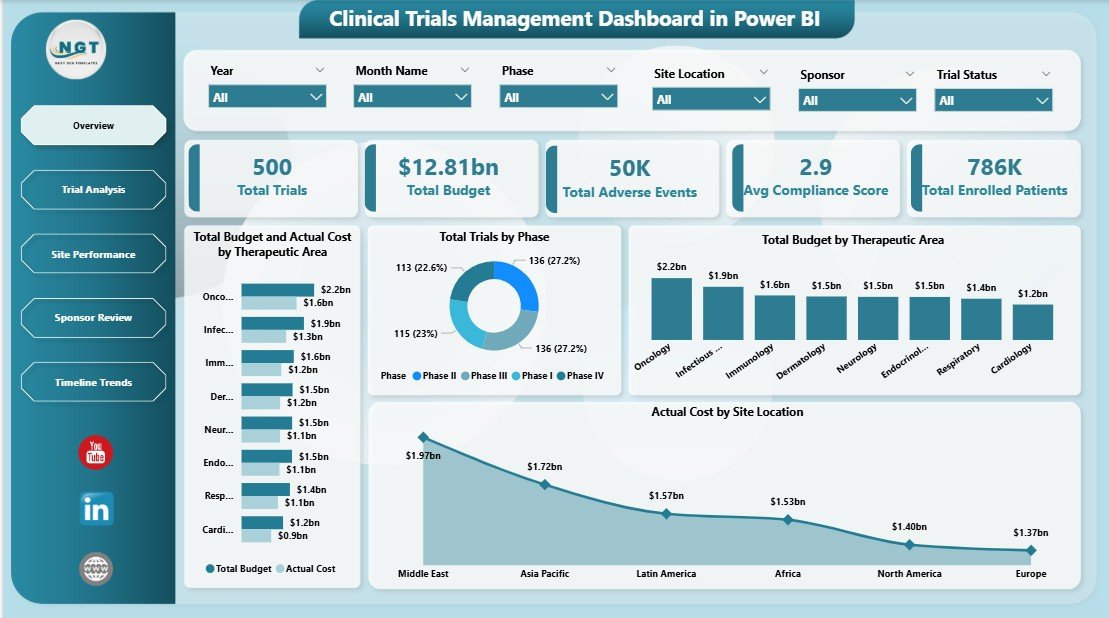
📈 Dynamic KPI Cards – Track Total Trials, Total Budget, Total Adverse Events, Avg Compliance Score, and Total Enrolled Patients at a glance from the Overview page.
🎛️ Multiple Slicers for Quick Filtering – Apply instant filters by therapeutic area, trial phase, sponsor, site location, and more to drill down into specific segments of your clinical data.
🔄 Budget vs Actual Cost Analysis – Compare Total Budget against Actual Cost by Therapeutic Area and by Site Location to identify over-spending or under-utilization instantly.
🌍 Geographic Site Performance – Visualize Total Trials by Country, Adverse Events by Site Location, and Budget by Sponsor for global trial oversight.
🏢 Sponsor Review Analytics – Evaluate sponsor effectiveness with Avg Compliance Score, Total Trials, and Total Enrolled Patients broken down by each sponsor.
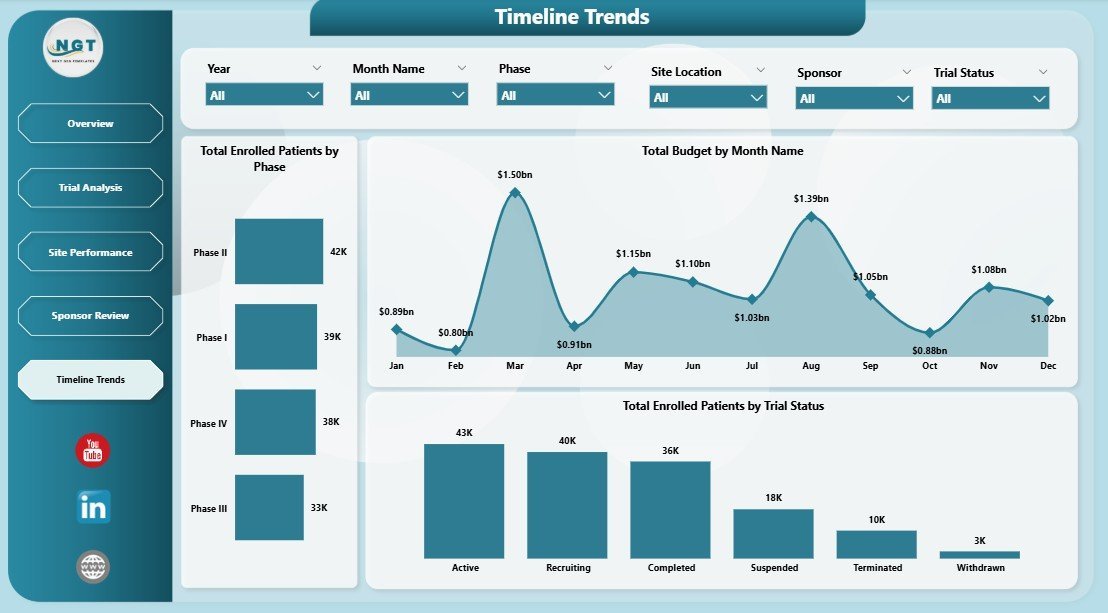
📅 Timeline Trends Tracking – Monitor enrollment and budget trends over time with Total Enrolled Patients by Phase, Budget by Month, and Enrollment by Trial Status.
🎨 Professional Design – Clean, modern layout with intuitive navigation tabs, consistent color coding, and optimized for executive presentations and regulatory reporting.
If you also work in Excel, explore our Clinical Trials Management Dashboard in Excel for a spreadsheet-based alternative.
📦 What’s Inside the Clinical Trials Management Dashboard in Power BI
📌 Overview Page – This is the main summary page displaying 5 KPI cards (Total Trials, Total Budget, Total Adverse Events, Avg Compliance Score, Total Enrolled Patients) along with charts showing Total Budget and Actual Cost by Therapeutic Area, Total Trials by Phase, Total Budget by Therapeutic Area, and Actual Cost by Site Location. Multiple slicers allow you to filter the entire dashboard instantly.
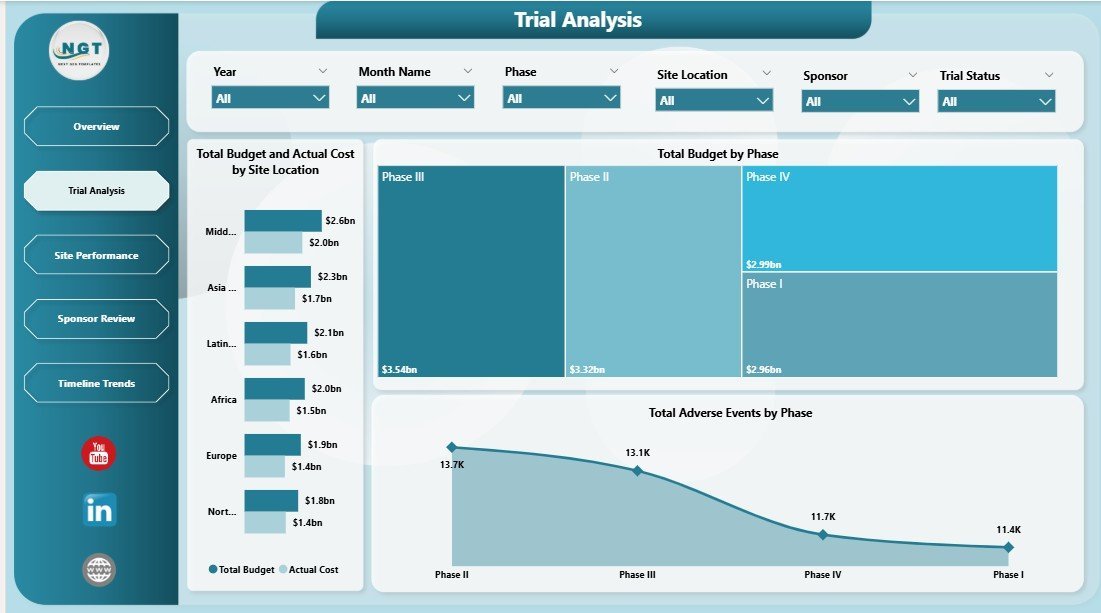
📌 Trial Analysis Page – Deep-dive into trial financials and safety metrics with Total Budget and Actual Cost by Site Location, Total Budget by Phase, and Total Adverse Events by Phase. This page helps identify which phases and sites consume the most budget and report the highest adverse events.
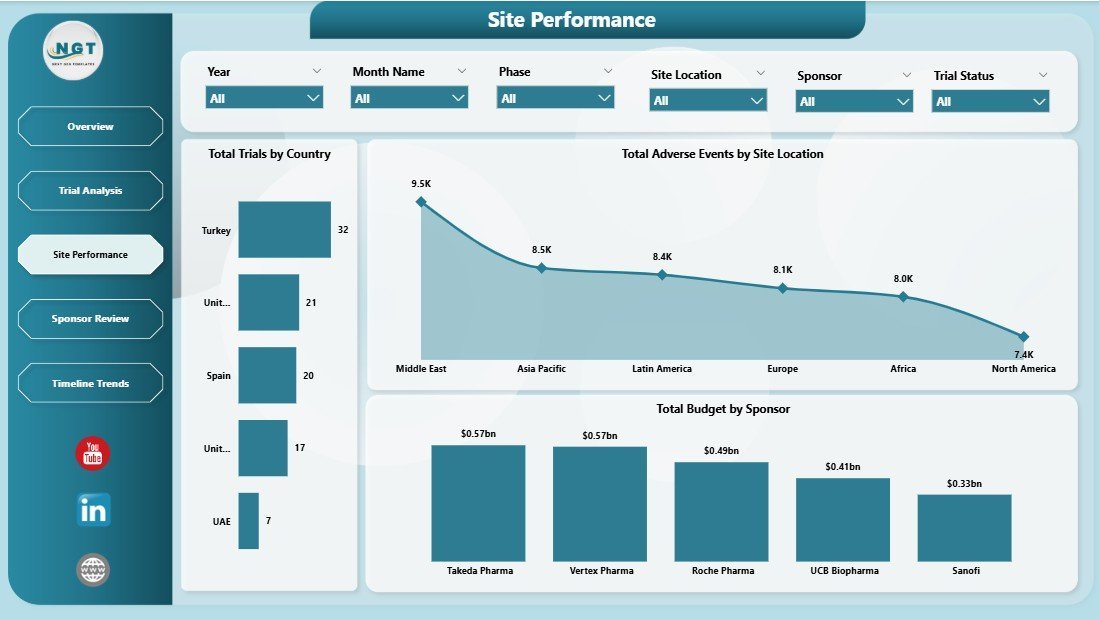
📌 Site Performance Page – Evaluate geographic distribution and site-level performance with Total Trials by Country, Total Adverse Events by Site Location, and Total Budget by Sponsor. Perfect for multi-site global trial management.
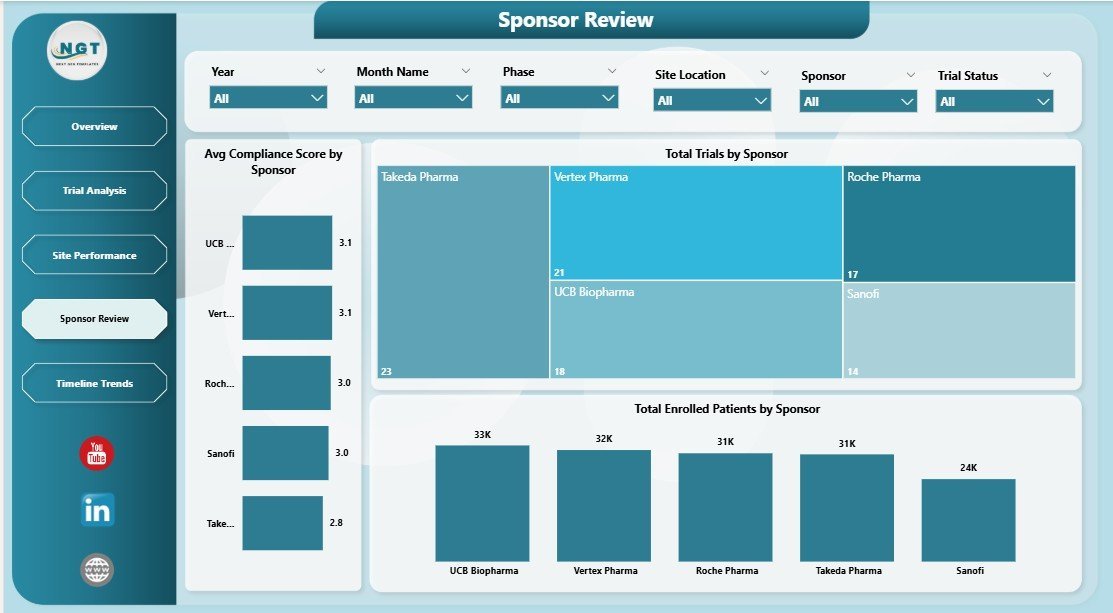
📌 Sponsor Review Page – Assess sponsor engagement and compliance with Avg Compliance Score by Sponsor, Total Trials by Sponsor, and Total Enrolled Patients by Sponsor. This helps identify top-performing and underperforming sponsors quickly.
📌 Timeline Trends Page – Track temporal patterns with Total Enrolled Patients by Phase, Total Budget by Month Name, and Total Enrolled Patients by Trial Status. Spot enrollment bottlenecks and seasonal budget fluctuations.
For related healthcare analytics, check out the Blood Banks Dashboard in Power BI and the Cardiology Institutes Dashboard in Power BI.
⚙️ How to Use the Clinical Trials Management Dashboard in Power BI
1️⃣ Download the .pbix file after purchase and open it in Power BI Desktop (free from Microsoft).
2️⃣ Review the sample data to understand the structure — columns include Trial ID, Therapeutic Area, Phase, Sponsor, Site Location, Country, Budget, Actual Cost, Enrolled Patients, Adverse Events, Compliance Score, Trial Status, and Date fields.
3️⃣ Replace the sample data with your own clinical trial records using the same column structure.
4️⃣ Refresh the data model and all 5 dashboard pages update automatically with your real numbers.
5️⃣ Use the slicers and filters on each page to drill down into specific therapeutic areas, phases, sponsors, or timeframes.
👥 Who Can Benefit from This Clinical Trials Dashboard
🔹 Pharmaceutical Companies – Monitor multi-site trial budgets, enrollment, and compliance across therapeutic areas.
🔹 Contract Research Organizations (CROs) – Deliver professional analytics dashboards to sponsors showing trial performance and site efficiency.
🔹 Clinical Operations Managers – Track enrollment rates, adverse events, and budget utilization in real-time for faster decisions.
🔹 Regulatory and Compliance Teams – Evaluate sponsor compliance scores and adverse event trends for audit readiness.
🔹 Healthcare Research Institutes – Analyze trial distribution by country and phase to optimize resource allocation across Power BI healthcare dashboards.
❓ Frequently Asked Questions
What KPIs does the Clinical Trials Management Dashboard in Power BI track?
This dashboard tracks 5 key performance indicators: Total Trials, Total Budget, Total Adverse Events, Average Compliance Score, and Total Enrolled Patients. These KPIs are displayed as summary cards on the Overview page and analyzed across all 5 dashboard pages by therapeutic area, phase, sponsor, site location, and time period.
Do I need advanced Power BI skills to use this template?
No. Simply open the .pbix file in Power BI Desktop, replace the sample data with your own clinical trial records using the same column structure, and refresh. All charts, KPI cards, and slicers update automatically — no DAX or Power Query coding required.
Can I customize the dashboard pages and add more charts?
Yes. The template is fully editable in Power BI Desktop. You can add new visuals, modify existing charts, create additional pages, and adjust colors, filters, or data sources as needed for your specific clinical trial requirements.
Is this template suitable for multi-site international clinical trials?
Absolutely. The Site Performance page includes Total Trials by Country and Adverse Events by Site Location, making it ideal for organizations running clinical trials across multiple countries and research sites. The slicers let you filter by any geographic dimension.
What is the difference between this and the Clinical Trials Management KPI Dashboard in Power BI?
This Clinical Trials Management Dashboard focuses on operational analytics with budget vs actual cost comparisons, site performance, and sponsor reviews. The KPI Dashboard version focuses more on scorecard-style KPI tracking. Both are designed for clinical trial management but serve different analytical needs.
🔗 Explore Related Templates
🔹 Clinical Trials Management Dashboard in Excel – Prefer Excel? Get the same clinical trial analytics in a fully automated Excel workbook with pivot tables and slicers.
🔹 Blood Banks Dashboard in Power BI – Track blood bank operations, donor management, and inventory analytics in Power BI.
🔹 Cardiology Institutes Dashboard in Power BI – Comprehensive cardiology department analytics with patient outcomes, procedure tracking, and financial metrics.
📖 Click here to read the Detailed Blog Post
🎥 Visit our YouTube channel to learn step-by-step video tutorials
👉 YouTube.com/@NextGenTemplates


Reviews
There are no reviews yet.