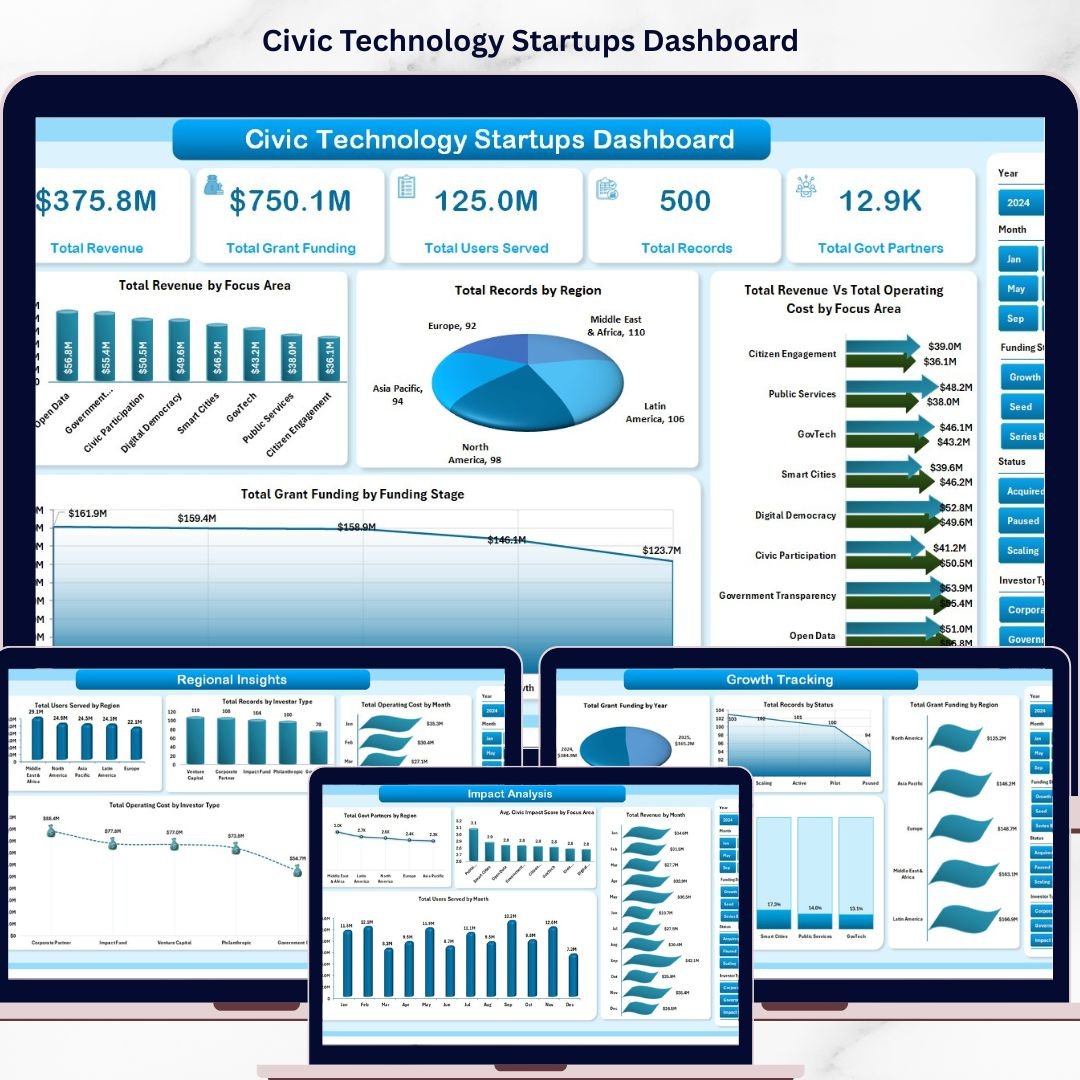
Civic Technology Startups Dashboard in Excel is a professionally designed, pivot-driven analytics template built for civic tech entrepreneurs, government innovation teams, social impact investors, public policy analysts, and technology consultants who need to monitor revenue streams, grant funding, user adoption, government partnerships, and civic impact scores across their startup portfolios — all from one powerful Excel Dashboard.
If you are managing a civic technology venture and struggling to consolidate financial data, regional performance, investor details, and growth metrics into one clear view, this Civic Technology Startups Dashboard in Excel brings everything together into a professional, pivot-powered analytics hub. Simply enter your data in the Data sheet, refresh all pivots, and let the dashboard deliver instant visibility into revenue trends, grant allocations, civic impact performance, and operational cost breakdowns across every focus area and region.
🔑 Key Features of Civic Technology Startups Dashboard in Excel
📊 5 Interactive Dashboard Pages — Overview, Financial Overview, Impact Analysis, Growth Tracking, and Regional Insights give you a 360-degree view of your civic tech startup performance with dynamic slicers and filters.
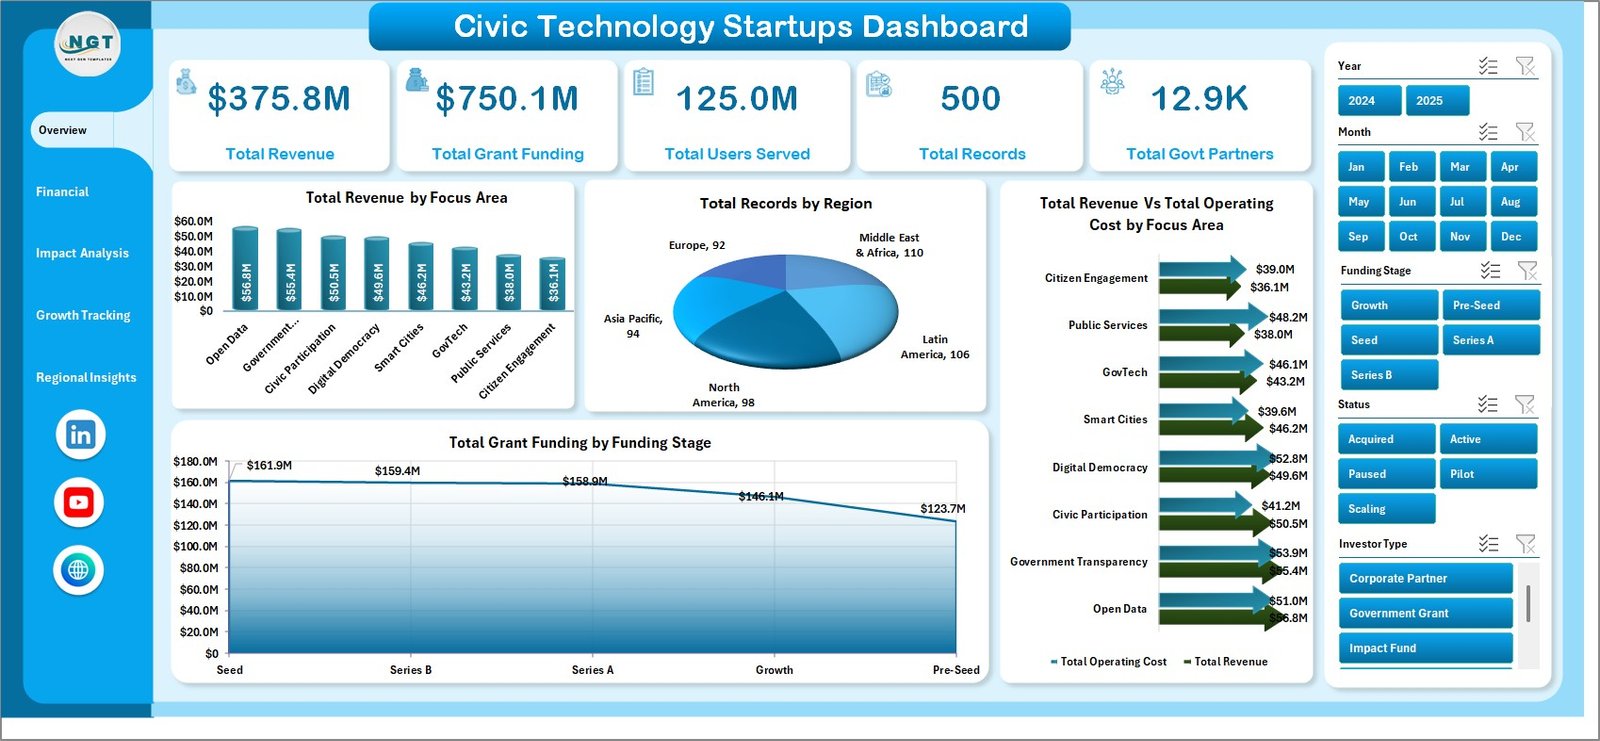
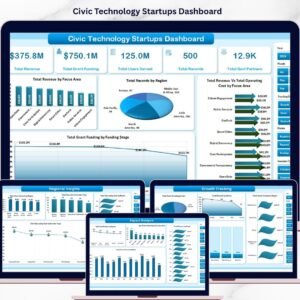
📈 High-Level KPI Cards — Instantly monitor Total Revenue, Total Grant Funding, Total Users Served, Total Records, and Total Govt Partners at the top of your Overview page for rapid decision-making.
🔄 Fully Pivot-Driven Architecture — Every chart and visual is powered by pivot tables stored in a dedicated Support sheet, so all you need to do is update the Data sheet and click Refresh All to update every page simultaneously.
🎯 Multi-Dimensional Analysis — Break down performance by Focus Area, Region, Investor Type, Funding Stage, Month, Year, and Status to uncover hidden patterns and strategic opportunities across your civic tech portfolio.
🔍 Interactive Slicers — Apply quick filters across every dashboard page to instantly drill down into specific focus areas, regions, time periods, or investor segments without modifying any formulas.
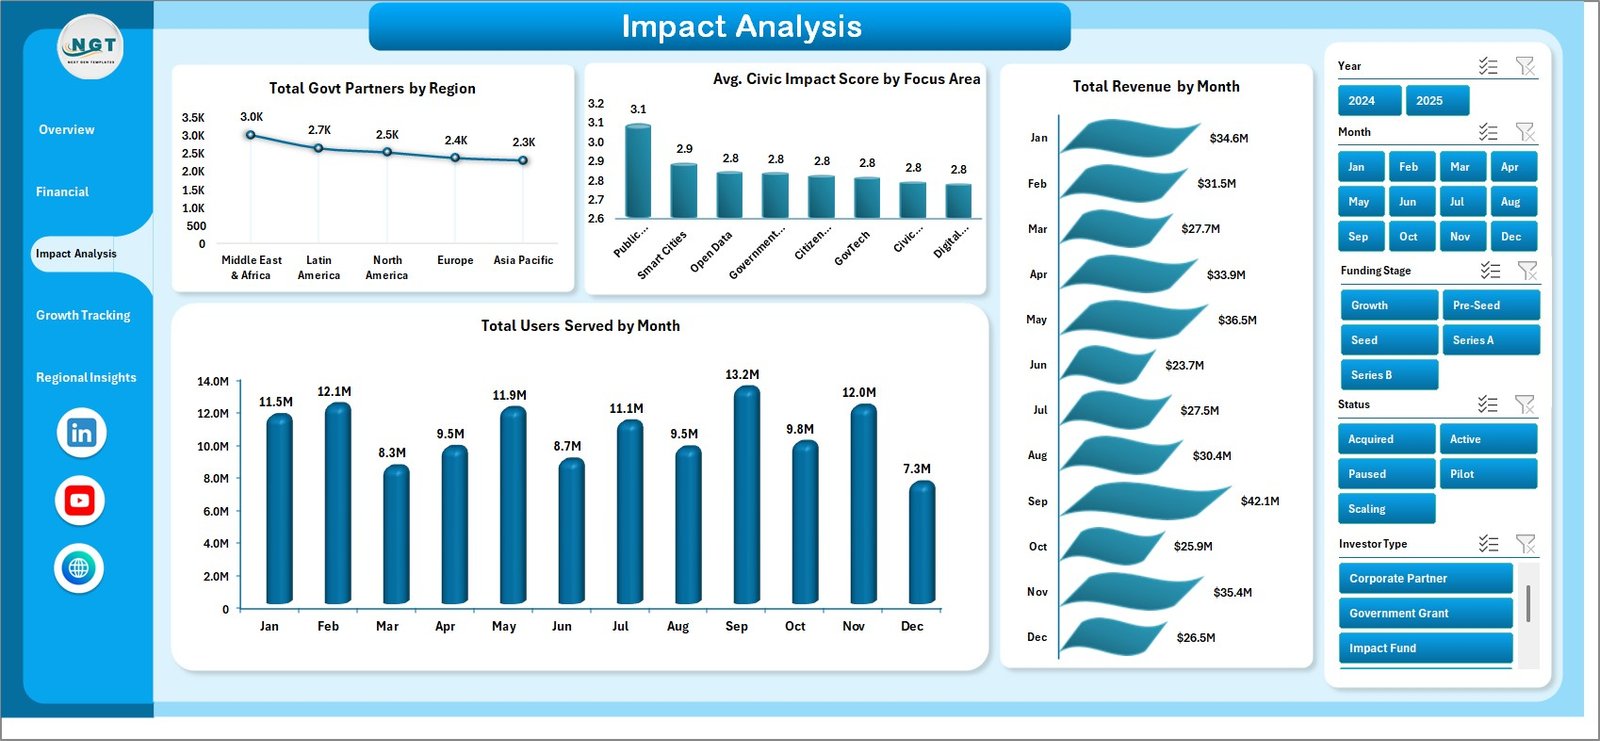
🌐 Civic Impact Scoring — Track and compare Avg. Civic Impact Score by Focus Area on the Impact Analysis page to measure the real-world social value your startups dashboard portfolio is delivering.
💰 Revenue vs. Operating Cost Comparison — Visualize Total Revenue versus Total Operating Cost by Focus Area and by Region to quickly identify profitable and cost-heavy segments that need attention.
 Civic Technology Startups Dashboard
📦 What’s Inside the Civic Technology Startups Dashboard in Excel
📋 Overview Page — Features KPI cards for Total Revenue, Total Grant Funding, Total Users Served, Total Records, and Total Govt Partners along with charts showing Total Revenue by Focus Area, Total Records by Region, Total Revenue Vs Total Operating Cost by Focus Area, and Total Grant Funding by Funding Stage.
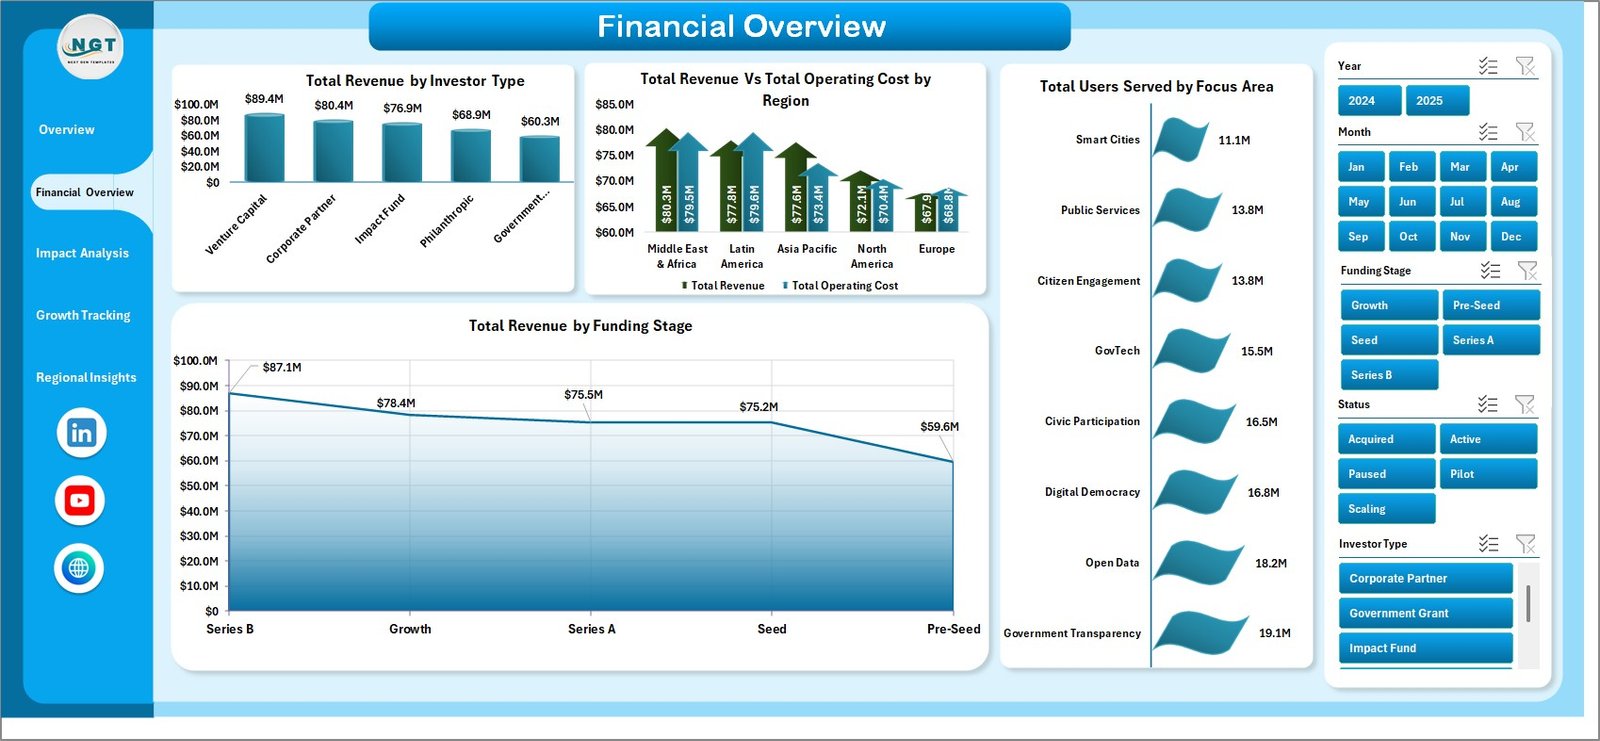
💵 Financial Overview — Delivers deep financial analysis with Total Revenue by Investor Type, Total Revenue Vs Total Operating Cost by Region, Total Users Served by Focus Area, and Total Revenue by Funding Stage.
🌍 Impact Analysis — Measures social outcomes with Total Govt Partners by Region, Avg. Civic Impact Score by Focus Area, Total Revenue by Month, and Total Users Served by Month.
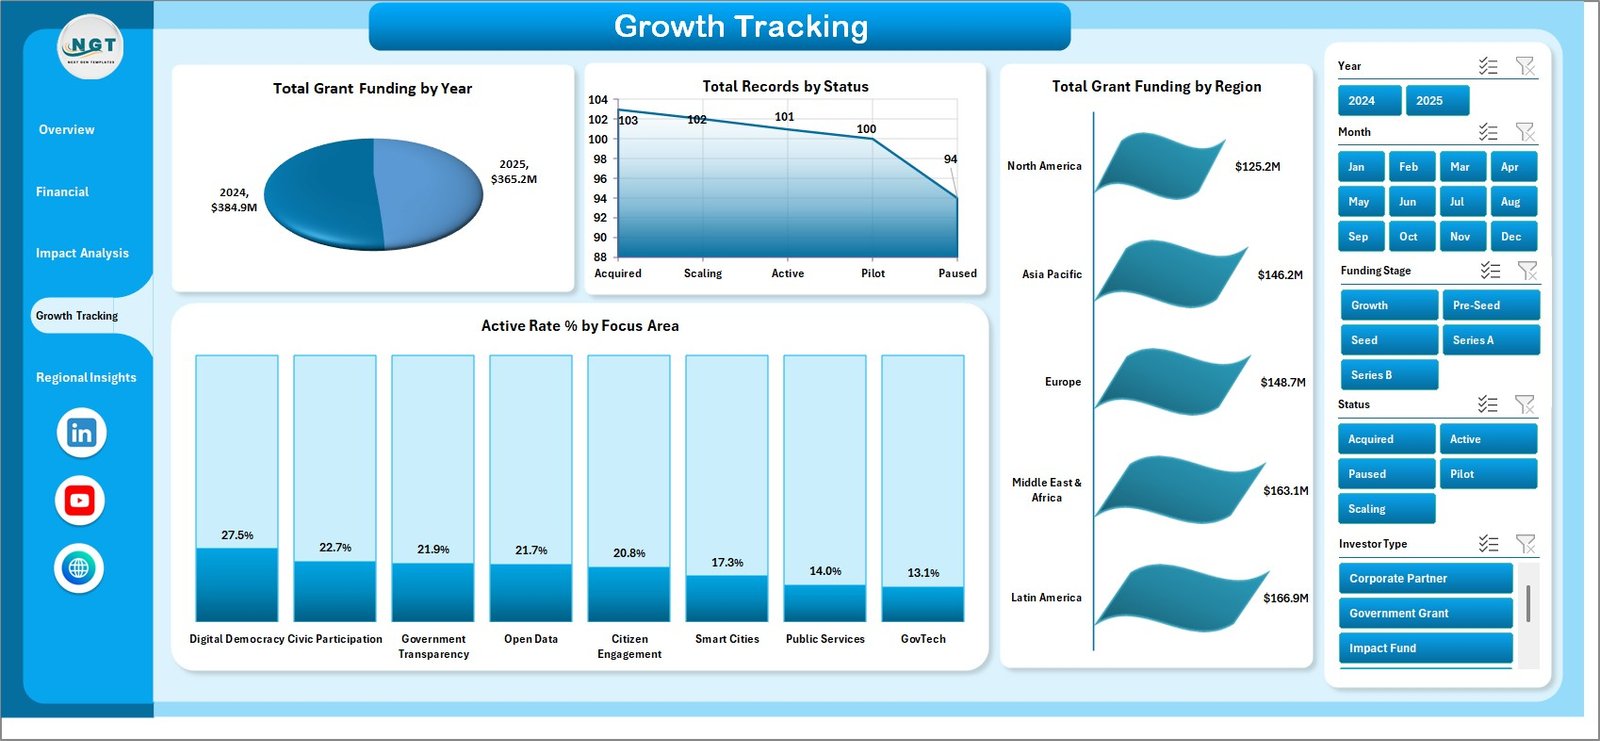
📈 Growth Tracking — Monitors expansion trends with Total Grant Funding by Year, Total Records by Status, Total Grant Funding by Region, and Active Rate % by Focus Area.
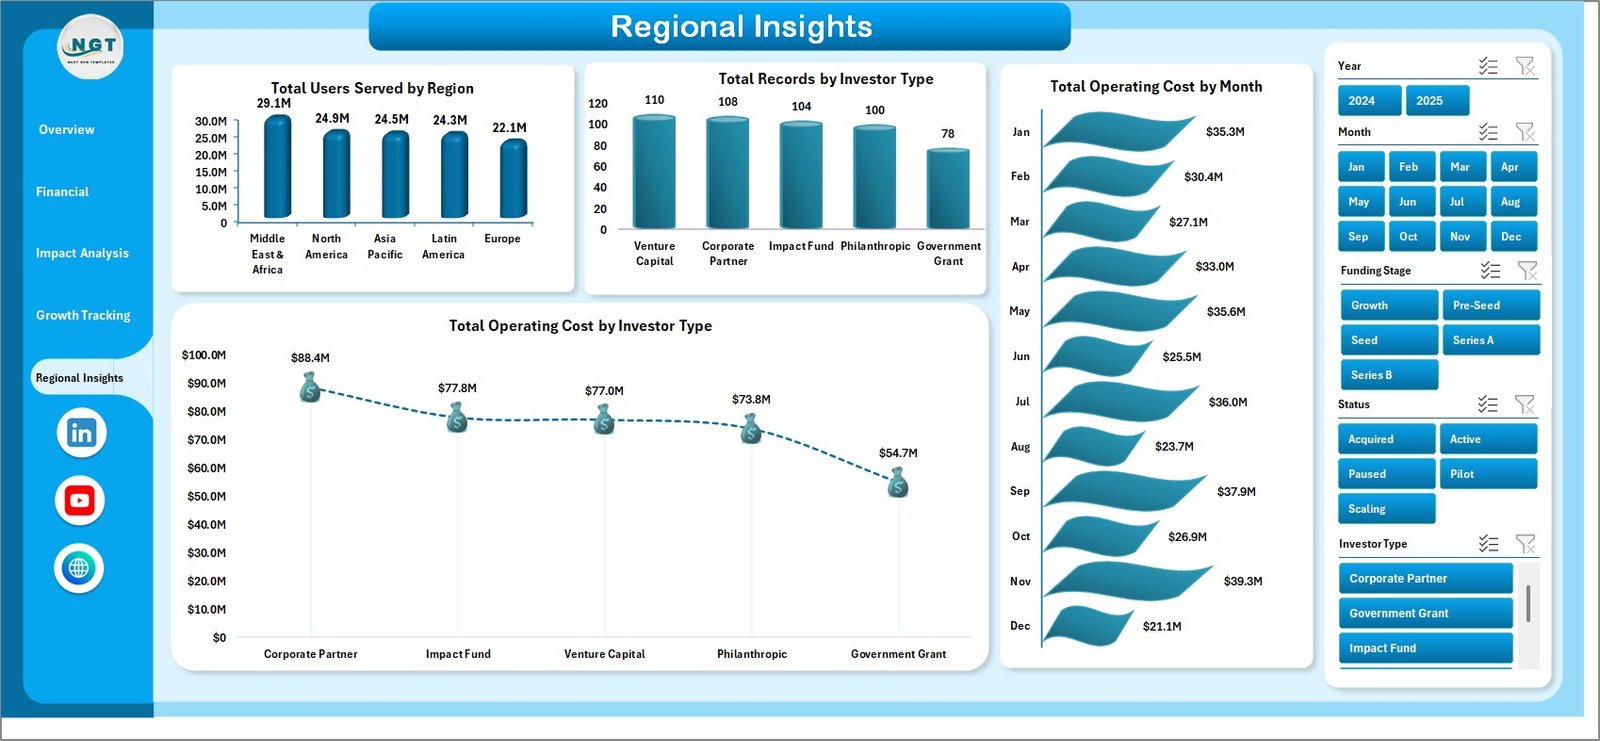
🗺️ Regional Insights — Provides geographic intelligence with Total Users Served by Region, Total Records by Investor Type, Total Operating Cost by Month, and Total Operating Cost by Investor Type.
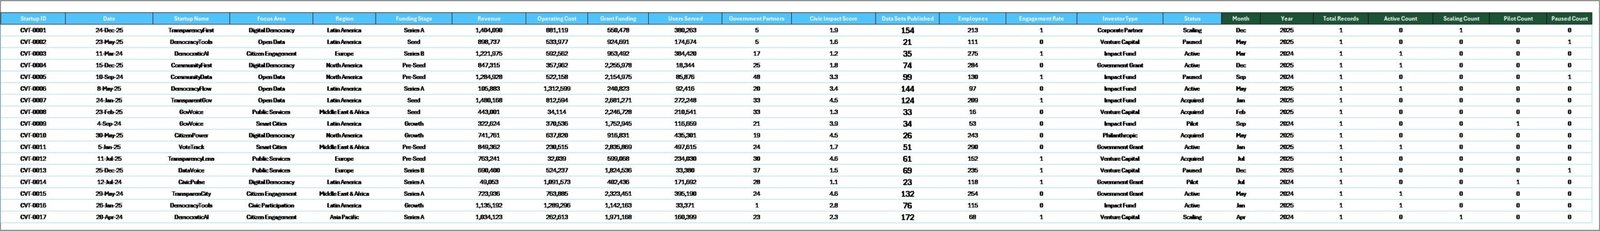
📂 Data Sheet — Your single source of truth where all raw data is entered in a structured, tabular format ready for pivot table consumption.
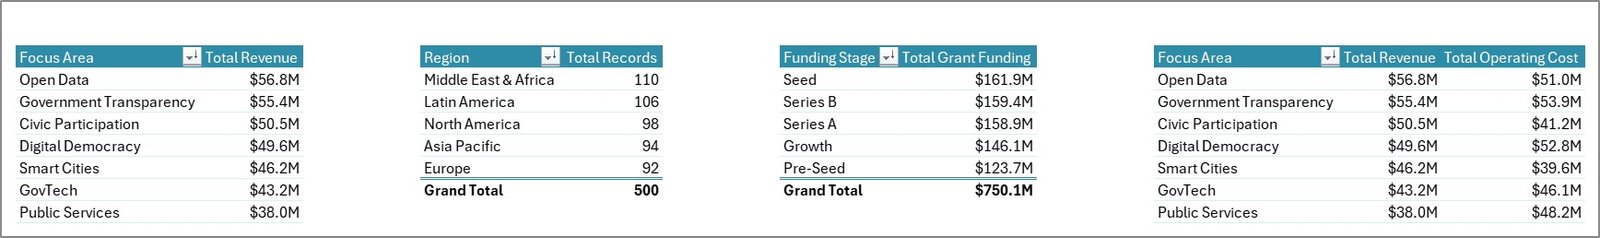
⚙️ Support Sheet — Contains all pivot tables powering the entire dashboard, which can be kept hidden during presentations for a clean, professional look.
⚙️ How to Use the Civic Technology Startups Dashboard in Excel
1️⃣ Open the file and navigate to the Data Sheet tab to enter or paste your civic technology startup data in the existing format.
2️⃣ Go to the Data tab in the Excel Ribbon and click Refresh All to update every pivot table and chart across all five dashboard pages.
3️⃣ Use the interactive slicers on each page to filter the dashboard by Focus Area, Region, Investor Type, Funding Stage, Status, or any other available dimension.
4️⃣ Navigate between the Overview, Financial Overview, Impact Analysis, Growth Tracking, and Regional Insights tabs to explore different angles of your startup performance.
5️⃣ Hide the Support Sheet before sharing or presenting the dashboard for a polished, executive-ready appearance.
👥 Who Can Benefit from This Civic Technology Startups Dashboard in Excel
🏛️ Government Innovation Labs — Track civic tech projects, partner engagement, and public service impact across departments and regions.
💼 Social Impact Investors — Monitor funding allocation, revenue performance, and civic impact scores across a diversified startup portfolio.
🚀 Civic Tech Startup Founders — Gain clear visibility into revenue trends, operating costs, user adoption, and grant utilization to make informed business decisions.
📊 Public Policy Analysts — Evaluate the reach and effectiveness of civic technology initiatives with structured dashboards and technology analytics.
🎓 Academic Researchers — Analyze civic technology ecosystem data with professionally structured Excel dashboards for research papers and publications.
📖 Click here to read the Detailed Blog Post about Civic Technology Startups Dashboard in Excel
🎥 Visit our YouTube channel to learn step-by-step video tutorials
👉 YouTube.com/@NextGenTemplates


Reviews
There are no reviews yet.