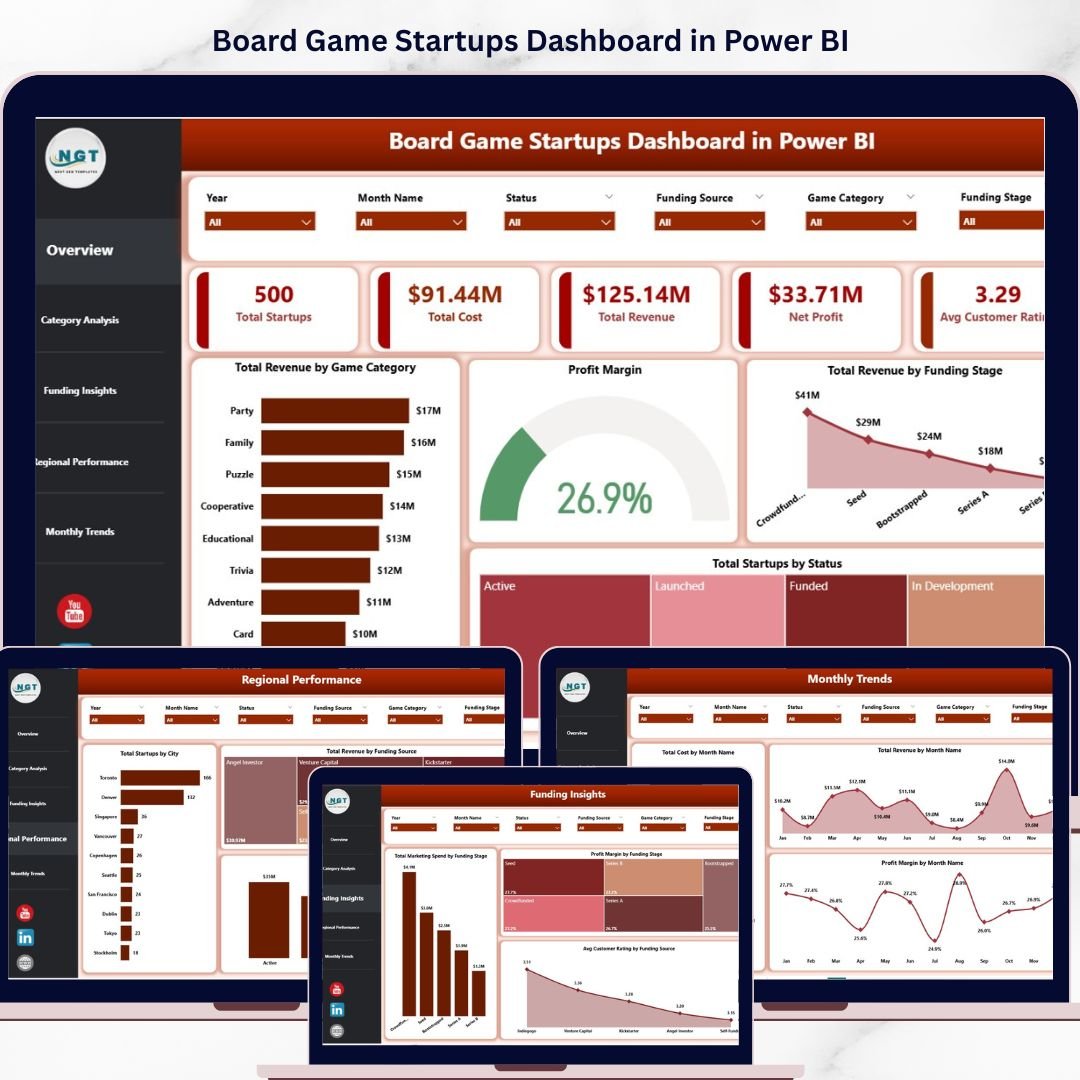
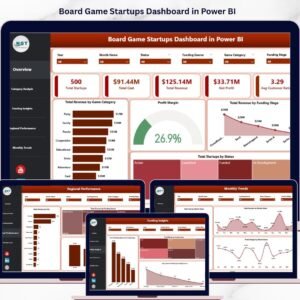
Board Game Startups Dashboard in Power BI is a professionally designed, interactive analytics template built for board game entrepreneurs, tabletop gaming startups, indie game studios, crowdfunding campaign managers, and entertainment business analysts who want to monitor revenue, costs, profit margins, customer ratings, and funding performance from a single centralized Power BI dashboard 🚀. If you are serious about scaling your board game business with data-driven decisions, this ready-to-use Power BI dashboard brings everything together into one powerful analytics hub.
In the competitive board game industry, understanding your financial health, game category trends, distribution channel effectiveness, and funding source ROI can mean the difference between rapid growth and stagnation. This dashboard eliminates guesswork by consolidating your critical business data into five visually rich, filterable pages — each designed to answer specific strategic questions about your board game startup operations. Powered by DAX formulas and interactive slicer filters, every visual updates dynamically for instant contextual analysis.
🔑 Key Features of Board Game Startups Dashboard in Power BI
📊 Five Interactive Dashboard Pages – Navigate across Overview, Category Analysis, Funding Insights, Regional Performance, and Monthly Trends for a complete 360-degree view of your board game startup operations
📈 Professional KPI Card Layout – Monitor Total Startups, Total Cost, Total Revenue, Net Profit, and Avg Customer Rating from dynamic cards on the Overview page for an instant snapshot of business health
🎯 Dynamic Slicer Filters – Instantly filter data by game category, funding stage, distribution channel, city, status, and more for precise drill-down analysis across every page
⚡ DAX-Powered Calculations – All KPIs, measures, and calculated metrics leverage Power BI DAX for lightning-fast performance and automatic data refresh capabilities
🎨 Professional Visual Design – Clean chart layouts with consistent color coding make this dashboard presentation-ready for investors, board meetings, and stakeholder presentations
☁️ Cloud-Ready Publishing – Publish to Power BI Service for team collaboration, scheduled data refreshes, and mobile access from anywhere
🔄 Fully Customizable – Add new KPIs, modify chart types, adjust color themes, and expand the data model to match your specific board game business tracking requirements
📦 What’s Inside the Board Game Startups Dashboard in Power BI
📌 Overview Page – High-level KPI cards displaying Total Startups, Total Cost, Total Revenue, Net Profit, and Avg Customer Rating. Interactive charts show Total Revenue by Game Category, Profit Margin, Total Revenue by Funding Stage, and Total Startups by Status. Multiple slicers enable quick filtered views across every dimension.
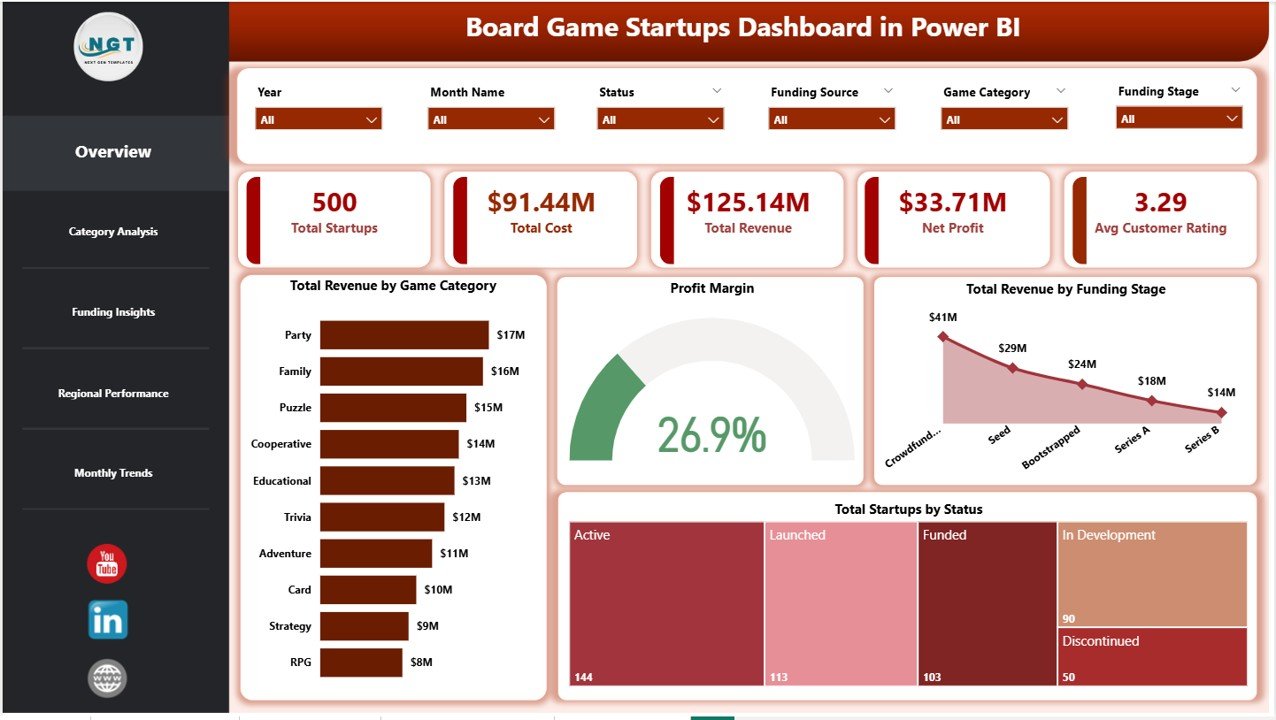 Board Game Startups Dashboard in Power BI
📌 Category Analysis – Deep-dive into game category and distribution channel performance with Total Backers by Game Category, Total Revenue by Distribution Channel, and Profit Margin by Distribution Channel visualizations.
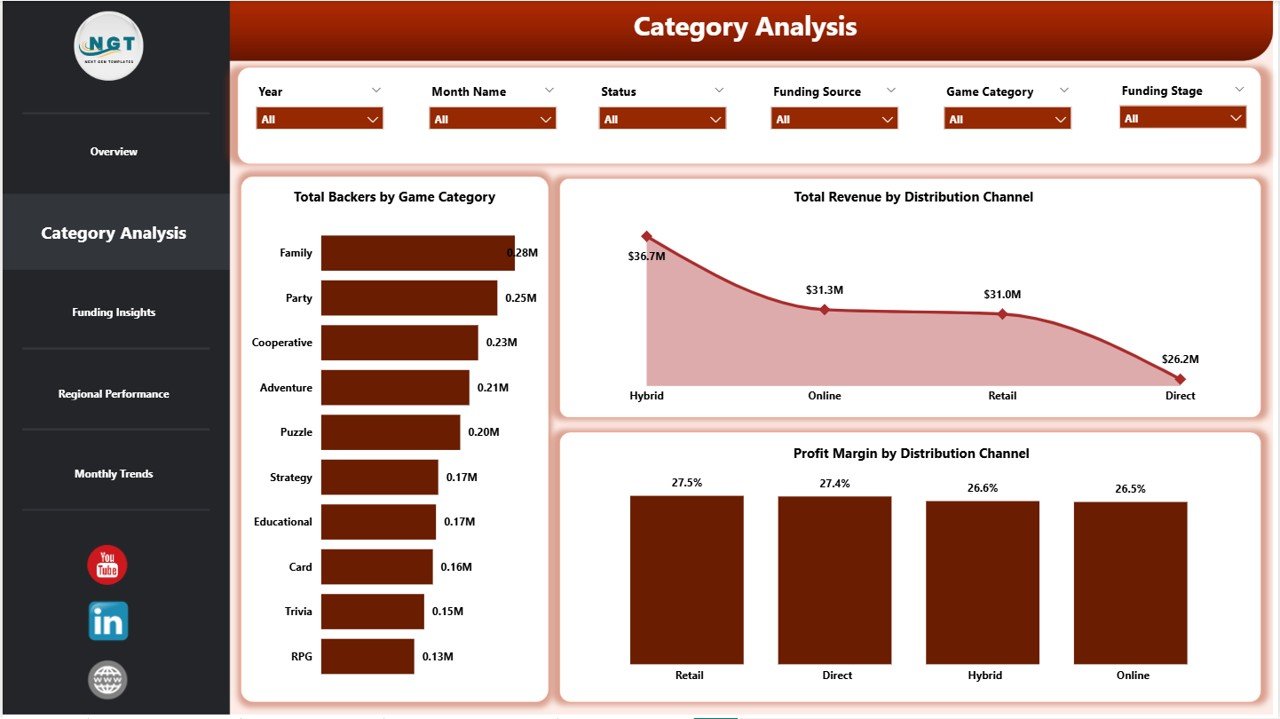 Category Analysis
📌 Funding Insights – Evaluate funding effectiveness with Total Marketing Spend by Funding Stage, Profit Margin by Funding Stage, and Avg Customer Rating by Funding Source charts to understand how different investment paths impact your business.
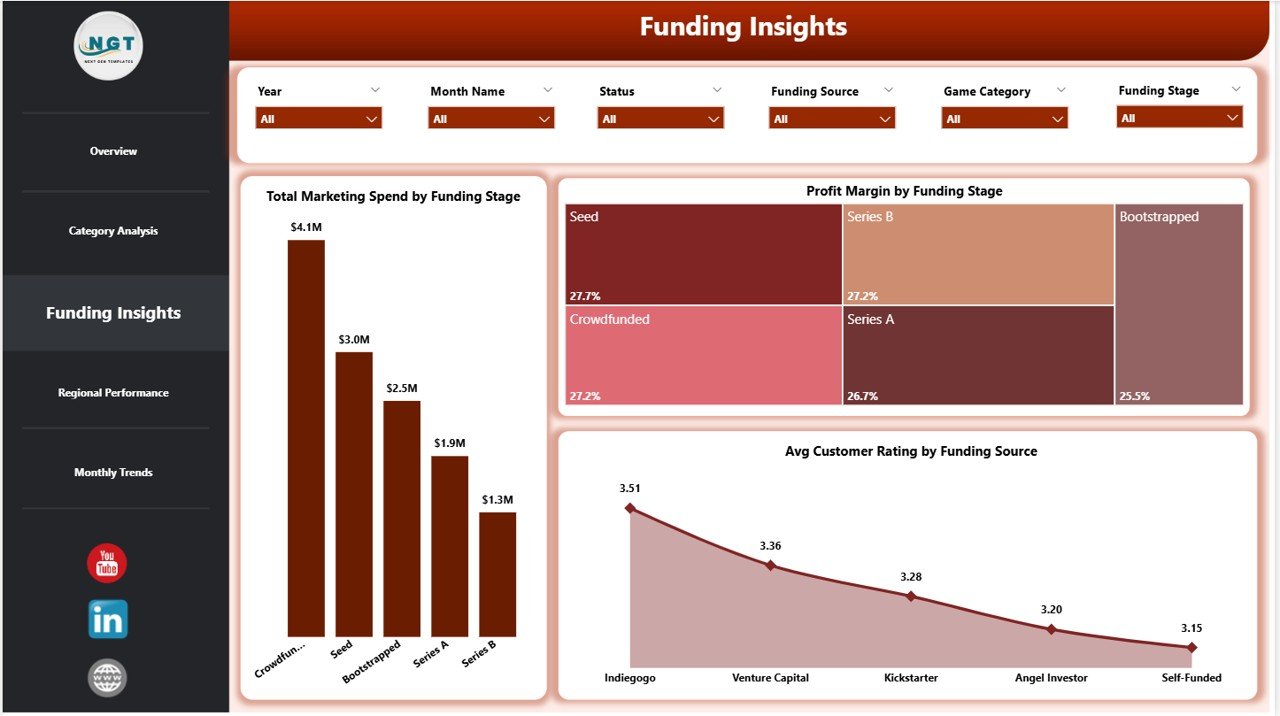 Funding Insights
📌 Regional Performance – Geographic visibility with Total Startups by City, Total Revenue by Funding Source, and Total Revenue by Status to identify your strongest markets and expansion opportunities.
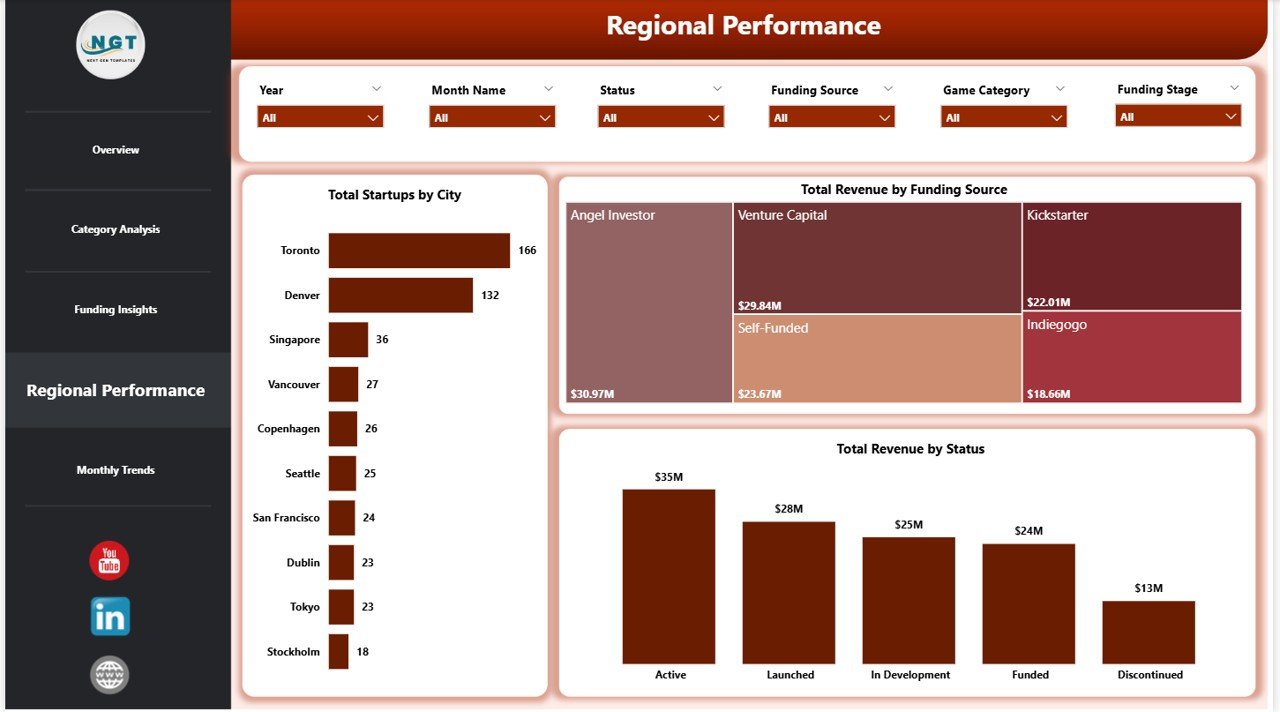 Regional Performance
📌 Monthly Trends – Time-based analysis with Total Cost by Month, Total Revenue by Month, and Profit Margin by Month to identify seasonal patterns, growth trajectories, and cost optimization opportunities across your entire board game startup portfolio.
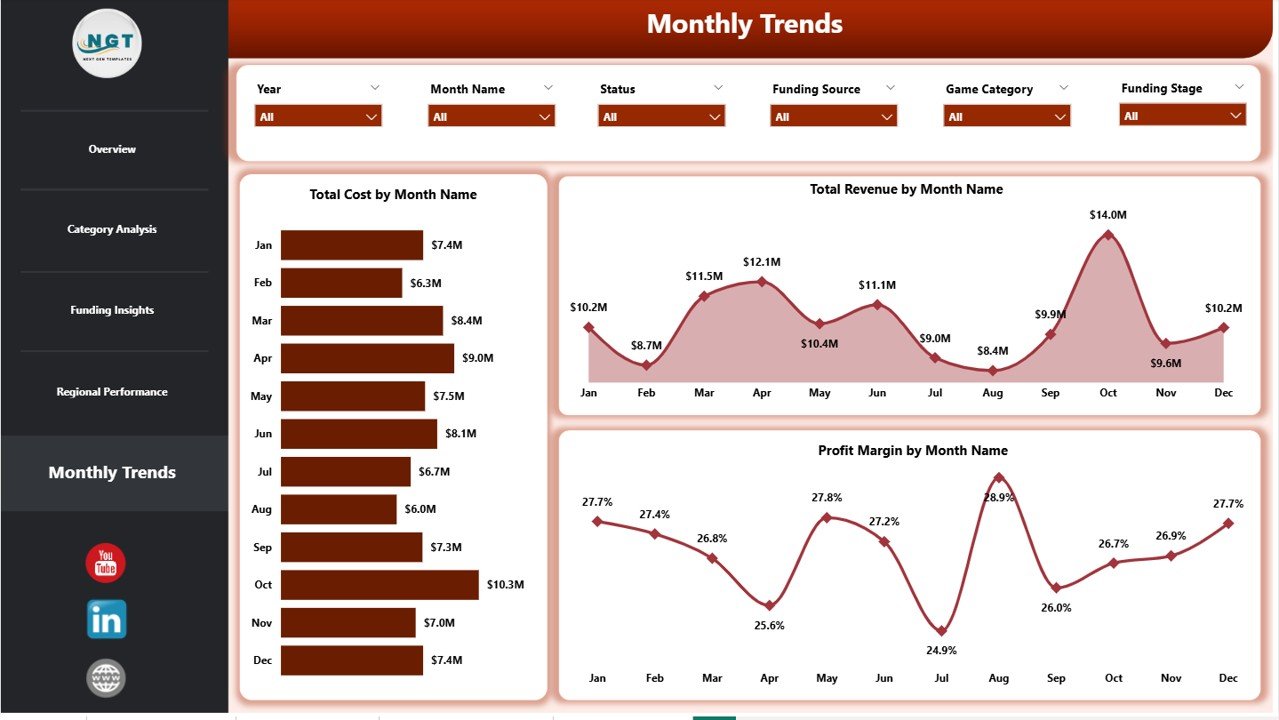 Monthly Trends
⚙️ How to Use the Board Game Startups Dashboard in Power BI
1️⃣ Download and open the .pbix file in Microsoft Power BI Desktop (free from Microsoft)
2️⃣ Explore the five dashboard pages using the page navigation tabs at the bottom
3️⃣ Use the interactive slicer filters to drill down into specific game categories, funding stages, distribution channels, cities, and status categories
4️⃣ Replace the sample data with your actual board game startup records in the data model
5️⃣ Click Refresh to update all DAX measures and visuals automatically across every page
6️⃣ Publish to Power BI Service for cloud-based access, team sharing, and scheduled refreshes
👥 Who Can Benefit from This Board Game Startups Dashboard in Power BI
🎲 Board Game Entrepreneurs tracking revenue, costs, and profit margins across their product portfolio
🎯 Indie Game Studios analyzing game category performance and distribution channel effectiveness
💰 Crowdfunding Campaign Managers monitoring backer counts, funding stage ROI, and marketing spend efficiency
📊 Business Analysts evaluating regional performance, monthly trends, and financial health of gaming startups
🏦 Investors and Accelerators assessing portfolio performance across multiple startup ventures
📖 Click here to read the Detailed Blog Post
🎥 Visit our YouTube channel to learn step-by-step video tutorials
👉 YouTube.com/@NextGenTemplates


Reviews
There are no reviews yet.