


Robotics Training Institutes KPI Dashboard in Power BI is a professionally designed, ready-to-use Power BI template that empowers training center managers, administrators, and decision-makers to monitor, analyze, and optimize key performance indicators critical to the success of robotics education programs. Whether you run a single robotics academy or manage a network of training institutes, this dynamic dashboard transforms raw operational data into clear, actionable intelligence — helping you make smarter decisions faster.
Tracking the right KPIs is the foundation of any high-performing training institute. From enrollment rates and course completion ratios to instructor effectiveness and revenue metrics, this Power BI KPI Dashboard consolidates everything into one interactive reporting hub. Simply connect your data, select the month, and your entire dashboard updates instantly with MTD and YTD comparisons against targets and previous year benchmarks.
🔑 Key Features of Robotics Training Institutes KPI Dashboard in Power BI
📊 Comprehensive KPI Tracking — Monitor all critical training institute metrics including enrollment numbers, completion rates, student satisfaction scores, revenue per student, instructor utilization, and more from a single interactive Power BI dashboard.
📅 Dynamic Month Selection — Select any month from the drop-down filter and the entire dashboard refreshes instantly, showing updated MTD Actual, Target, and Previous Year data with YTD comparisons side by side.
📈 Conditional Formatting with Trend Arrows — Instantly identify whether your KPIs are performing above or below targets with intuitive up and down arrow indicators powered by conditional formatting for both Target vs Actual and Previous Year vs Actual comparisons.
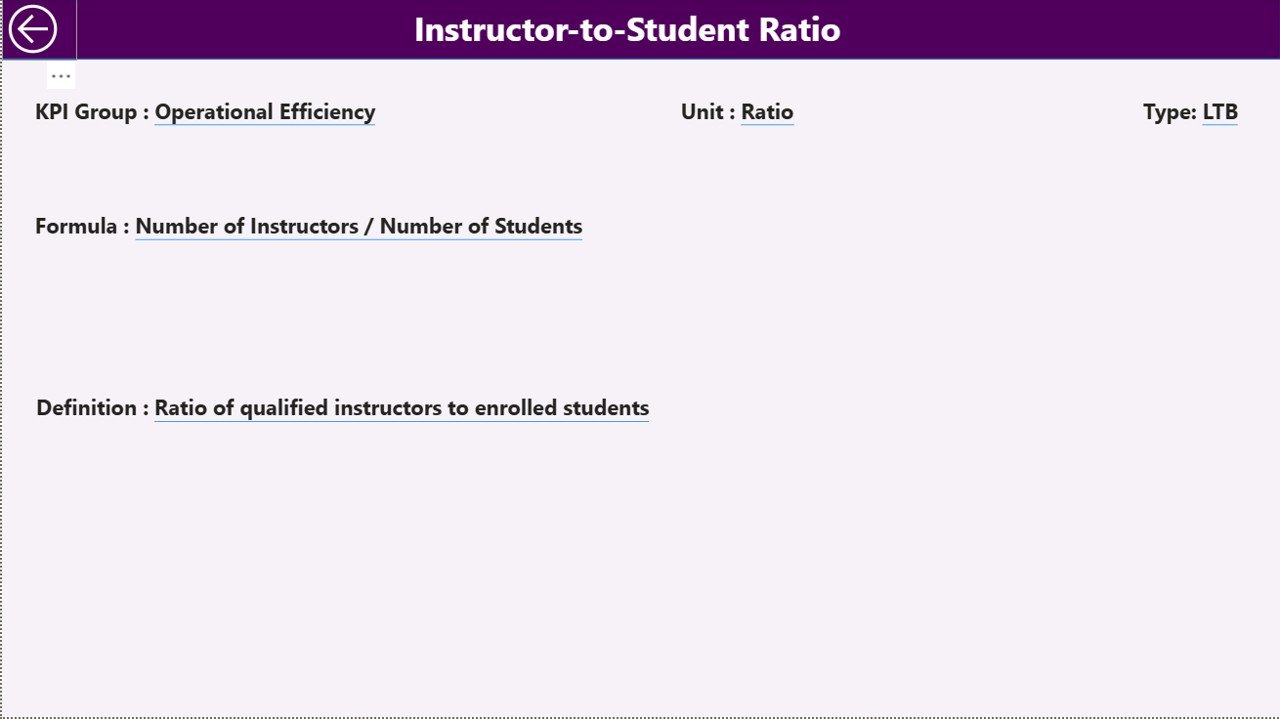
🔍 Individual KPI Deep-Dive Analysis — The dedicated KPI Trend page lets you select any individual KPI from a drop-down to view its group classification, unit, formula, definition, type (Lower the Better or Upper the Better), along with detailed MTD and YTD trend charts.
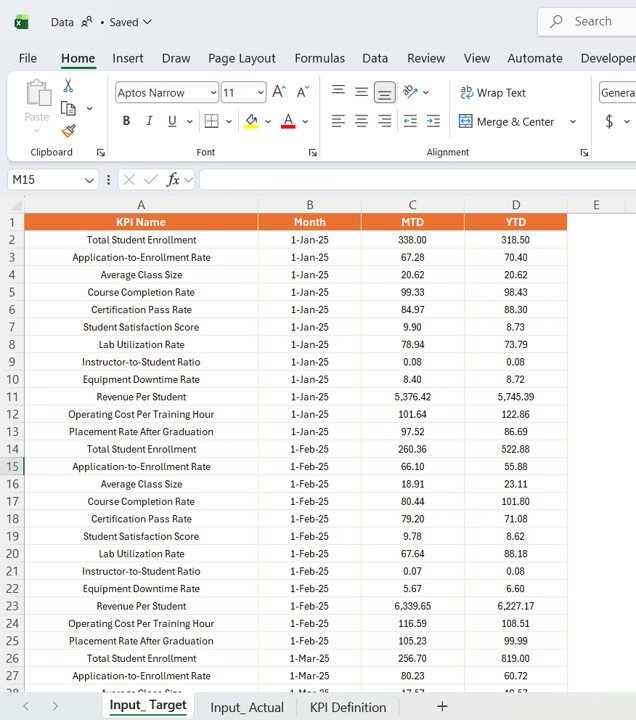
📋 Structured Data Input Pages — Three dedicated input pages for Actual Numbers, Target Numbers, and Previous Year Numbers make data entry organized, consistent, and error-free across all reporting periods.
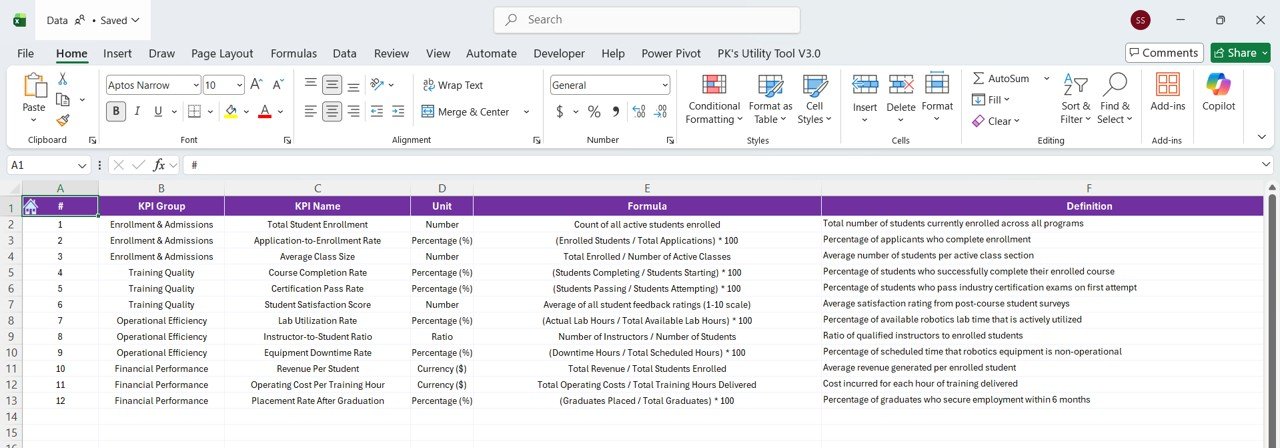
📝 Complete KPI Definition Library — A dedicated KPI Definition page documents every metric’s name, group, unit, formula, definition, and type — ensuring consistent interpretation across your entire team.
 Robotics Training Institutes KPI Dashboard in Power BI
📦 What’s Inside the Robotics Training Institutes KPI Dashboard in Power BI
This Power BI template includes 6 professionally designed pages:
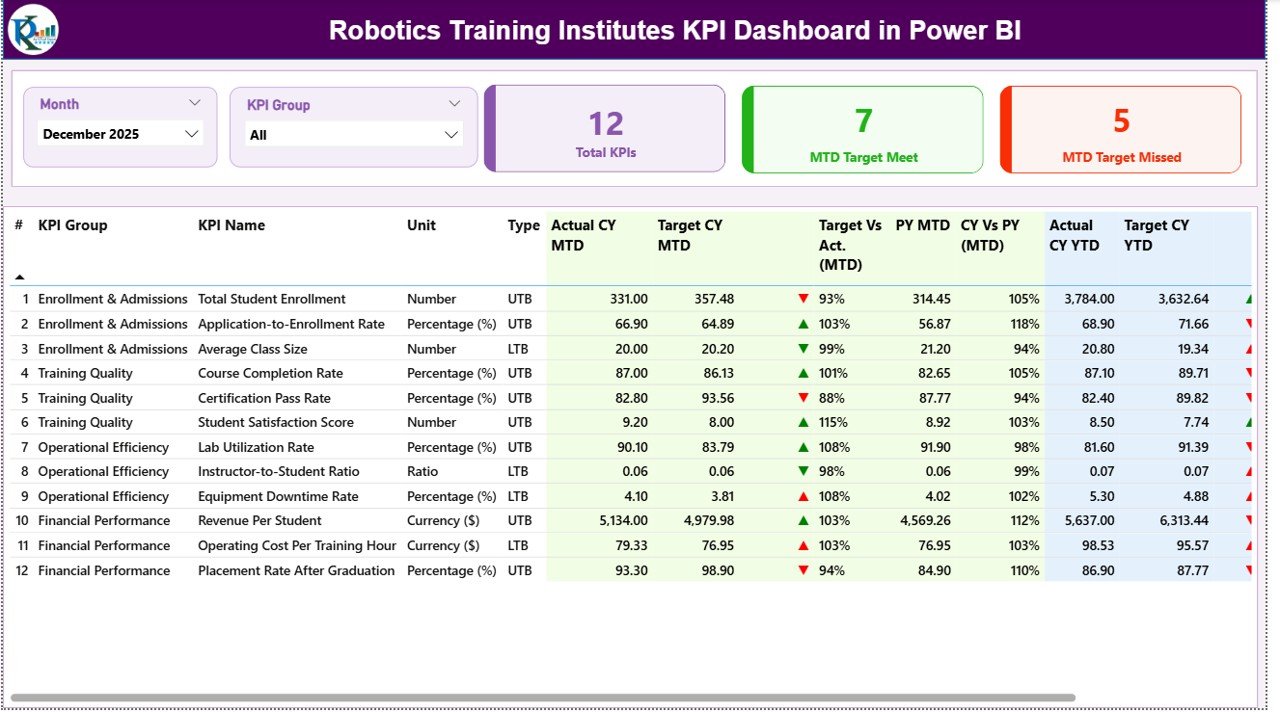
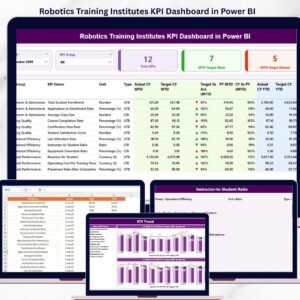
📊 Dashboard Page — The main command center displaying all KPIs at a glance with MTD and YTD Actual, Target, and Previous Year data along with performance comparison arrows.
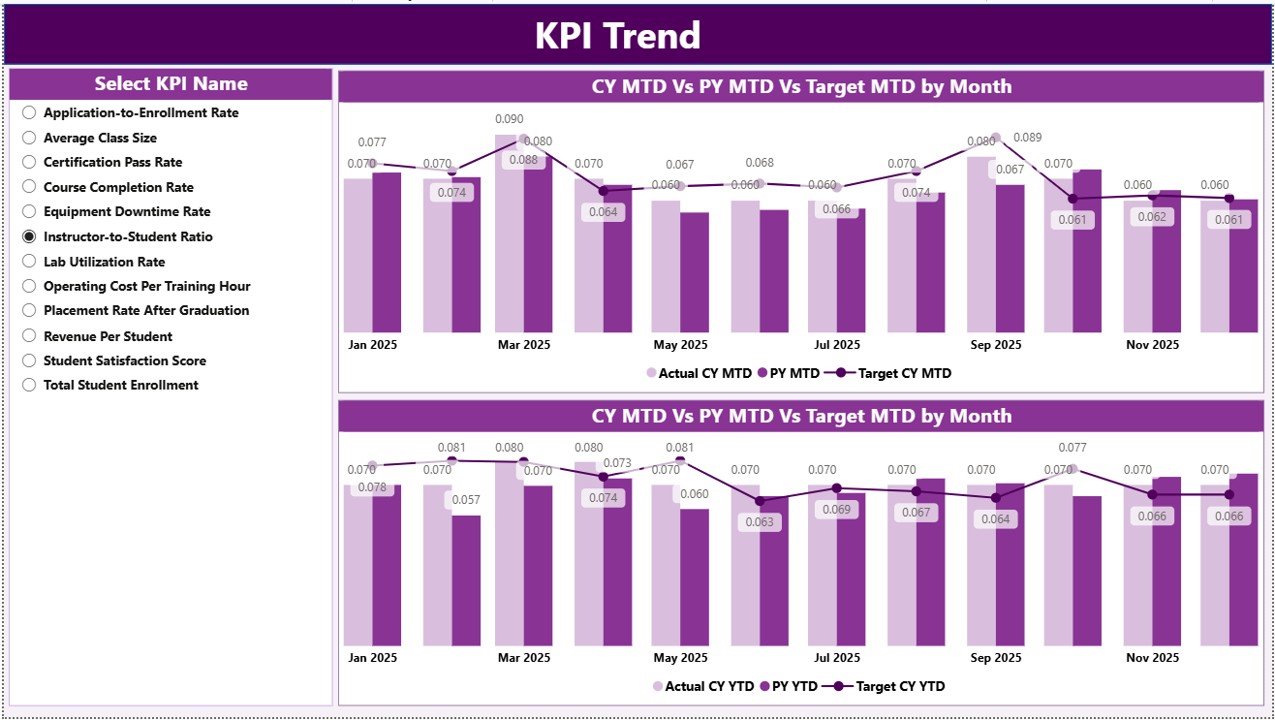
📈 KPI Trend Page — Select any KPI from the drop-down to view its detailed trend analysis with MTD and YTD charts comparing Actual, Target, and Previous Year performance over time.
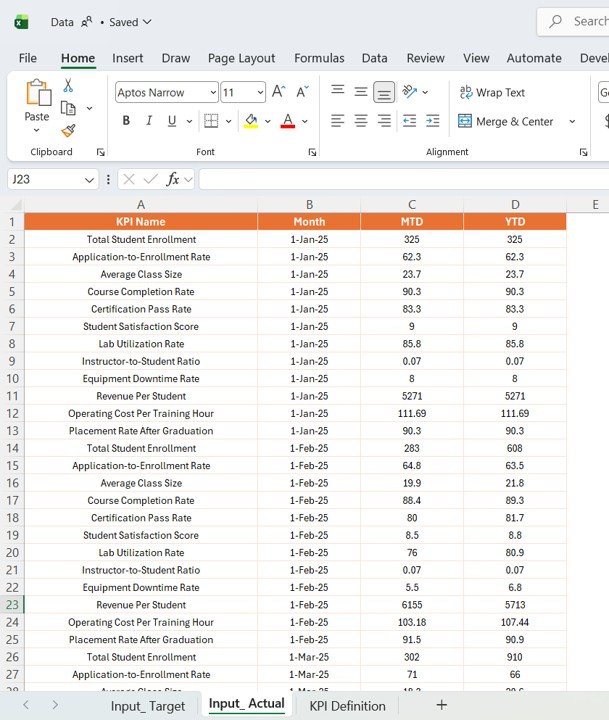
📋 Actual Numbers Input Page — Enter your actual MTD and YTD performance numbers for each KPI organized month by month.
🎯 Target Number Input Page — Input your monthly and yearly target benchmarks for every KPI to enable powerful target vs actual comparisons.
📅 Previous Year Number Page — Record the previous year’s performance data for year-over-year comparison and long-term trend analysis.
📝 KPI Definition Page — Document each KPI’s name, group, unit, formula, definition, and type (LTB or UTB) for standardized understanding across stakeholders.
 KPI Trend Page
⚙️ How to Use the Robotics Training Institutes KPI Dashboard in Power BI
1️⃣ Download and Open — Download the .pbix file and open it in Microsoft Power BI Desktop.
2️⃣ Define Your KPIs — Navigate to the KPI Definition page and enter your institute’s specific KPIs including names, groups, units, formulas, definitions, and types.
3️⃣ Input Your Data — Enter your Actual, Target, and Previous Year numbers in the respective input pages for each month.
4️⃣ Select the Month — Use the month drop-down on the Dashboard page to view KPI performance for any specific period.
5️⃣ Analyze Trends — Switch to the KPI Trend page, select individual KPIs, and review MTD and YTD trend charts to identify patterns and opportunities.
6️⃣ Take Action — Use the insights from conditional formatting arrows and trend charts to make data-driven decisions that improve your training institute’s performance.
 Actual Numbers Input Page
👥 Who Can Benefit from This KPI Dashboard
🎓 Robotics Training Institute Directors — Get a complete performance overview of your academy’s operations and training outcomes.
📊 Training Managers — Track instructor effectiveness, course completion rates, and student engagement KPIs in real time.
💼 Education Administrators — Monitor enrollment trends, revenue targets, and operational efficiency across multiple departments or branches.
📈 Business Analysts — Leverage MTD, YTD, and year-over-year comparisons to build data-driven education performance reports.
🤖 STEM Education Program Coordinators — Evaluate the impact of robotics programs and align resources to improve training quality and student outcomes.
💰 Finance Teams — Track revenue, cost per student, and budget utilization KPIs to ensure financial health of training operations.
 Target Number Input Page


Reviews
There are no reviews yet.