🌟 Turn Celebrity Merchandising Data Into Profitable Insights Instantly!
Managing celebrity merchandise sales, marketing spend, product performance, and customer trends can quickly become complex. But what if you could track everything in one powerful and interactive Excel dashboard?
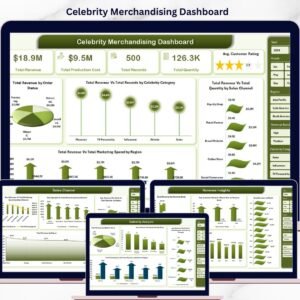
👉 The Celebrity Merchandising Dashboard in Excel is a ready-to-use solution designed to help you analyze revenue, product performance, sales channels, and marketing effectiveness—all in one place.
Whether you are managing celebrity brands, merchandise stores, or marketing campaigns, this dashboard transforms raw data into clear, actionable insights. With just a simple data update and refresh, you can instantly monitor performance and make smarter business decisions.
No complicated formulas. No manual reporting. Just powerful analytics at your fingertips.
🔑 Key Features of Celebrity Merchandising Dashboard in Excel
✨ Multi-Page Interactive Dashboard – Explore insights across Overview, Celebrity Analysis, Product Performance, Sales Channel, and Revenue Insights.
📊 Powerful KPI Monitoring – Track Total Revenue, Customer Ratings, Return Rates, and Marketing Spend.
🎯 Page Navigator for Easy Access – Seamlessly switch between dashboard pages using the left-side navigation panel.
📈 Dynamic Charts & Visuals – Analyze trends using interactive charts across categories and regions.
⚡ Easy Data Update & Refresh – Update your data sheet and refresh to get instant insights.
🧠 Deep Performance Insights – Identify top-performing celebrities, products, and sales channels.
🌍 Regional & Channel Analysis – Understand how revenue and performance vary across regions and platforms.
📅 Monthly Trend Tracking – Monitor revenue and cost trends over time for better planning.
📦 What’s Inside the Celebrity Merchandising Dashboard in Excel

📁 5 Fully Designed Dashboard Pages
- Overview Dashboard
- Celebrity Analysis
- Product Performance
- Sales Channel Analysis
- Revenue Insights
📊 Pre-Built Charts & KPIs
- Total Revenue by Order Status
- Revenue by Celebrity Category & Name
- Product Category Performance
- Sales Channel Analysis
- Monthly Revenue & Cost Trends
🎛️ Interactive Slicers & Filters
- Filter by Celebrity
- Filter by Product Category
- Filter by Region
- Filter by Sales Channel
📂 Data Sheet & Support Sheet Included
- Easy data input structure
- Backend pivot tables for automation
- Smooth and fast dashboard updates
⚙️ How to Use the Celebrity Merchandising Dashboard in Excel
1️⃣ Open the Excel dashboard file
2️⃣ Enter or update your data in the Data Sheet
3️⃣ Use the Page Navigator to switch between dashboard views
4️⃣ Apply slicers to filter data dynamically
5️⃣ Analyze charts and KPIs to make data-driven decisions
💡 No advanced Excel skills required—this dashboard is built for simplicity and efficiency.
👥 Who Can Benefit from This Celebrity Merchandising Dashboard in Excel
🎤 Celebrity Brand Managers – Track merchandise performance and revenue growth
🛍️ E-commerce Businesses – Monitor product sales and customer behavior
📊 Marketing Teams – Analyze marketing spend vs revenue performance
📈 Business Analysts – Gain deep insights into merchandising data
🏢 Retail Managers – Optimize product and channel strategies
This dashboard simplifies complex merchandising data into clear, actionable insights. As a result, you can improve profitability, optimize marketing strategies, and boost overall sales performance.
Instead of relying on multiple reports, you can now manage everything in one centralized dashboard—efficiently and professionally.
📖 Click here to read the Detailed blog post
🎥 Visit our YouTube channel to learn step-by-step video tutorials
👉 https://youtube.com/@PKAnExcelExpert
Compatibility and Requirements
- Works in Microsoft Excel desktop (Excel 2016 or later, or Microsoft 365).
- The dashboard uses slicers to filter by celebrity, product category, region and sales channel. Microsoft explains them in Use slicers to filter data.
Frequently Asked Questions
How many dashboard pages are included?
Five pages: Overview, Celebrity Analysis, Product Performance, Sales Channel Analysis and Revenue Insights. A left-side page navigator switches between them.
How do I update the dashboard with my own data?
Enter or update your figures in the Data Sheet, then refresh the file. The backend pivot tables and charts pick up the new data.
Which filters can I use?
Slicers filter the dashboard by celebrity, product category, region and sales channel.
What KPIs and charts does it show?
It tracks Total Revenue, Customer Ratings, Return Rates and Marketing Spend. Charts cover revenue by order status, revenue by celebrity category and name, product category performance, sales channels, and monthly revenue and cost trends.
Is there a Power BI version?
Yes. See the Celebrity Merchandising Dashboard in Power BI.
Related Dashboard Templates
- Celebrity Merchandising Dashboard in Power BI: the same merchandising analysis in Power BI
- Celebrity Management Dashboard in Excel: a dashboard for managing celebrity activity
- Celebrity Management Dashboard in Power BI: the Power BI edition of the management dashboard
- Finance Summary Dashboard in Excel: a finance view to pair with your sales data
- KPI Dashboard Library (Excel): 15 KPI dashboard templates in one download
Browse all Excel dashboards.