Managing a rehabilitation center requires constant monitoring of performance, patient outcomes, and operational efficiency. However, tracking multiple KPIs across different sheets and reports can quickly become overwhelming and inefficient.
Introducing the Rehabilitation Homes KPI Dashboard in Excel – a smart, ready-to-use template designed to simplify KPI tracking, improve performance visibility, and support data-driven decision-making.
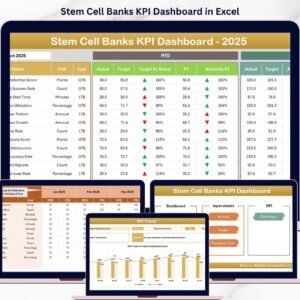
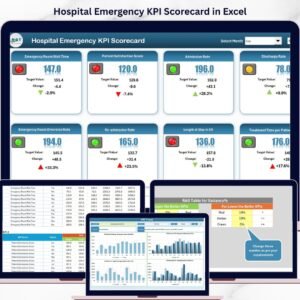
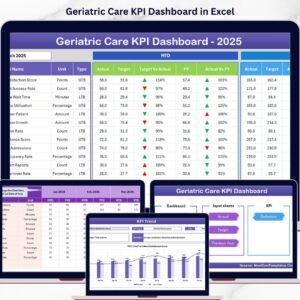
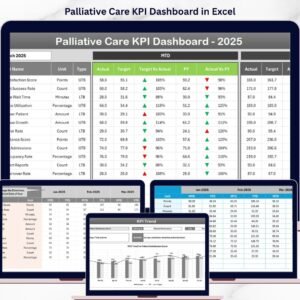
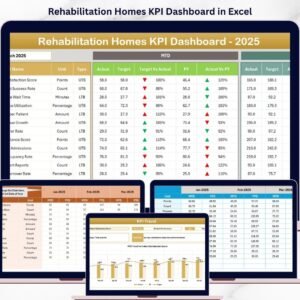
This dynamic Excel dashboard transforms complex data into clear, visual insights. It allows you to monitor Month-to-Date (MTD) and Year-to-Date (YTD) performance, compare actual vs target vs previous year, and instantly identify performance gaps using intuitive indicators.
Whether you are focused on patient care, operational efficiency, or compliance tracking, this dashboard ensures you stay informed and in control at all times.
🚀 Key Features of Rehabilitation Homes KPI Dashboard in Excel
📊 Interactive KPI Dashboard – Monitor performance with dynamic month selection
📅 MTD & YTD Comparison – Analyze actual, target, and previous year data side-by-side
📈 Visual Trend Charts – Track KPI performance over time with clear insights
🔺 Conditional Formatting Indicators – Instantly identify performance gaps using arrows
📘 Detailed KPI Definitions – Understand KPIs with formulas, units, and types
📥 Structured Input Sheets – Easily enter actual, target, and previous year data
🧭 Easy Navigation System – Use clickable buttons to switch between sheets
🎯 Customizable KPI Framework – Adapt KPIs based on your rehabilitation center needs
📦 What’s Inside the Rehabilitation Homes KPI Dashboard in Excel
This template includes 7 well-organized worksheets for complete KPI management:
🏠 Home Sheet – Central navigation hub with quick-access buttons
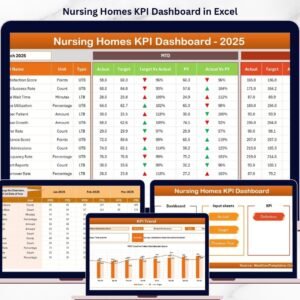
📊 Dashboard Sheet – View all KPIs with MTD and YTD comparisons
📈 KPI Trend Sheet – Deep dive into individual KPI performance
📥 Actual Data Sheet – Input real-time performance data
🎯 Target Data Sheet – Set KPI goals for benchmarking
📅 Previous Year Sheet – Track historical performance
📘 KPI Definition Sheet – Maintain KPI formulas, units, and classifications
Additionally, the dashboard includes drop-down selections, automated calculations, and interactive visuals to ensure smooth and effective analysis.
⚙️ How to Use the Rehabilitation Homes KPI Dashboard in Excel
Getting started is quick and simple:
1️⃣ Enter Data – Input actual, target, and previous year values
2️⃣ Select Month – Choose the required month from the dropdown
3️⃣ Review Dashboard – Instantly view KPI updates and comparisons
4️⃣ Analyze Trends – Use KPI Trend sheet for deeper insights
5️⃣ Take Action – Improve performance based on insights
👉 Within minutes, you can turn your rehabilitation data into meaningful decisions.
👥 Who Can Benefit from This Rehabilitation Homes KPI Dashboard in Excel
This dashboard is designed for healthcare professionals and decision-makers:
🏥 Rehabilitation Center Managers – Monitor operational performance
👨⚕️ Healthcare Administrators – Track patient outcomes and efficiency
📊 Data Analysts – Perform detailed KPI analysis
📋 Quality Assurance Teams – Ensure compliance and performance standards
🏢 Healthcare Organizations – Improve reporting and strategic planning
👉 In short, anyone responsible for rehabilitation performance tracking will benefit from this tool.
With its intuitive interface, powerful analytics, and flexible customization, this dashboard helps you improve operational efficiency, enhance patient care, and make smarter decisions.
Stop relying on manual reports and scattered data.
👉 Download now and take full control of your rehabilitation center performance! 🚀
📖 Click here to read the Detailed blog post
🎥 Visit our YouTube channel to learn step-by-step video tutorials
👉 https://www.youtube.com/@PKAnExcelExpert
Compatibility and Requirements
- Works in Microsoft Excel desktop (Excel 2016 or later, or Microsoft 365).
- You pick the month from a dropdown on the Dashboard sheet. Microsoft explains how in Create a drop-down list.
Frequently Asked Questions
Which worksheets are included?
Seven worksheets: Home, Dashboard, KPI Trend, Actual Data, Target Data, Previous Year and KPI Definition.
How do I update the dashboard?
Enter your actual, target and previous year values in their input sheets. Then choose a month from the dropdown on the Dashboard sheet and the KPIs update.
Can I compare MTD and YTD results?
Yes. The Dashboard sheet shows Month-to-Date and Year-to-Date figures, comparing actual against target and against the previous year.
How do I see the trend for one KPI?
Open the KPI Trend sheet to review the performance of a single KPI over time.
Is there a Power BI version?
Yes. See the Rehabilitation Homes KPI Dashboard in Power BI.
Related Healthcare KPI Templates
- Rehabilitation Homes KPI Dashboard in Power BI: the same dashboard for Power BI
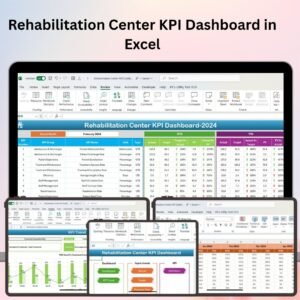
- Rehabilitation Center KPI Dashboard in Excel: a KPI dashboard for rehabilitation centers
- Nursing Homes KPI Dashboard in Excel: a similar KPI dashboard for nursing homes
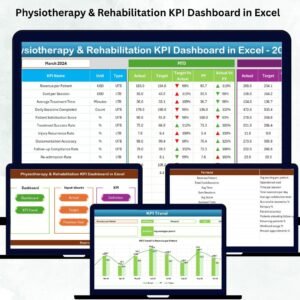
- Physiotherapy & Rehabilitation KPI Dashboard in Excel: KPIs for physiotherapy and rehabilitation
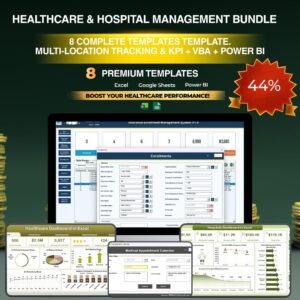
- Healthcare & Hospital Management Bundle: 8 healthcare templates in one download
Browse all Excel KPI dashboards.