



Key Features of Telemedicine Platforms KPI Dashboard
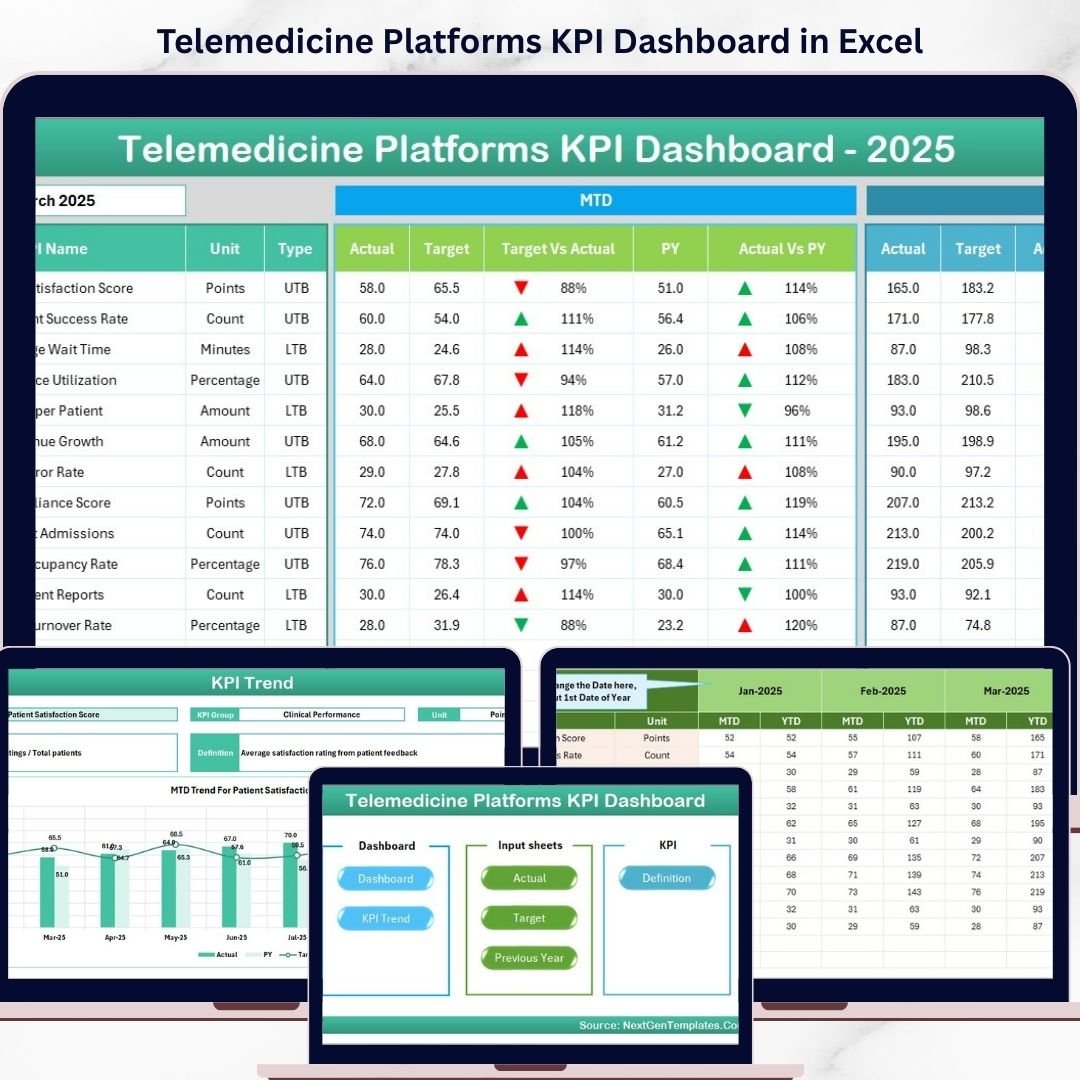
Unlock the power of data-driven decision making with our Telemedicine Platforms KPI Dashboard, designed specifically to streamline the performance tracking of telemedicine services. This comprehensive digital product features 7 intuitive worksheets that provide a holistic view of your KPIs, helping you monitor, analyze, and optimize your telemedicine platform’s performance with ease.
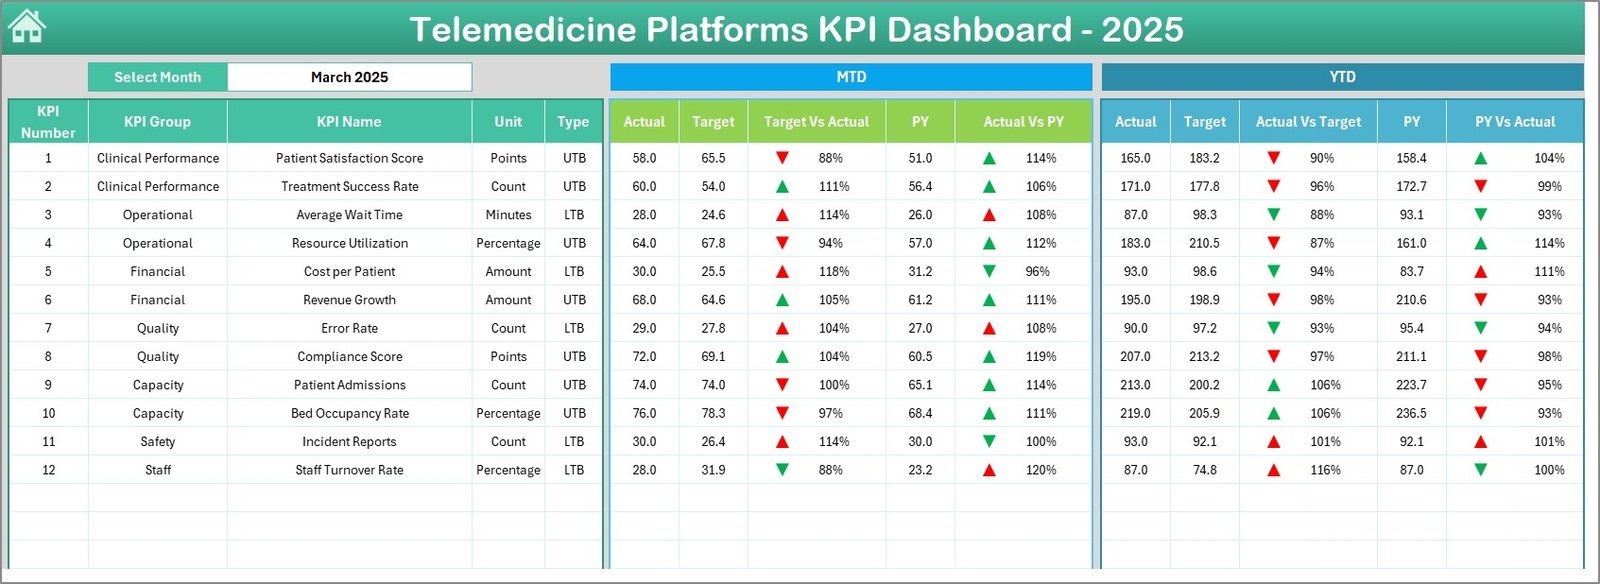
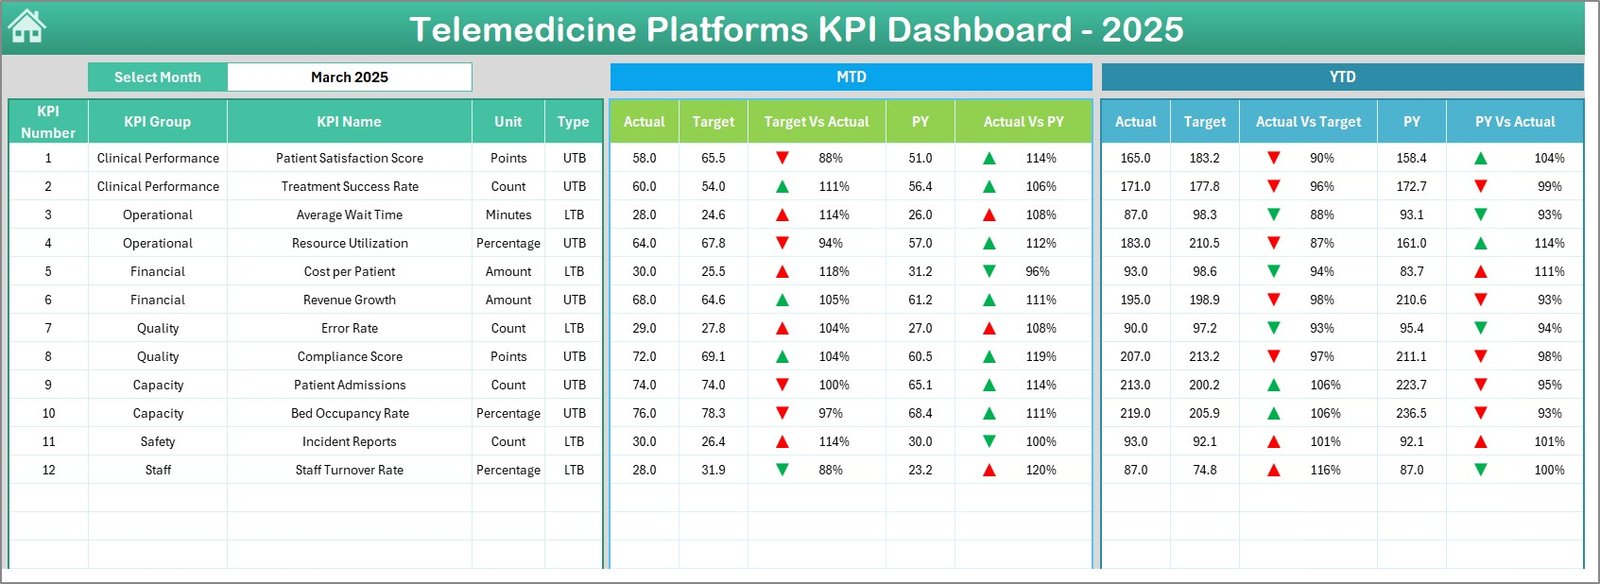
Start at the Home sheet, your control center, where six easy-to-use buttons allow you to jump to any key section of the dashboard instantly. The Dashboard sheet is the powerhouse, presenting Monthly and Year-to-Date (MTD & YTD) actuals, targets, and previous year data side-by-side for quick comparison. Dynamic drop-down filters let you select the month, updating all data instantly. Conditional formatting with up/down arrows highlights KPI trends, giving you instant visual feedback on performance against targets and previous periods.
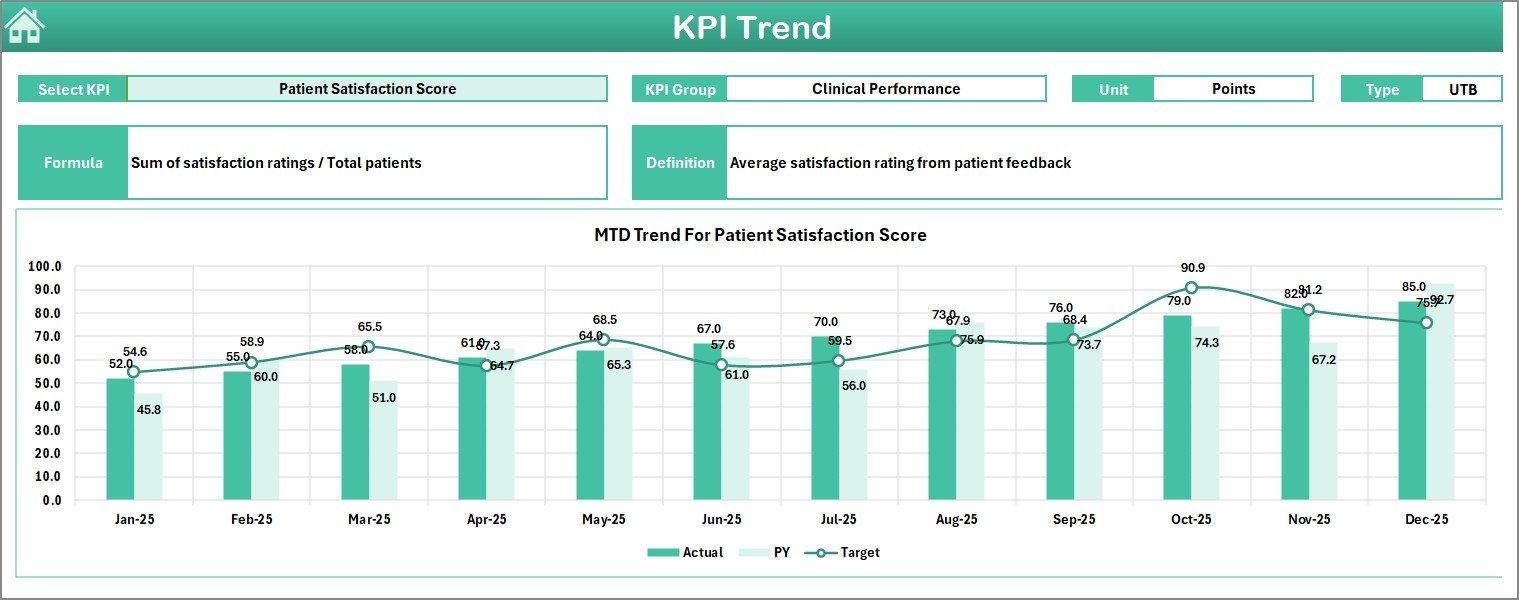
Delve deeper with the KPI Trend sheet, where you can select any KPI to see detailed trends over time. This sheet provides KPI groupings, units, formula explanations, and definitions-making it easy to understand what each KPI measures and how it impacts your telemedicine platform. The interactive charts showcase MTD and YTD trends for actual, target, and previous year values, empowering you to pinpoint performance patterns and areas for improvement.
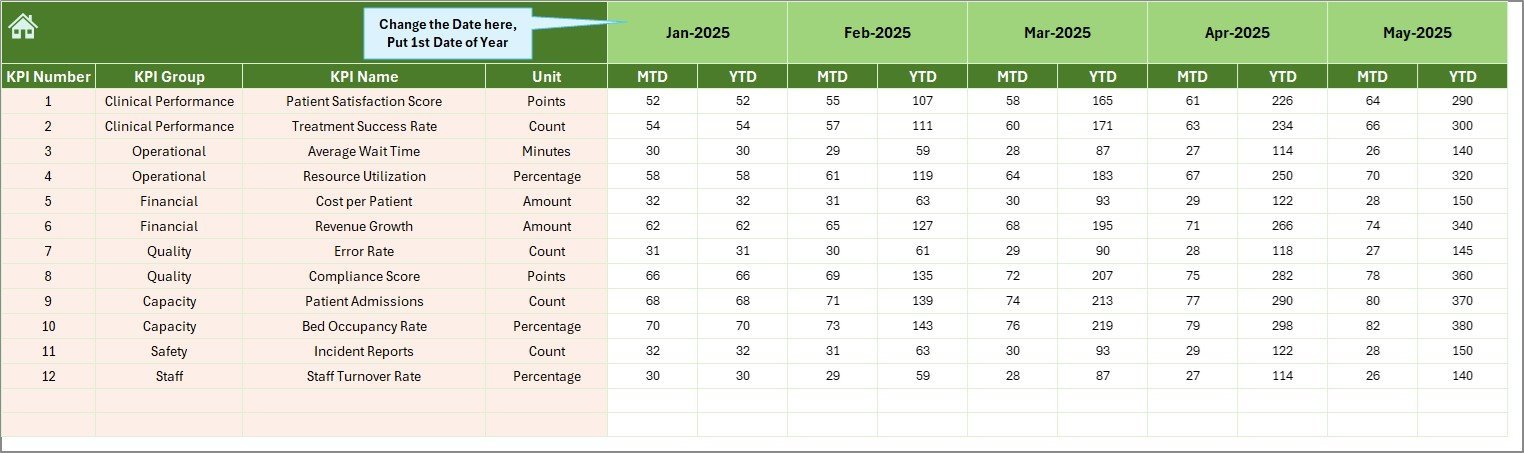
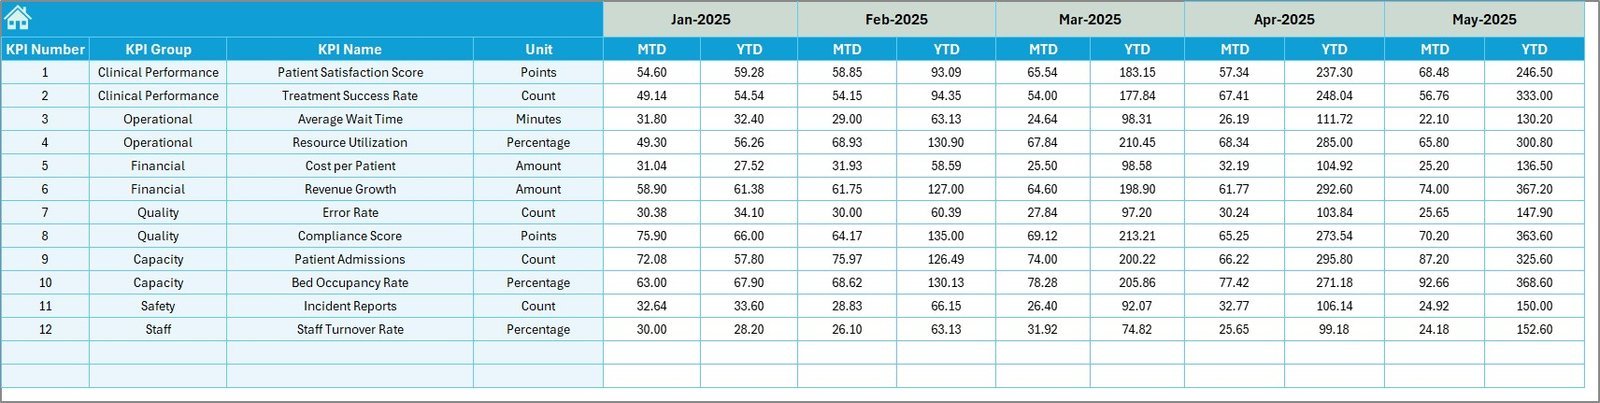
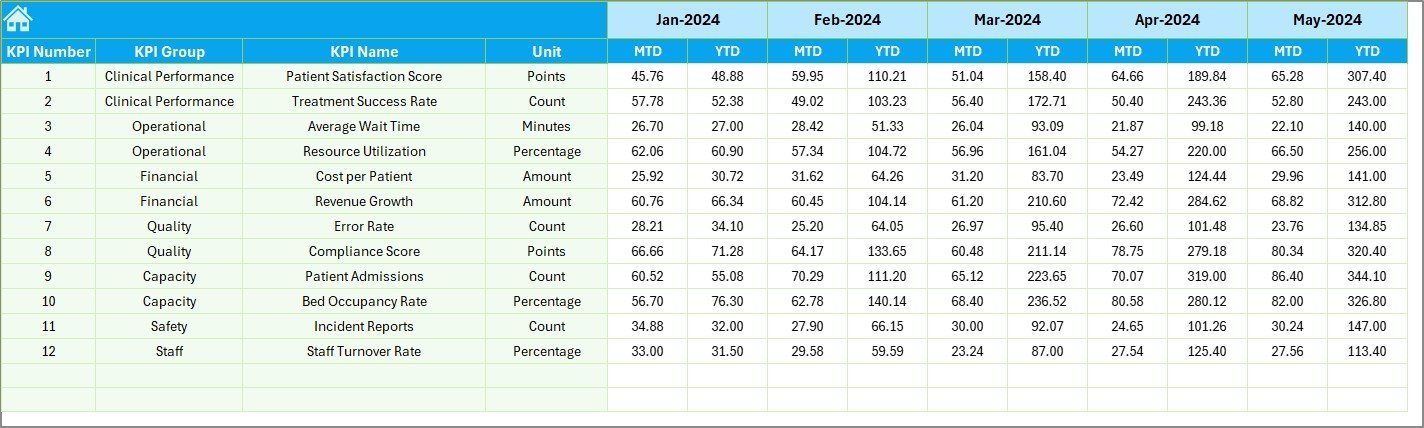
Data input is made simple and organized through three dedicated sheets: the Actual Numbers Input sheet, Target Number Input sheet, and Previous Year Number Input sheet. Easily enter or update monthly and yearly performance numbers with clear instructions and flexible month selection options. This structure ensures accurate and consistent data management, which is critical for reliable KPI tracking.
Last but not least, the KPI Definition sheet offers a centralized location to manage and customize your KPIs. Enter KPI names, groupings, units, formulas, and definitions, along with specifying whether a KPI is “Lower the Better” (LTB) or “Upper the Better” (UTB). This customization ensures your dashboard reflects your unique telemedicine platform’s objectives and performance indicators.
What’s Inside the Telemedicine Platforms KPI Dashboard
- 🏠 Home Sheet: Navigate easily with 6 shortcut buttons for seamless user experience.
- 📊 Dashboard Sheet: Real-time MTD & YTD comparisons with targets and previous year’s KPIs.
- 📈 KPI Trend Sheet: Dynamic KPI selection with detailed descriptions and trend charts.
- 📝 Actual Numbers Input: Input monthly and yearly actual performance data with flexible date settings.
- 🎯 Target Number Input: Define monthly and yearly targets for every KPI.
- 📅 Previous Year Numbers: Enter last year’s data for accurate trend comparison.
- 📚 KPI Definition Sheet: Customize KPI names, formulas, units, and performance types (LTB or UTB).
How to Use the Telemedicine Platforms KPI Dashboard
Getting started is quick and straightforward. First, enter your baseline data in the Actual Numbers Input sheet, then set your goals in the Target Number Input sheet. Add last year’s data for benchmarking in the Previous Year Number sheet. Customize your KPIs on the KPI Definition sheet to match your telemedicine platform’s unique metrics.
Navigate to the Dashboard sheet to monitor your performance monthly or yearly by selecting the desired month from the drop-down. The dashboard presents clear visual cues with conditional formatting arrows, showing if you are meeting or exceeding your targets.
Use the KPI Trend sheet to dive deeper into individual KPI trends over time, making it easier to identify patterns and make informed decisions. The home sheet always keeps navigation simple, allowing you to jump between sections effortlessly.
Who Can Benefit from This Telemedicine Platforms KPI Dashboard
This dashboard is tailor-made for:
- 💼 Telemedicine Executives & Managers: Track platform performance and make data-backed strategic decisions.
- 📊 Data Analysts: Analyze trends, create reports, and provide actionable insights with ease.
- 🏥 Healthcare Providers: Monitor telemedicine service delivery and patient engagement KPIs.
- 🖥️ IT & Product Teams: Evaluate platform usage, efficiency, and technical KPIs for continuous improvement.
- 📈 Business Development Teams: Identify growth opportunities and align goals with performance metrics.
- 🎯 Consultants & Advisors: Provide clients with a powerful tool to measure telemedicine success.
Whether you’re running a small telemedicine startup or managing a large-scale platform, this KPI dashboard provides clarity, precision, and actionable insights to elevate your telemedicine business to the next level.
Click here to read the Detailed blog post.
Visit our YouTube channel to learn step-by-step video tutorials.
Compatibility and Requirements
- Works in Microsoft Excel desktop (Excel 2016 or later, or Microsoft 365).
- You pick the month and the KPI from drop-down lists. Microsoft’s guide to creating a drop-down list explains how they work.
Frequently Asked Questions
How many worksheets are in the Telemedicine Platforms KPI Dashboard?
Seven: Home, Dashboard, KPI Trend, Actual Numbers Input, Target Number Input, Previous Year Number Input and KPI Definition.
How do I view a different month?
Select the month from the drop-down on the Dashboard sheet. MTD and YTD actuals, targets and previous year figures update, with arrows that show the trend.
Can I change the KPIs to match my platform?
Yes. Enter KPI names, groups, units, formulas and definitions on the KPI Definition sheet and set each one as LTB (Lower the Better) or UTB (Upper the Better).
What does the KPI Trend sheet show?
Select a KPI to see its group, unit, formula and definition, with MTD and YTD charts for actual, target and previous year values.
Related Telehealth Templates
- Telemedicine Platforms KPI Dashboard in Power BI: the same KPIs in Power BI.
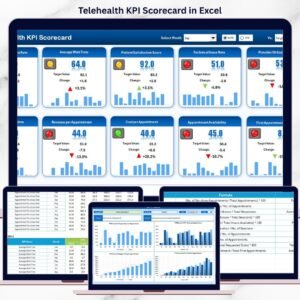
- Telehealth KPI Dashboard in Excel: telehealth service KPIs in Excel.
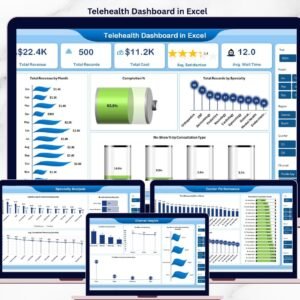
- Telehealth Dashboard in Excel: visit and patient data for telehealth.
- Telehealth KPI Dashboard in Google Sheets: for teams that work in Google Sheets.
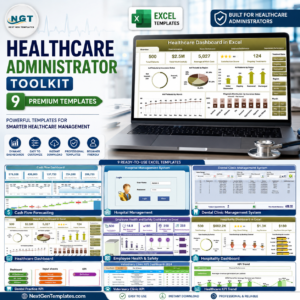
- Healthcare Administrator Toolkit: 9 Excel healthcare templates in one pack.
Browse all Excel KPI dashboards or the Excel health and safety templates.









Reviews
There are no reviews yet.