Managing a dermatology clinic successfully requires more than excellent skin treatments—it demands clear visibility into performance, revenue, efficiency, and growth. However, when patient data, billing numbers, and operational metrics remain scattered across registers or multiple files, clinics struggle to make timely and accurate decisions.
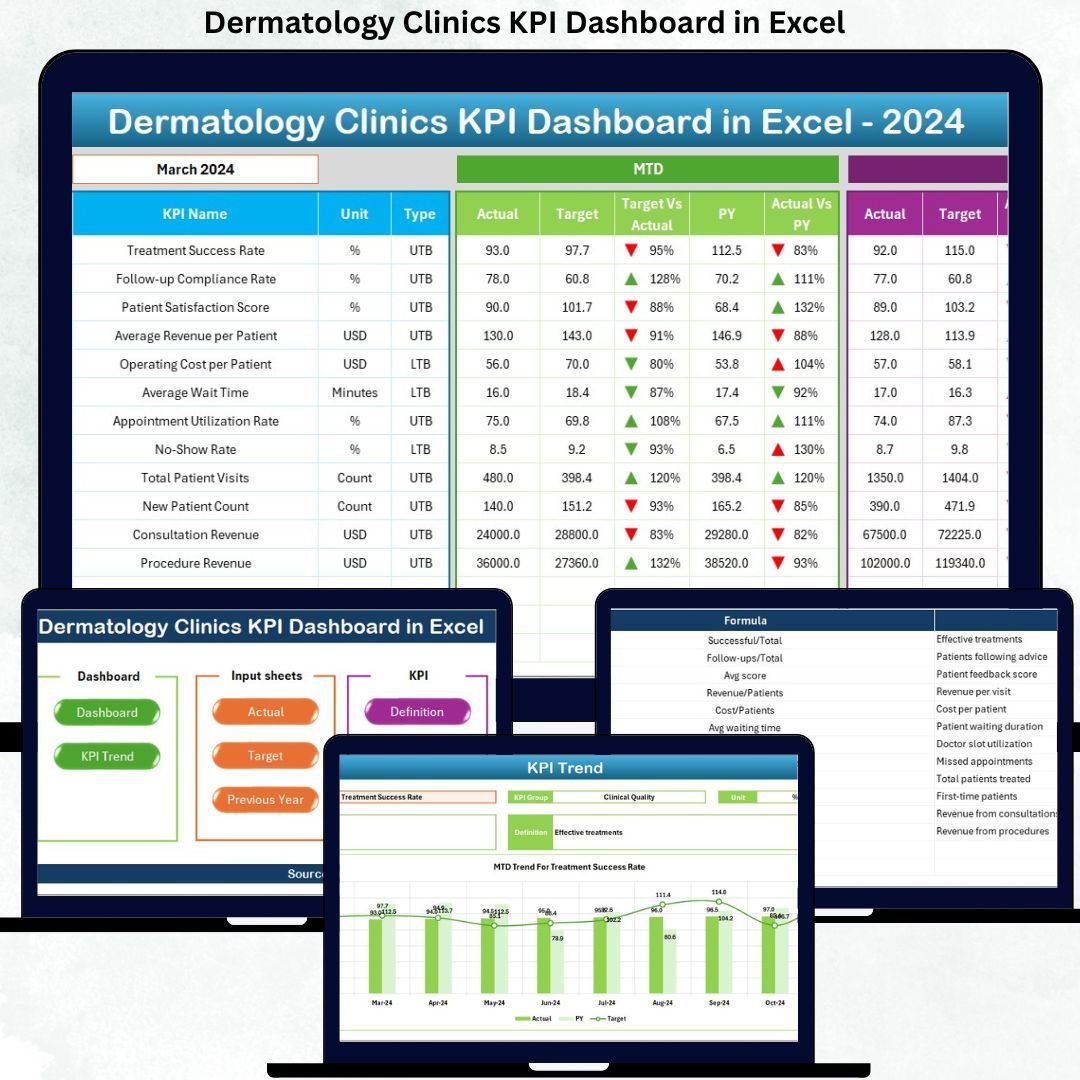
That is why the Dermatology Clinics KPI Dashboard in Excel is designed as a powerful, ready-to-use performance management solution. This professionally built Excel dashboard converts raw clinic data into clear KPIs, comparisons, and trends, enabling clinic owners and managers to track performance confidently—without relying on expensive BI tools.
Built entirely in Microsoft Excel, this dashboard is easy to use, flexible, scalable, and business-ready, making it ideal for both single-location clinics and growing dermatology practices.
🔑 Key Features of Dermatology Clinics KPI Dashboard in Excel
✨ Centralized KPI Monitoring – Track all clinical, operational, and financial KPIs from one structured Excel dashboard
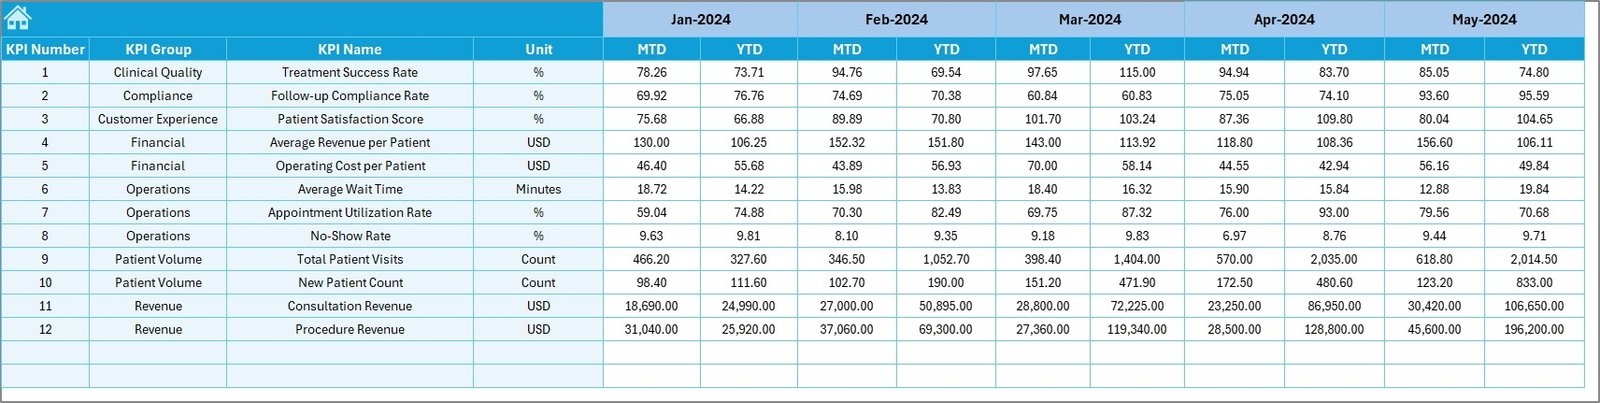
📅 MTD & YTD Performance Tracking – Monitor Monthly-to-Date and Year-to-Date performance effortlessly
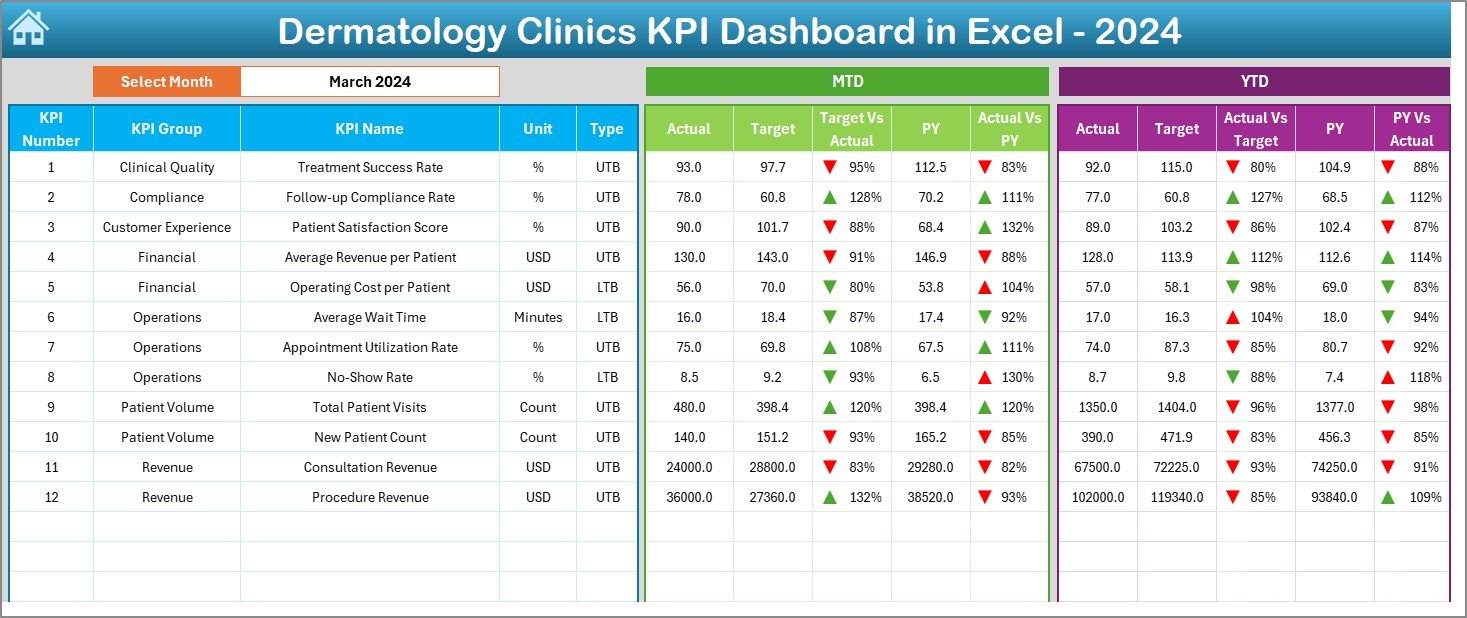
🎯 Target vs Actual Comparison – Instantly identify gaps between planned and actual performance
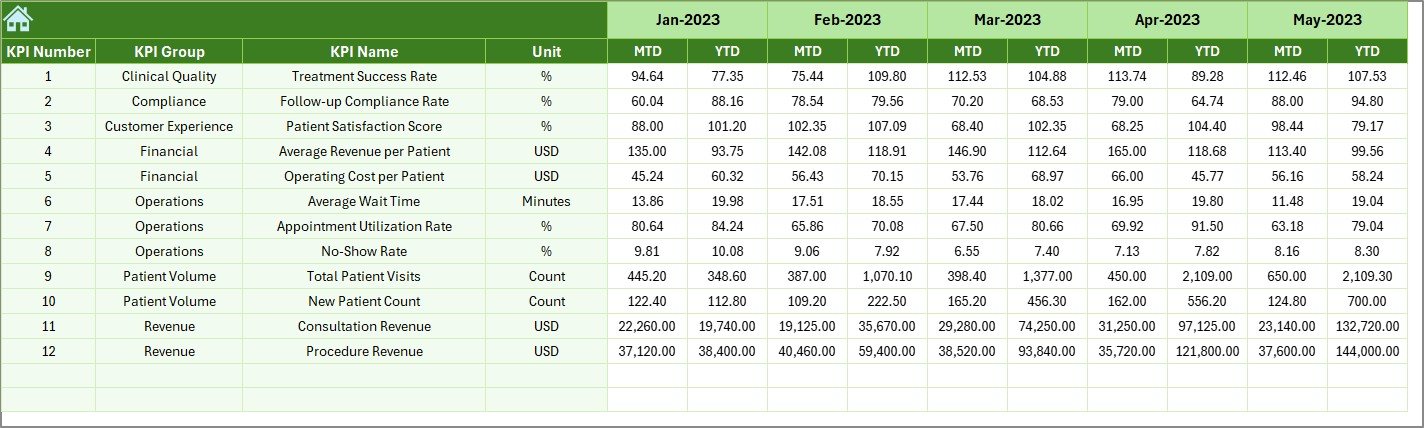
📊 Previous Year Analysis – Measure year-over-year growth and seasonal trends
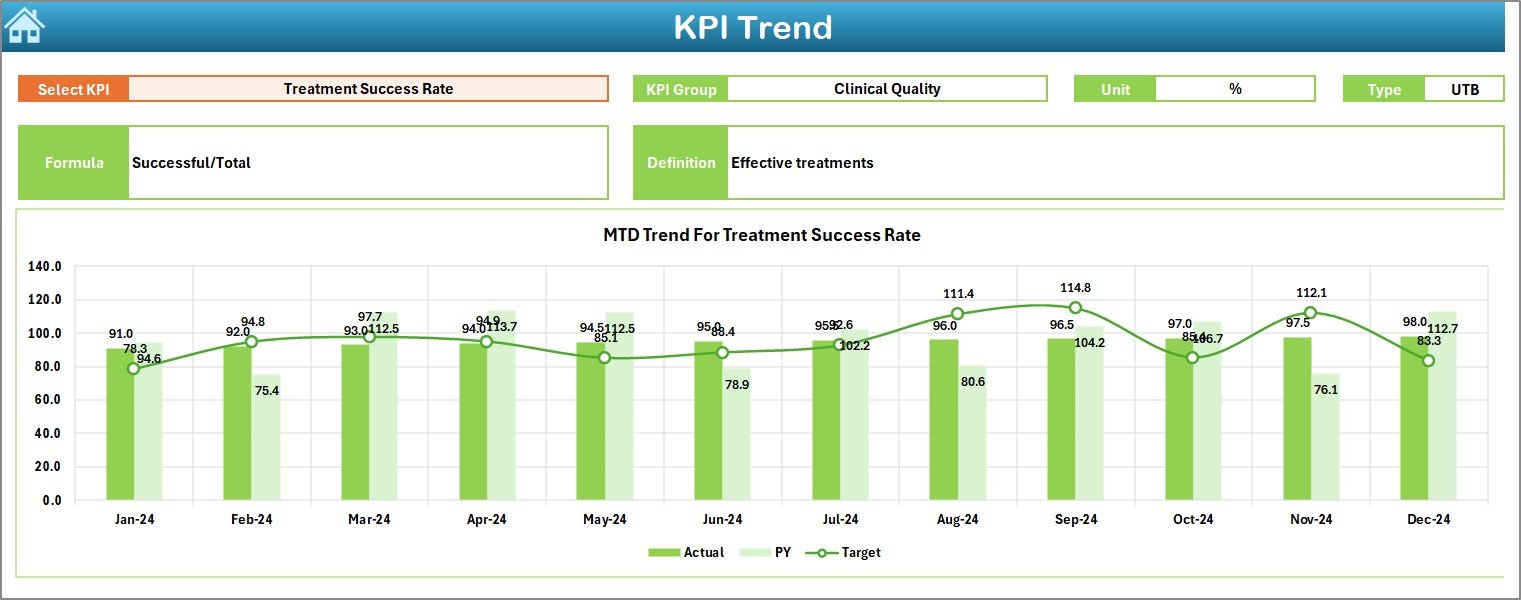
📈 Trend Analysis – Visual MTD and YTD trend charts for deeper performance insights
🔽 Interactive Filters & Drop-Downs – Select Month and KPI dynamically for instant analysis
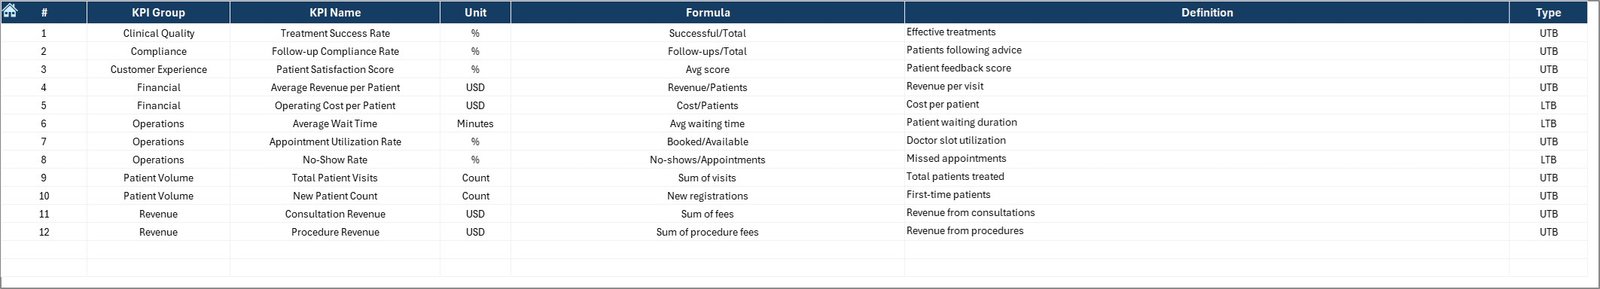
🧠 Clear KPI Definitions – Understand every metric with a dedicated KPI Definition sheet
💼 Excel-Based & Customizable – Modify KPIs, targets, and layouts without technical complexity
📦 What’s Inside the Dermatology Clinics KPI Dashboard in Excel
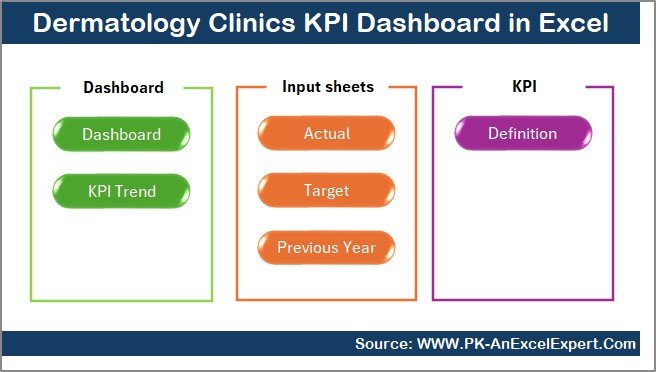
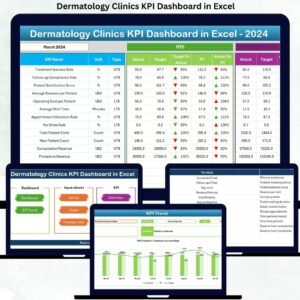
This dashboard includes 7 professionally structured worksheets, each serving a specific analytical purpose:
📌 Summary Page – Acts as a navigation hub with interactive buttons to access all major sheets
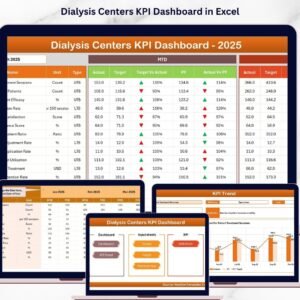
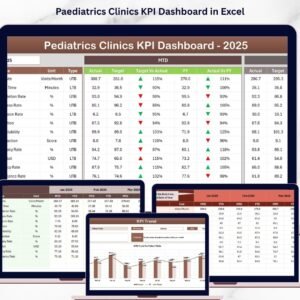
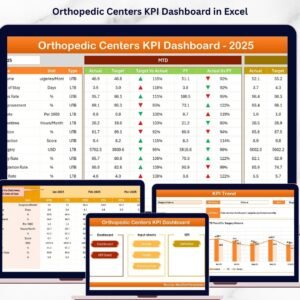
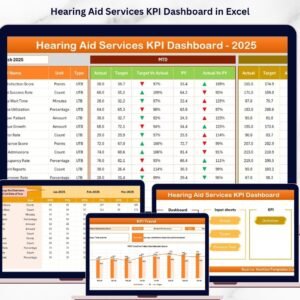
📌 Dashboard Sheet – Displays MTD & YTD Actual, Target, and Previous Year values with visual indicators
📌 Trend Sheet – Shows KPI-wise MTD and YTD trends with detailed KPI information
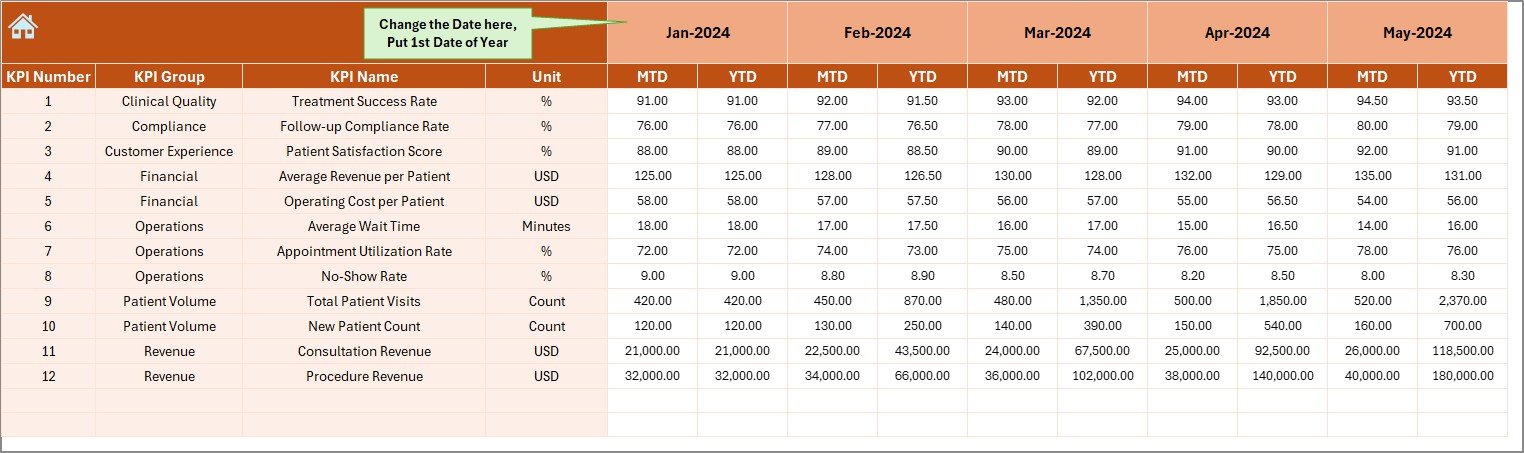
📌 Actual Numbers Sheet – Structured input sheet for entering real monthly clinic data
📌 Target Sheet – Captures KPI-wise MTD and YTD target values
📌 Previous Year Numbers Sheet – Enables accurate year-over-year performance comparison
📌 KPI Definition Sheet – Stores KPI name, group, unit, formula, and definition for clarity
Together, these sheets create a complete performance monitoring system for dermatology clinics.
🛠️ How to Use the Dermatology Clinics KPI Dashboard in Excel
Using this dashboard is simple and efficient:
1️⃣ Enter monthly Actual values in the Actual Numbers sheet
2️⃣ Define Targets in the Target sheet
3️⃣ Update Previous Year data for comparison
4️⃣ Select the Month from the dashboard drop-down
5️⃣ Instantly analyze KPIs, trends, gaps, and growth
No advanced Excel knowledge is required. The dashboard updates automatically using built-in formulas and logic.
👥 Who Can Benefit from This Dermatology Clinics KPI Dashboard in Excel
This dashboard is ideal for:
👨⚕️ Dermatology Clinic Owners – Track profitability and growth clearly
🏢 Clinic Administrators – Monitor daily and monthly operational performance
📊 Practice Managers – Identify efficiency gaps and improvement opportunities
💰 Finance Teams – Analyze revenue, costs, and margins accurately
📈 Business Analysts – Generate insights without manual reporting
Whether you manage a small clinic or a multi-location practice, this dashboard adapts easily to your needs.
Click here to read the Detailed Blog Post
Watch the step-by-step video tutorial:


Reviews
There are no reviews yet.