Social service organizations play a critical role in supporting communities, improving living conditions, and delivering essential services to vulnerable populations. These organizations often operate multiple programs such as healthcare assistance, child welfare services, community development initiatives, elderly support programs, education support, and poverty reduction efforts. Because these programs involve various stakeholders, resources, and activities, organizations must carefully monitor performance to ensure their efforts create measurable social impact.
However, evaluating the performance of social service programs can be challenging. Data is often scattered across multiple reports, spreadsheets, and monitoring systems. As a result, managers and decision-makers may struggle to determine whether programs are achieving their intended outcomes. Without a structured performance monitoring system, identifying performance gaps and improving service delivery becomes difficult.
To address this challenge, organizations increasingly rely on Key Performance Indicator (KPI) scorecards. A KPI scorecard helps organizations track progress, measure program effectiveness, and ensure accountability to donors, government agencies, and community stakeholders.
One powerful solution designed for this purpose is the Social Services KPI Scorecard in Google Sheets.
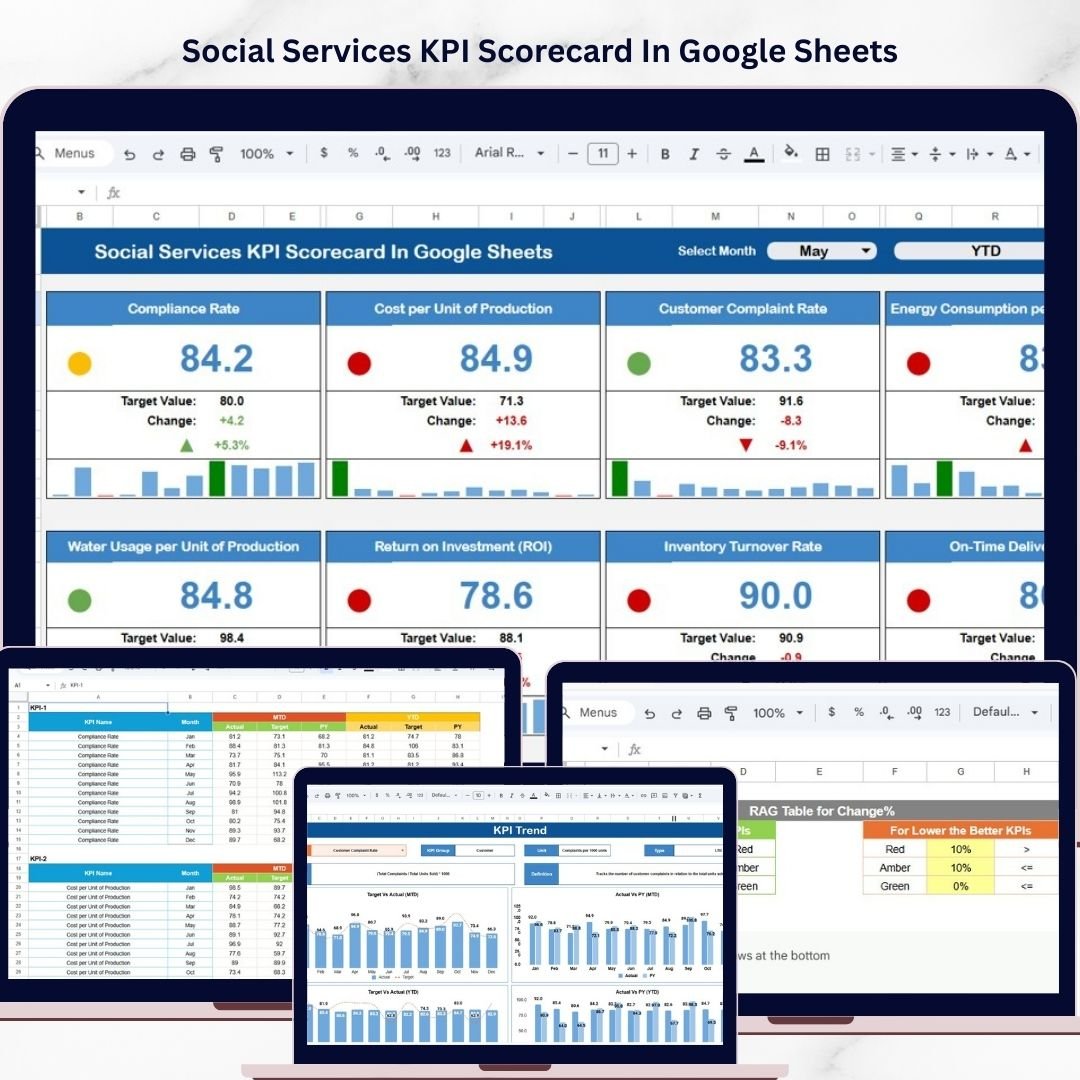
The Social Services KPI Scorecard in Google Sheets is a ready-to-use performance monitoring template designed to help organizations track and evaluate important KPIs related to social service programs. Because Google Sheets supports real-time collaboration, automated calculations, and cloud-based accessibility, teams can easily monitor program performance, update data, and share insights across departments.
-
🟢 Green indicates that the KPI target has been achieved.
-
🟡 Yellow indicates performance slightly below the target.
-
🔴 Red indicates that performance is significantly below the target.
Additionally, the scorecard includes upward and downward arrow indicators that show whether performance is improving or declining compared to previous periods.
Another important feature is the ability to switch between MTD (Month-to-Date) and YTD (Year-to-Date) views. This allows organizations to evaluate both short-term operational performance and long-term strategic progress.
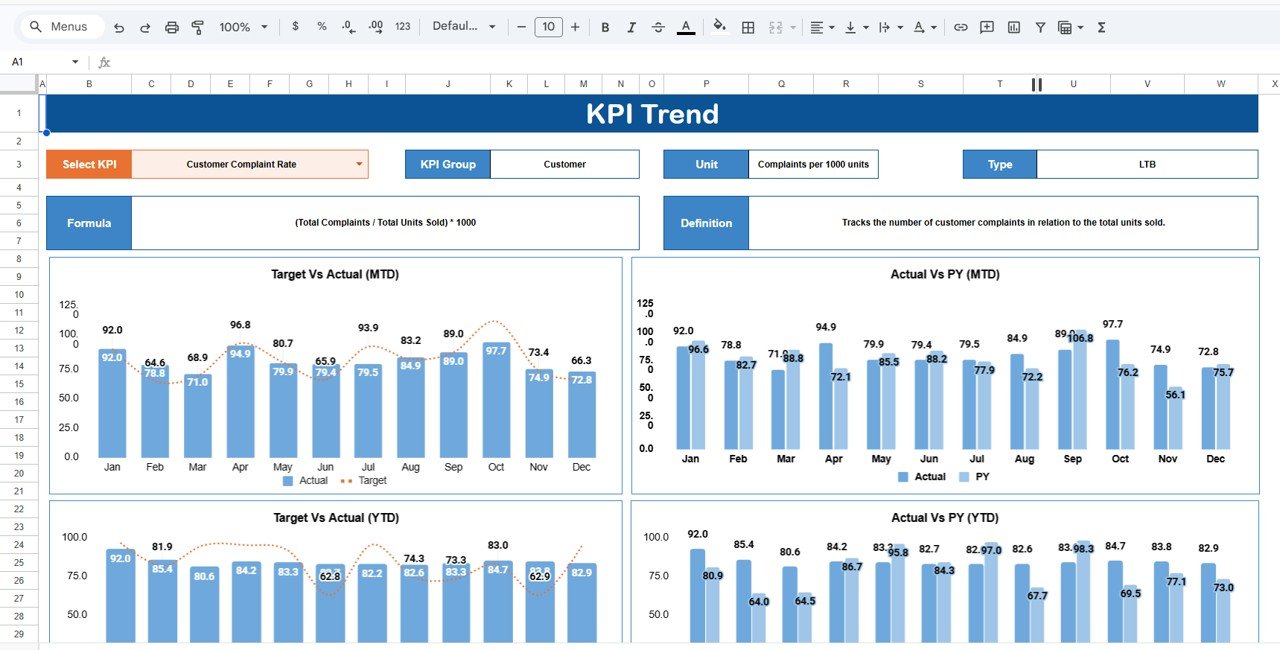
The KPI Trend Sheet enables users to analyze the historical performance of individual KPIs. By selecting a KPI from a dropdown list, users can view details such as the KPI group, measurement unit, and KPI type (Upper the Better or Lower the Better). This helps managers understand how each KPI contributes to organizational objectives.
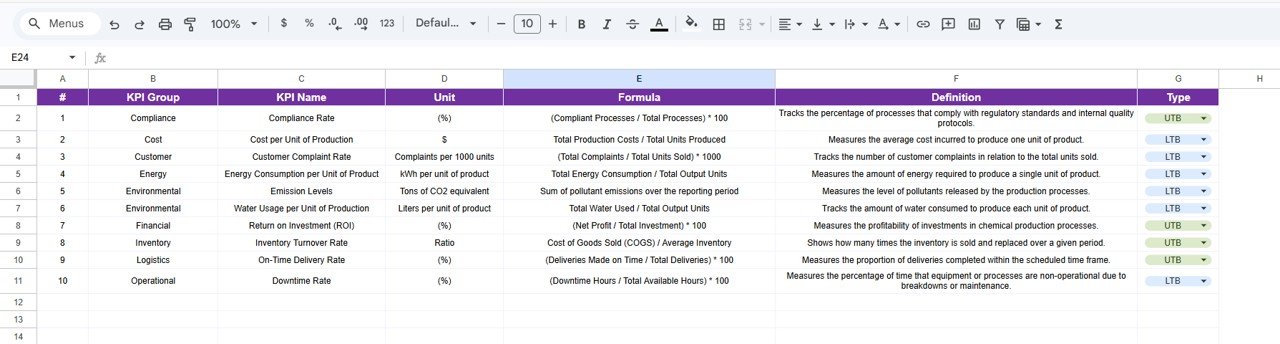
The KPI Definition Sheet serves as the documentation center of the scorecard. It stores the name, group, unit, formula, and definition of each KPI, ensuring standardized reporting across the organization.
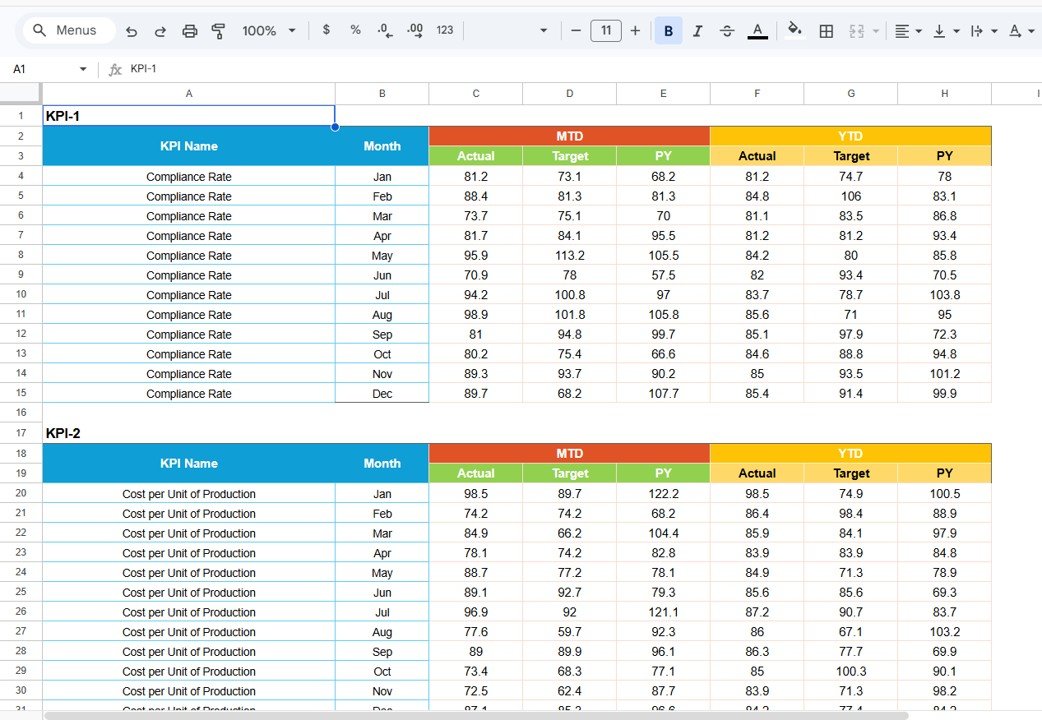
The Data Input Sheet is the central data source for the entire scorecard. Users enter monthly KPI values in this sheet, and the dashboard automatically updates calculations and visual indicators.
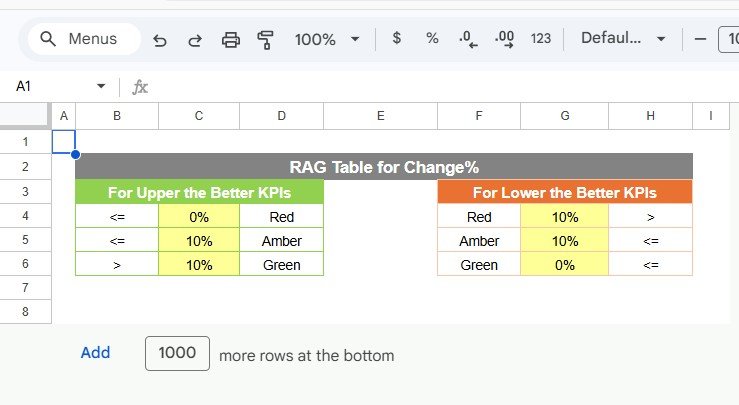
Finally, the Colour Settings Sheet allows organizations to customize traffic light indicators and conditional formatting thresholds to match their reporting standards.
Because Google Sheets allows teams to collaborate in real time, multiple users can update data simultaneously while managers monitor performance instantly.
This scorecard is ideal for organizations such as nonprofits, government social service departments, community organizations, humanitarian programs, and development agencies.
By transforming raw program data into clear visual insights, the Social Services KPI Scorecard in Google Sheets helps organizations improve accountability, enhance service delivery, and maximize their social impact.
⭐ Key Feature of Social Services KPI Scorecard in Google Sheets
📊 Centralized Social Program Monitoring
Track multiple social service KPIs in one structured scorecard.
📈 MTD & YTD Performance Views
Analyze both monthly and yearly performance trends.
🟢 Traffic Light KPI Indicators
Visual indicators highlight whether KPIs meet targets.
📉 Performance Variance Tracking
Quickly identify gaps between target and actual performance.
📊 KPI Trend Analysis
Evaluate the historical performance of individual KPIs.
📚 KPI Documentation Center
Define KPI formulas, units, and descriptions clearly.
⚙ Automated Calculations
Google Sheets formulas automatically update KPI results.
🤝 Real-Time Collaboration
Multiple team members can update and monitor KPI data simultaneously.
🎯 Customizable Scorecard Settings
Adjust KPI thresholds and conditional formatting rules.
📊 Data-Driven Decision Making
Use performance insights to improve program effectiveness.
📦 What’s Inside the Social Services KPI Scorecard
This template includes five structured worksheets that support performance monitoring.
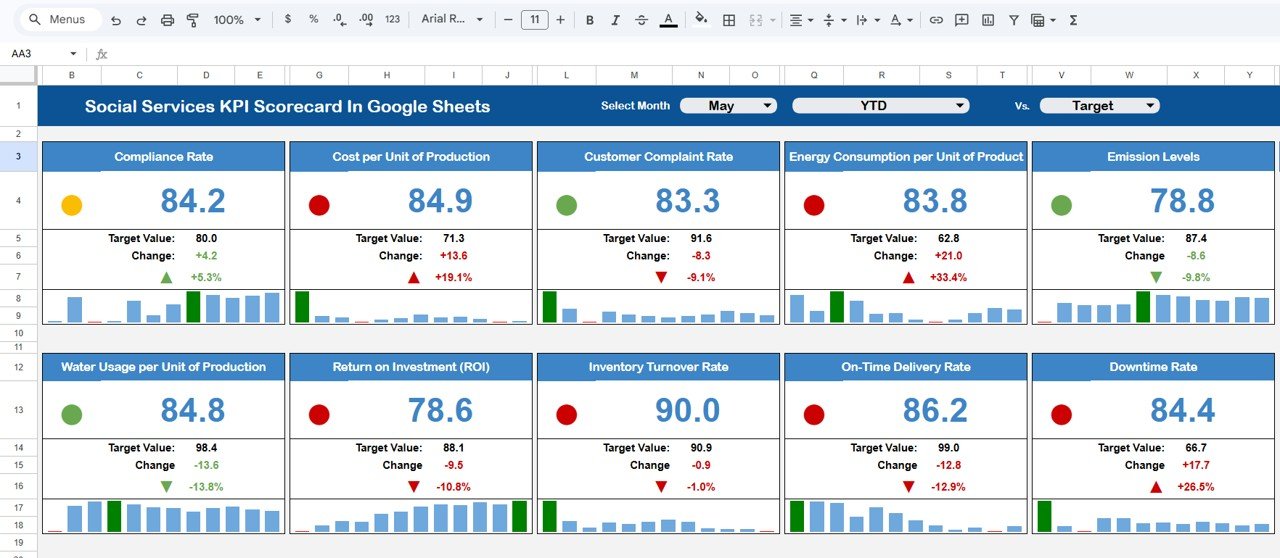
📊 Monthly Scorecard Dashboard
The Monthly Scorecard Dashboard acts as the main reporting interface.
Users can select a month from a dropdown list, and the scorecard automatically updates performance metrics.
Displayed information includes:
-
KPI Name
-
Target Value
-
Actual Value
-
Performance Variance
-
Percentage Change
-
Traffic Light Indicators
📈 KPI Trend Sheet
The KPI Trend Sheet helps analyze historical KPI performance.
Users can select a KPI from a dropdown list to view:
-
KPI Group
-
KPI Unit
-
KPI Type (Upper the Better / Lower the Better)
📚 KPI Definition Sheet
This sheet stores the definitions and formulas for each KPI.
Fields include:
-
KPI Name
-
KPI Group
-
KPI Unit
-
KPI Formula
-
KPI Definition
📊 Data Input Sheet
This sheet acts as the primary data source for the scorecard.
Users enter monthly KPI values, and the dashboard automatically updates performance indicators.
🎨 Colour Settings Sheet
The Colour Settings Sheet allows users to customize traffic light indicators and KPI thresholds.
This ensures the dashboard aligns with organizational reporting standards.
⚙️ How to Use the Social Services KPI Scorecard
1️⃣ Define KPIs in the KPI Definition Sheet.
2️⃣ Enter monthly KPI values in the Data Input Sheet.
3️⃣ Adjust KPI thresholds in the Colour Settings Sheet if needed.
4️⃣ Select a month in the Monthly Scorecard Dashboard.
5️⃣ Analyze KPI performance using traffic lights and variance indicators.
The scorecard automatically updates results and visual indicators.
👥 Who Can Benefit from This Scorecard
This KPI scorecard is valuable for organizations involved in community service and social development.
🏢 Nonprofit organizations
👥 Social service agencies
📊 Government departments
🤝 Community development programs
🌍 Humanitarian organizations
📈 Program managers and analysts
These professionals can use the scorecard to monitor program outcomes, improve accountability, and optimize resource allocation.
### Click hare to read the Detailed blog post
Watch the step-by-step video tutorial: