The Audio Streaming Services Dashboard industry has experienced extraordinary growth over the past decade. Millions of users now listen to music, podcasts, audiobooks, and digital audio content through online streaming platforms every day. Popular services such as Spotify, Apple Music, YouTube Music, and Amazon Music have revolutionized how people consume entertainment and educational content.
However, with this rapid expansion comes a major challenge—managing and analyzing massive amounts of streaming data. Audio streaming platforms generate huge datasets including user streams, subscription revenue, advertising income, licensing costs, content performance metrics, and listener engagement data.
When this information is scattered across multiple spreadsheets, databases, and analytics tools, it becomes difficult for businesses to gain clear insights. As a result, decision-making becomes slower and less effective.
To overcome this challenge, streaming companies increasingly adopt business intelligence dashboards that convert raw data into visual insights. One of the most powerful solutions available is the Audio Streaming Services Dashboard in Power BI.
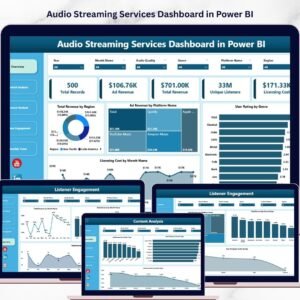
The Audio Streaming Services Dashboard in Power BI is a ready-to-use analytics solution designed to transform complex streaming datasets into interactive charts, KPI indicators, and dynamic reports. Using Power BI’s advanced visualization capabilities, the dashboard provides a centralized view of streaming performance across multiple dimensions.
Instead of manually analyzing thousands of records, managers and analysts can quickly explore key metrics such as revenue trends, content performance, listener engagement, platform usage, and monthly streaming activity.
Because Power BI automatically processes data and refreshes visualizations, organizations can monitor streaming performance in near real time. This allows businesses to quickly identify trends, evaluate user behavior, and make strategic decisions based on reliable insights.
The dashboard is designed with five analytical pages, each focusing on a specific aspect of streaming analytics. These pages include Overview, Content Analysis, Revenue Analysis, Listener Engagement, and Month Analysis.
Each page provides targeted insights that help streaming companies understand how their platform performs. For example, managers can identify which genres generate the highest revenue, which platforms attract the most listeners, and which regions produce the strongest engagement.
Additionally, interactive slicers and filters allow users to analyze streaming data dynamically. With just a few clicks, decision-makers can explore performance across regions, platforms, subscription types, content categories, and time periods.
This powerful dashboard is ideal for organizations that operate music streaming services, podcast platforms, audiobook platforms, digital media services, or audio content networks.
By converting raw streaming data into clear visual insights, the Audio Streaming Services Dashboard in Power BI helps businesses improve content strategies, optimize monetization models, and enhance listener engagement.
🎧 Key Feature of Audio Streaming Services Dashboard in Power BI
📊 Interactive Streaming Analytics
Analyze streaming platform performance through powerful Power BI visuals and charts.
💰 Revenue Tracking Dashboard
Monitor total revenue, ad revenue, and subscription revenue in one place.
🎵 Content Performance Insights
Understand which audio content types and genres generate the highest engagement.
📱 Platform Performance Monitoring
Compare performance across mobile apps, web platforms, and smart devices.
⭐ User Rating Analysis
Evaluate listener satisfaction based on ratings and audio quality preferences.
🌍 Regional Streaming Insights
Analyze revenue and streaming activity across different geographic regions.
📈 Listener Engagement Tracking
Monitor streaming activity, content consumption, and user interaction patterns.
📅 Monthly Trend Analysis
Track revenue growth, streaming trends, and seasonal listening patterns.
🎛 Interactive Filters and Slicers
Explore data dynamically using Power BI filters.
⚡ Automated Data Visualization
Transform complex streaming datasets into easy-to-understand visual reports.
📊 What’s Inside the Audio Streaming Services Dashboard in Power BI
The dashboard contains five analytical pages, each designed to analyze streaming performance from different perspectives.
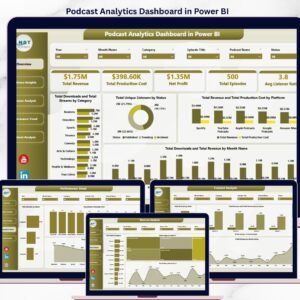
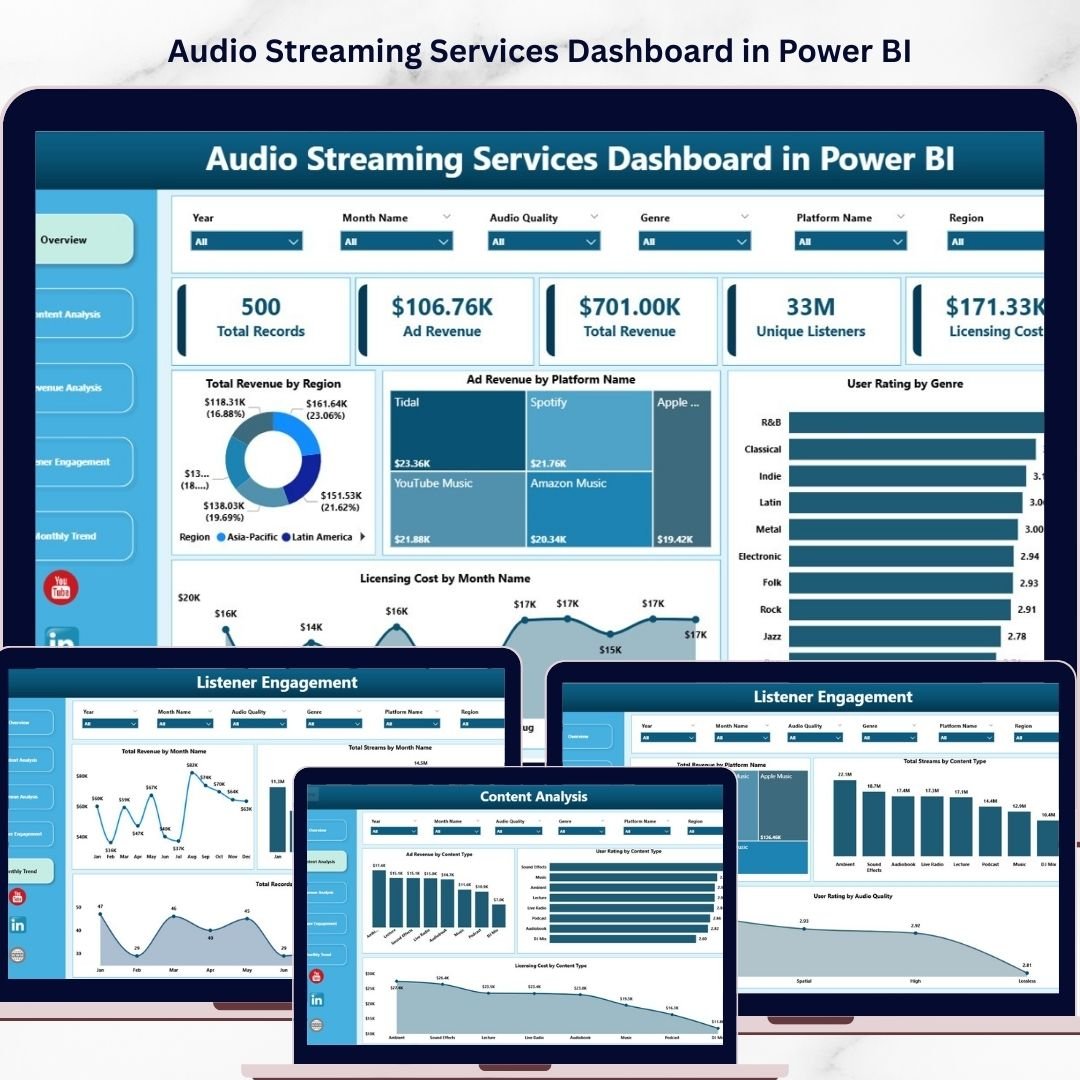
📊 Overview Page – Streaming Performance Snapshot
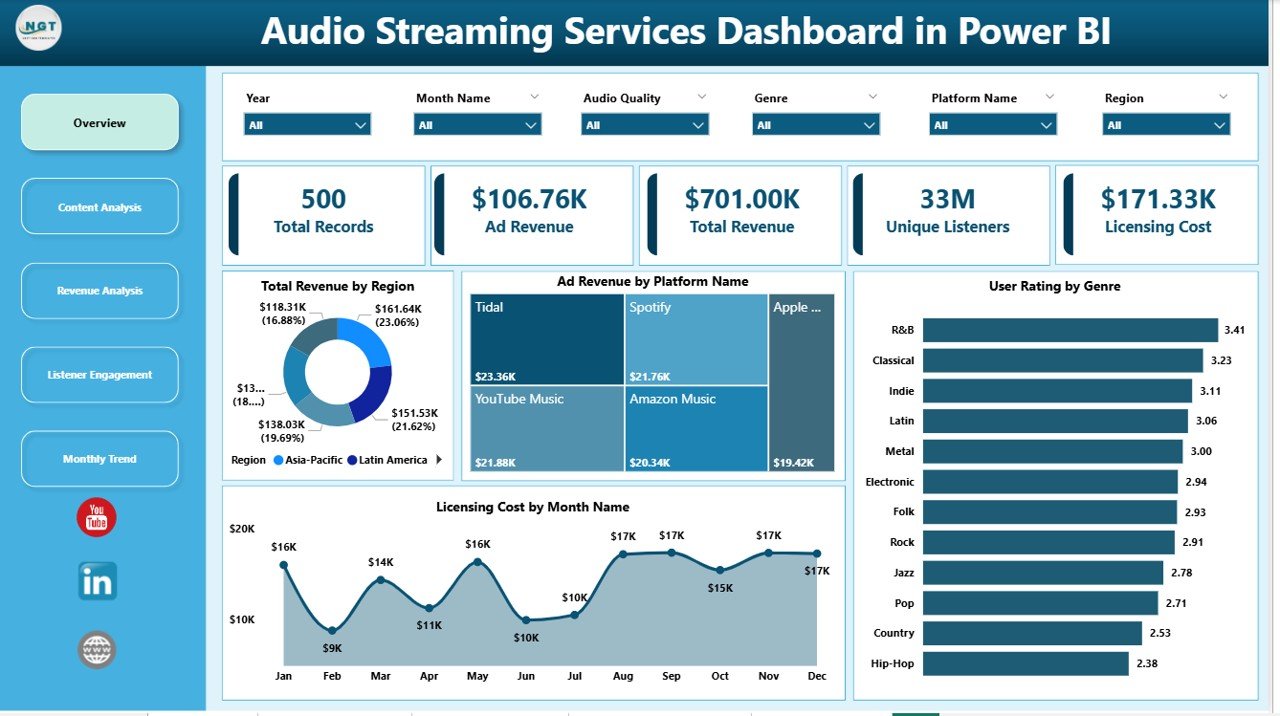
The Overview Page acts as the main summary page of the dashboard.
It provides a quick overview of important metrics related to revenue, content performance, and licensing costs.
Key visuals include:
• Total Revenue by Region
• Ad Revenue by Platform Name
• User Rating by Genre
• Licensing Cost by Month Name
These visuals help decision-makers quickly understand which regions generate the most revenue and which genres receive the highest user ratings.
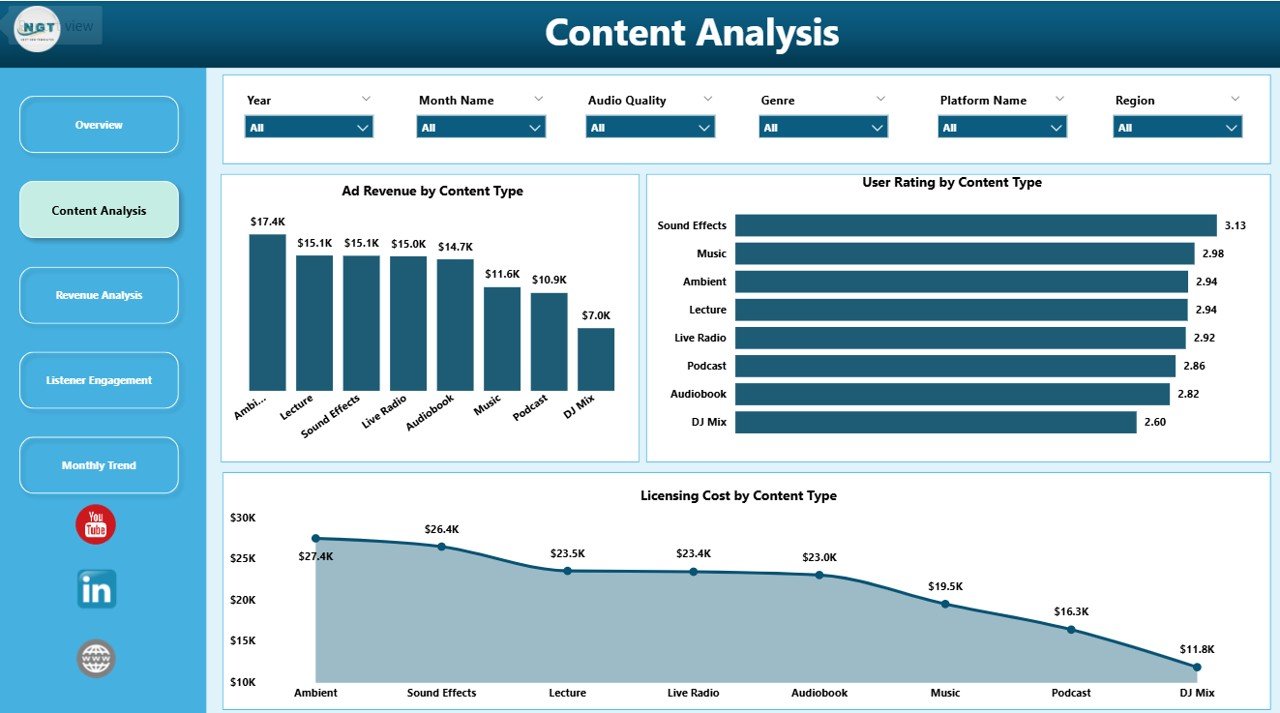
🎵 Content Analysis Page
The Content Analysis Page focuses on analyzing the performance of different audio content types.
Charts included:
• Ad Revenue by Content Type
• User Rating by Content Type
• Licensing Cost by Content Type
This analysis helps streaming platforms determine which content categories perform best financially and attract higher listener engagement.
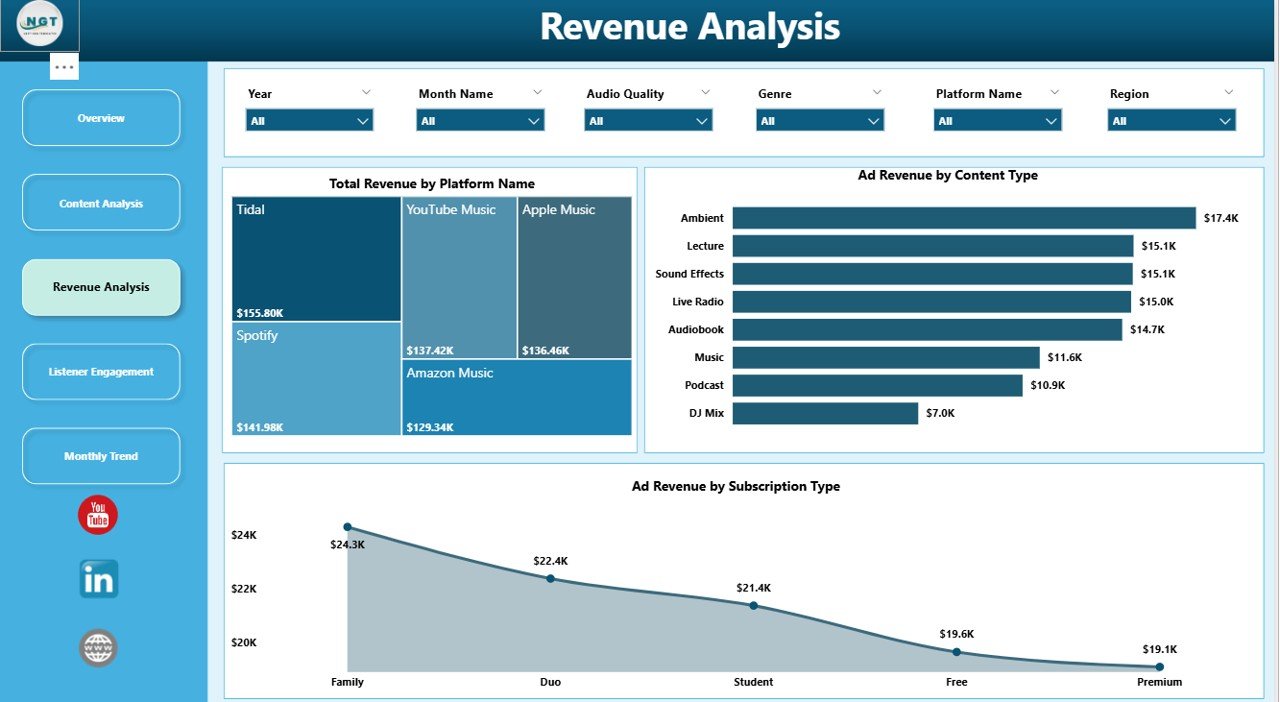
💰 Revenue Analysis Page
Revenue monitoring is essential for streaming businesses. The Revenue Analysis Page provides deeper insights into revenue distribution.
Charts included:
• Total Revenue by Platform Name
• Ad Revenue by Platform Name
• Ad Revenue by Subscription Type
These insights help companies understand how subscription models and advertising impact overall revenue.
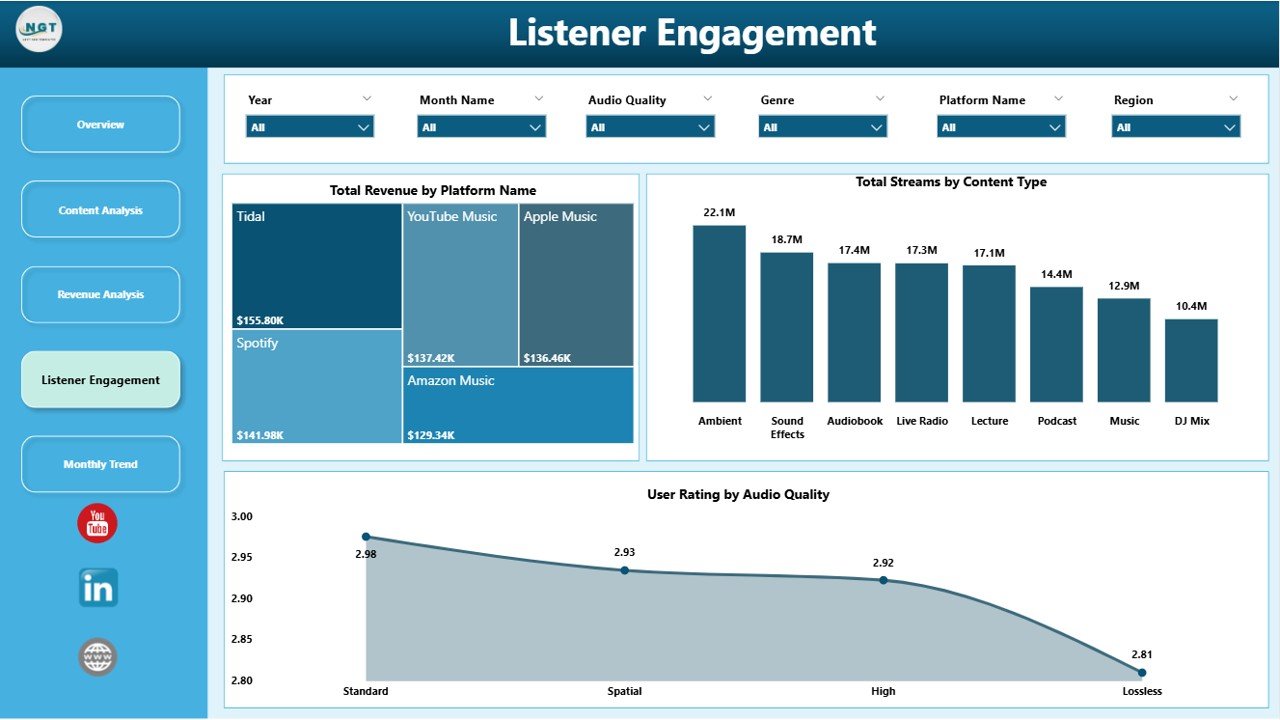
🎧 Listener Engagement Page
The Listener Engagement Page focuses on analyzing how users interact with streaming content.
Charts included:
• Total Revenue by Platform Name
• Total Streams by Content Type
• User Rating by Audio Quality
These insights reveal which content types attract the most listeners and whether audio quality impacts user satisfaction.
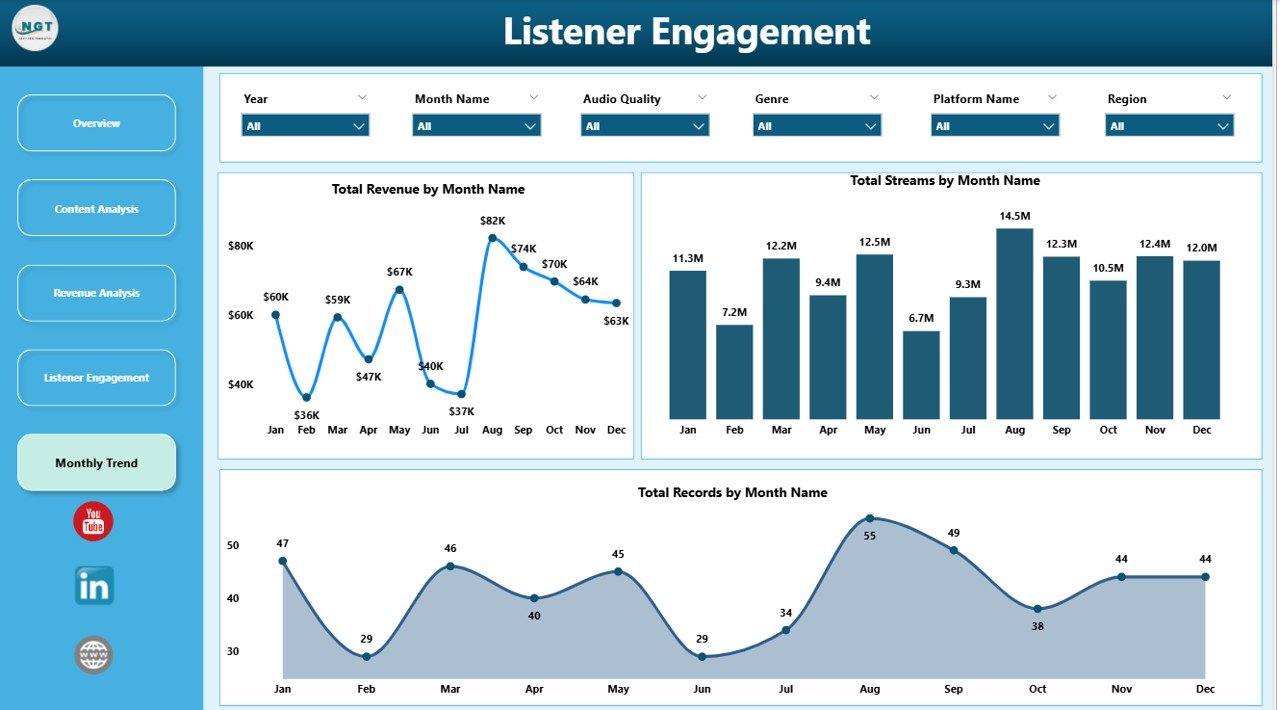
📅 Month Analysis Page
The Month Analysis Page focuses on time-based streaming trends.
Charts included:
• Total Revenue by Month
• Total Streams by Month
• Total Records by Month
These visuals help businesses identify seasonal listening patterns and revenue fluctuations.
⚙️ How to Use the Audio Streaming Services Dashboard in Power BI
Using the dashboard is simple.
1️⃣ Import streaming data into Power BI.
2️⃣ Ensure the dataset includes metrics such as streams, revenue, content type, and platform usage.
3️⃣ Use interactive filters and slicers to explore data dynamically.
4️⃣ Analyze insights across the dashboard pages.
5️⃣ Refresh the dataset regularly to keep analytics up-to-date.
With Power BI automation, the dashboard instantly transforms raw streaming data into actionable insights.
👥 Who Can Benefit from This Dashboard
This dashboard is useful for many professionals in the digital media industry.
🎧 Streaming Platform Managers
📊 Data Analysts
📈 Digital Media Strategists
📣 Marketing Teams
🎵 Content Managers
💼 Business Executives
These professionals can use the dashboard to monitor platform performance, analyze listener behavior, and improve content strategies.
### Click hare to read the Detailed blog post
Visit our YouTube channel to learn step-by-step video tutorials
https://youtube.com/@PKAnExcelExpert