Building a diverse and inclusive workplace is no longer optional for modern organizations. Companies that promote diversity and inclusion often experience higher employee satisfaction, better innovation, and stronger business performance. However, measuring diversity and inclusion initiatives can be challenging without a structured performance tracking system.
That is why we created the Diversity and Inclusion KPI Scorecard in Excel — a powerful and easy-to-use performance monitoring template designed to help organizations track diversity metrics, evaluate inclusion initiatives, and measure progress toward diversity goals.
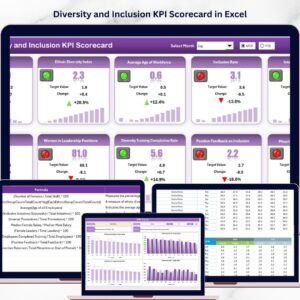
This ready-to-use Excel scorecard allows HR teams, managers, and leadership teams to monitor diversity and inclusion KPIs using clear dashboards, automated comparisons, and visual indicators. Instead of analyzing scattered reports, organizations can quickly view performance insights, track KPI trends, and identify areas that require attention.
With this Excel template, you can transform raw diversity data into meaningful insights that help create a more equitable and inclusive workplace.
🚀 Key Feature of Diversity and Inclusion KPI Scorecard
The Diversity and Inclusion KPI Scorecard in Excel offers a wide range of powerful features designed to simplify diversity performance tracking.
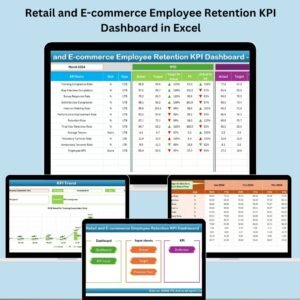
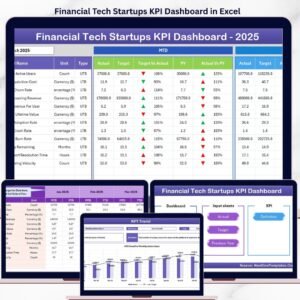
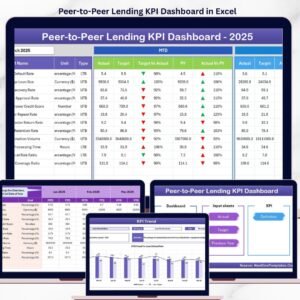
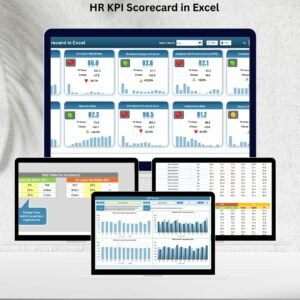
📊 Interactive KPI Scorecard Dashboard
Monitor all diversity and inclusion KPIs in one centralized Excel scorecard with a clear and organized layout.
📅 Dynamic Month Selection
Analyze data by selecting a specific month, Month-to-Date (MTD), or Year-to-Date (YTD) using dropdown menus.
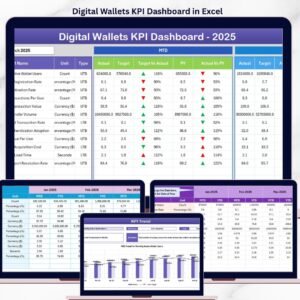
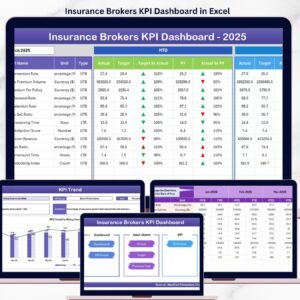
🎯 Actual vs Target Comparison
Quickly compare actual KPI performance against targets to identify performance gaps.
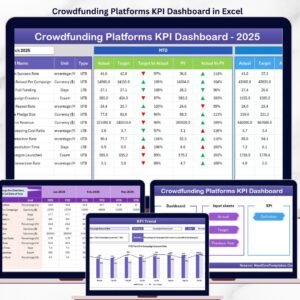
📈 KPI Trend Analysis
Track historical KPI performance using dynamic charts that visualize trends across months and years.
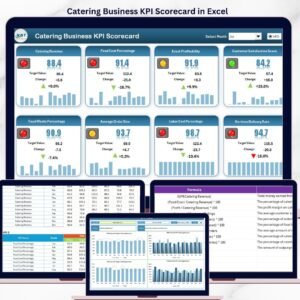
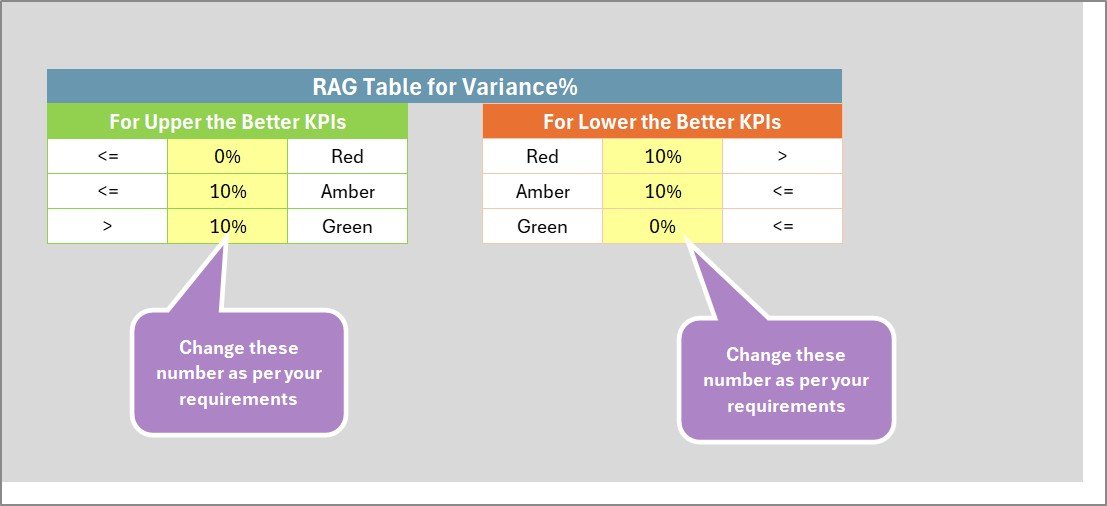
🎨 Conditional Formatting Indicators
Color-coded indicators help instantly identify strong performance or areas needing improvement.
📑 Detailed KPI Definitions
Each KPI includes clear definitions, formulas, units, and explanations to ensure transparency.
⚡ Fully Customizable Template
Easily modify KPIs, targets, and input data according to your organization’s diversity strategy.
📉 Performance Benchmarking
Compare actual results with previous year performance to measure improvement over time.
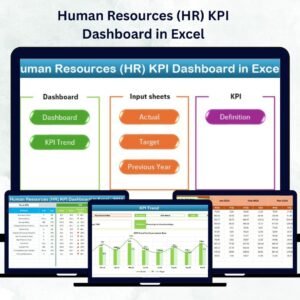
📂 What’s Inside the Diversity and Inclusion KPI Scorecard
The template contains four structured Excel worksheets designed to provide a complete KPI monitoring system.
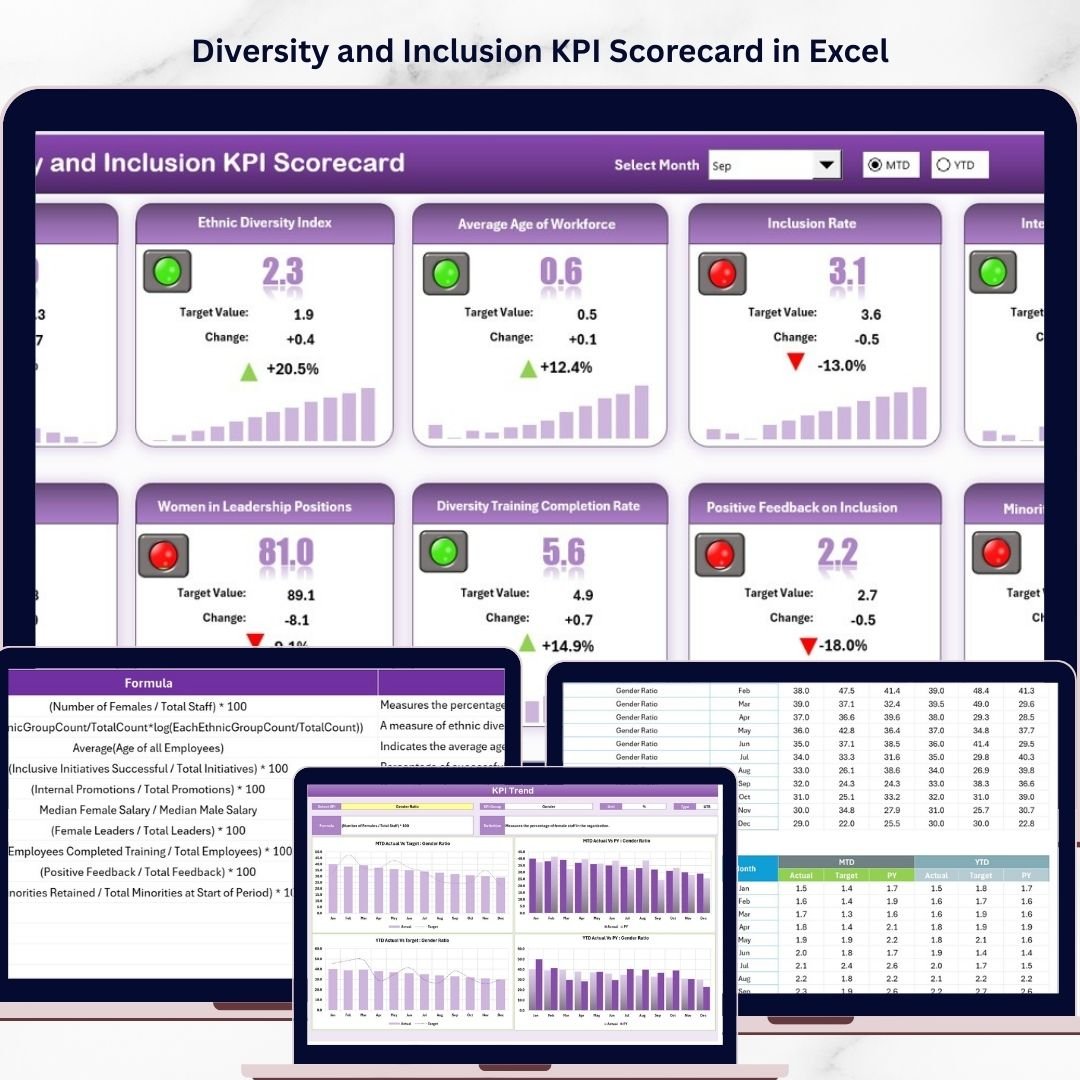
1️⃣ Scorecard Sheet
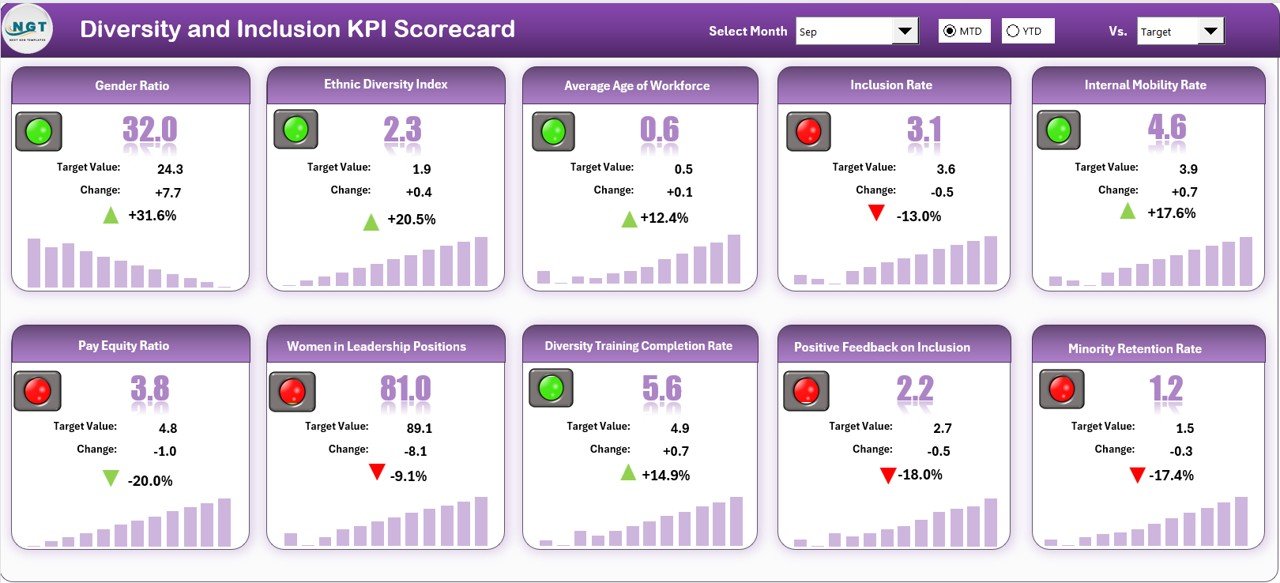
This is the main dashboard where all KPI results are displayed.
Users can select monthly, MTD, or YTD data views using dropdown menus. The dashboard instantly updates to show KPI performance with visual indicators and comparisons against targets. This sheet provides a quick overview of all diversity and inclusion KPIs.
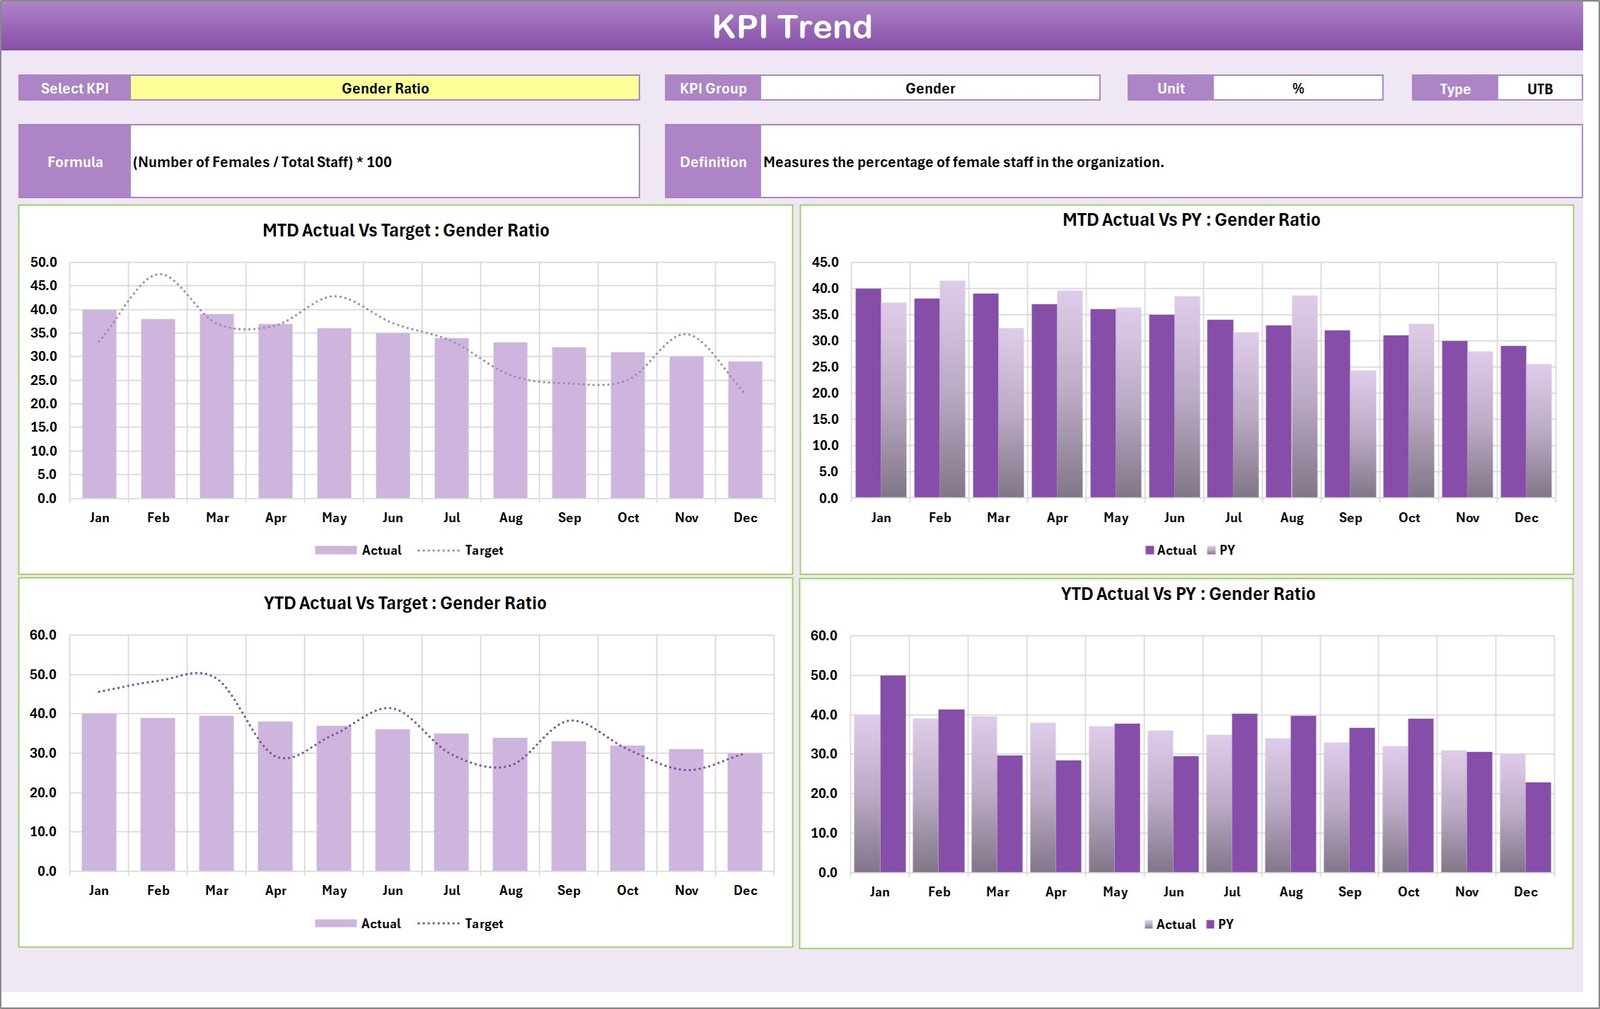
2️⃣ KPI Trend Sheet
The KPI Trend sheet helps analyze the performance of individual KPIs over time.
Users can select any KPI from a dropdown list to view important information such as KPI group, unit of measurement, formula, and definition. Trend charts visualize actual values, targets, and previous year results for deeper insights.
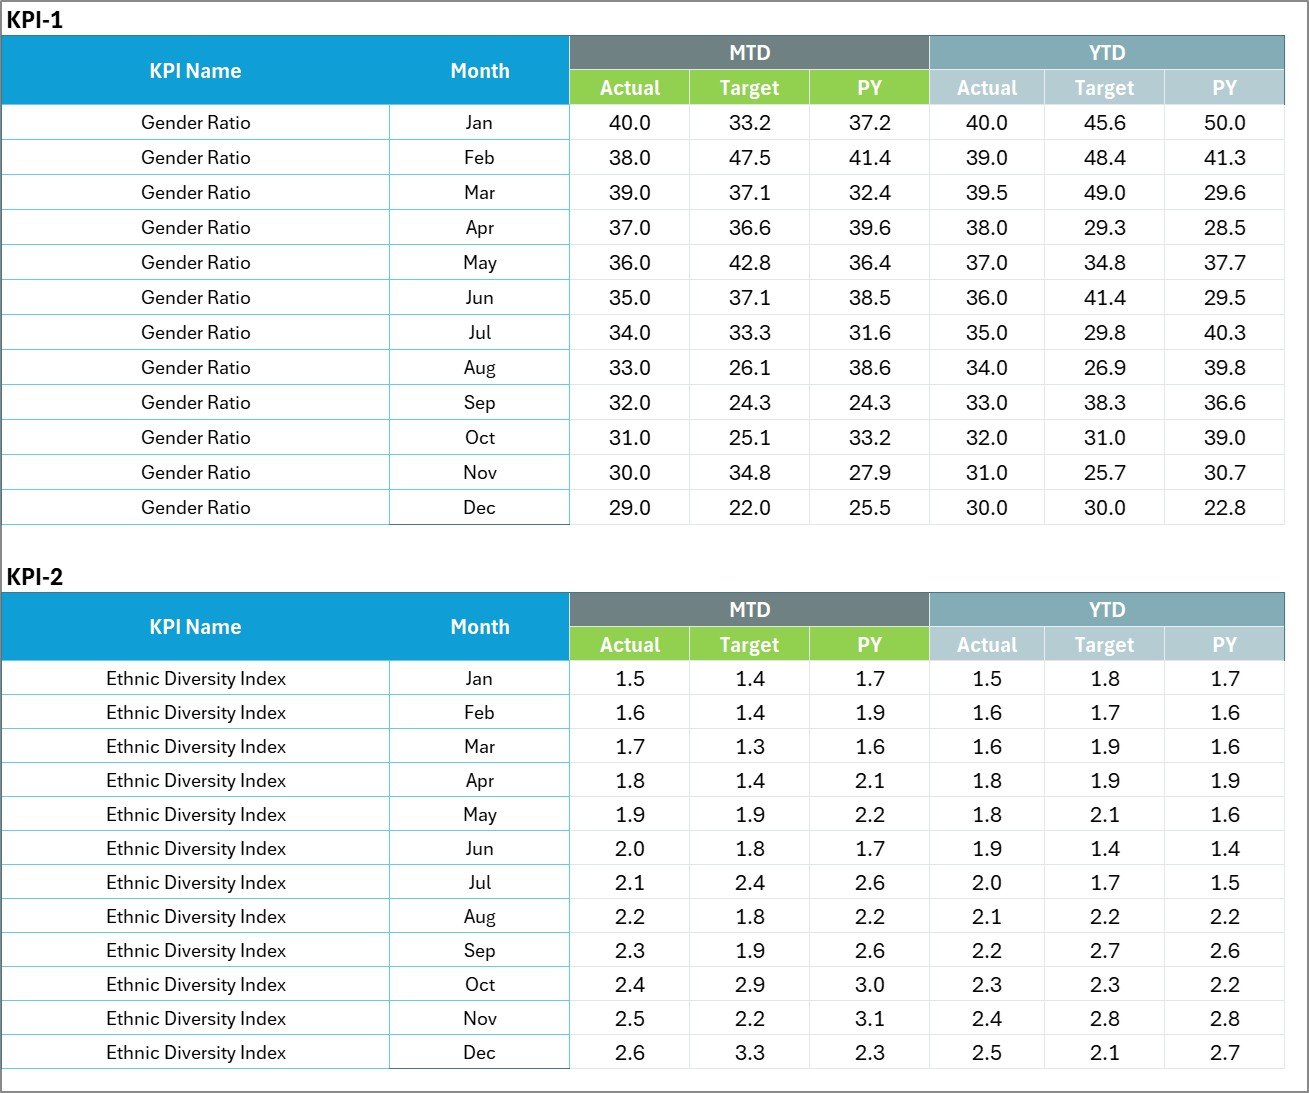
3️⃣ Input Data Sheet
This sheet allows users to input KPI performance data.
All actual values, targets, and supporting metrics are entered here. The scorecard automatically updates when new data is entered, ensuring that the dashboard always reflects the latest information.
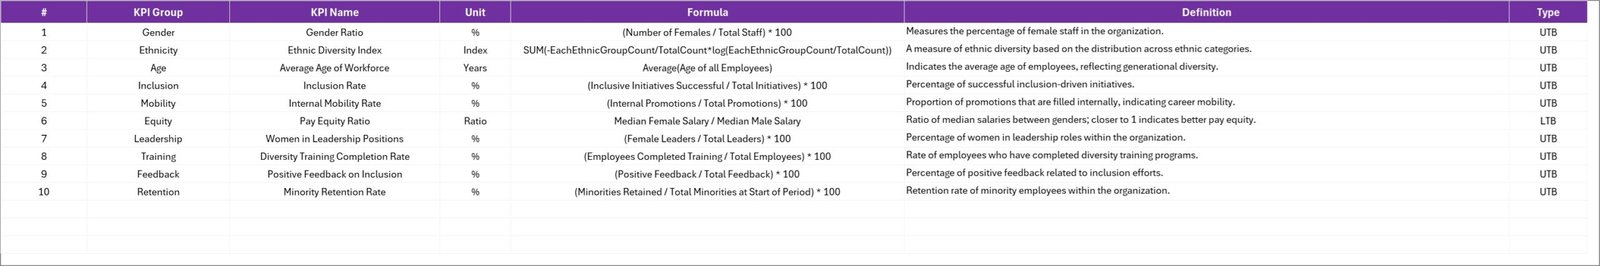
4️⃣ KPI Definition Sheet
This sheet stores detailed information about each KPI including KPI name, KPI group, unit, formula, and definition. This ensures clarity and consistency across departments.
⚙️ How to Use the Diversity and Inclusion KPI Scorecard
Using the Diversity and Inclusion KPI Scorecard in Excel is simple and requires only basic Excel knowledge.
First, enter your KPI names, formulas, and definitions in the KPI Definition sheet. This establishes the structure for your diversity metrics.
Next, input your performance data in the Input Data sheet, including actual values and targets for each KPI.
Once data is entered, the Scorecard Dashboard automatically displays performance results with visual indicators. Users can select a month or choose MTD and YTD views to analyze performance.
For deeper analysis, the KPI Trend sheet allows users to review KPI progress using historical charts.
Within minutes, organizations can gain valuable insights into diversity performance and identify areas for improvement.
👥 Who Can Benefit from This Diversity and Inclusion KPI Scorecard
This Excel template is ideal for organizations committed to building inclusive workplaces.
👨💼 Human Resources Teams – Monitor workforce diversity metrics and inclusion initiatives.
🏢 Corporate Leadership – Track diversity performance and align inclusion goals with business strategy.
📊 Data Analysts – Analyze diversity data using structured KPI dashboards.
🎓 Diversity & Inclusion Officers – Evaluate progress of diversity programs and initiatives.
🏛 Government & Public Organizations – Monitor equal opportunity programs and diversity compliance.
🌍 Consultants & HR Advisors – Provide clients with professional diversity reporting tools.
By using this KPI scorecard, organizations can make data-driven decisions that promote fairness, equality, and workplace inclusion.
Click here to read the Detailed blog post
Visit our YouTube channel to learn step-by-step video tutorials
https://youtube.com/@PKAnExcelExpert