


In today’s competitive retail and e-commerce landscape, your employees are your greatest asset—but only if you can keep them. With high turnover rates cutting into profits and productivity, it’s critical to monitor and improve workforce retention. That’s where the Retail and E-commerce Employee Retention KPI Dashboard in Excel comes in. 📊
This easy-to-use dashboard template helps HR and operations teams track retention metrics, spot problem areas, and take corrective action—all in real-time. From voluntary turnover and absenteeism to engagement and tenure, you’ll have all the key metrics in one central location.
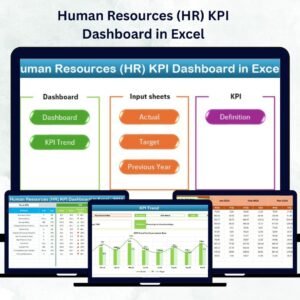
🔧 Key Features of the Employee Retention KPI Dashboard
🏠 Home Sheet – Command Center

-
6 clickable navigation buttons for instant access
-
Jump between Dashboard, Input Sheets, and Trend Views
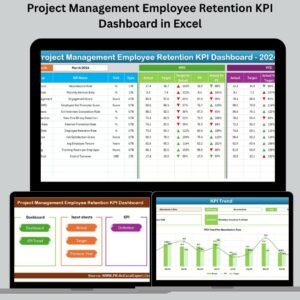
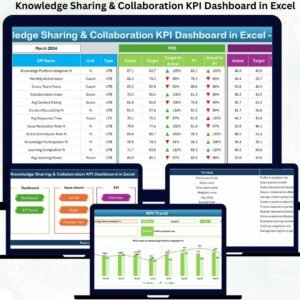
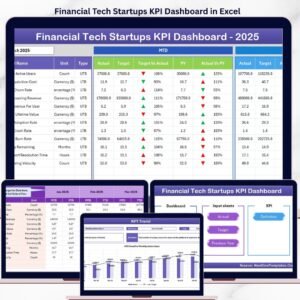
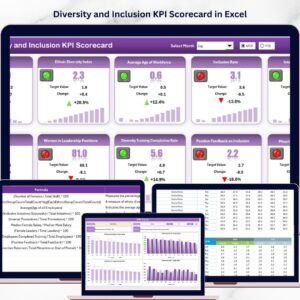
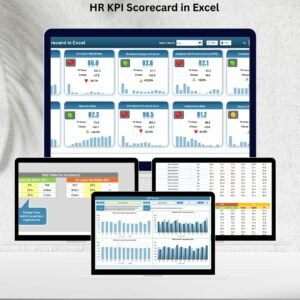
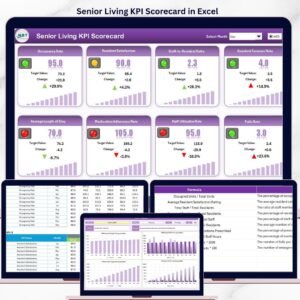
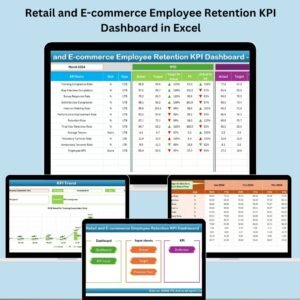
📊 Dashboard Sheet – Monthly KPI Snapshot
-
Choose your reporting month with a drop-down
-
MTD and YTD comparison: Actual vs Target vs Previous Year
-
Conditional formatting with up/down arrows for quick performance insights
📈 KPI Trend Sheet – Monthly Trajectory Tracking
-
Select any KPI from a drop-down
-
View trend charts for MTD & YTD Actuals, Targets, and Previous Year
-
Auto-display KPI definitions, units, and formulas for full transparency
📥 Input Sheets – Simple Data Entry
-
Actual Numbers Input: Enter real-time performance data monthly
-
Target Sheet: Set monthly MTD/YTD targets for each KPI
-
Previous Year Numbers: Store last year’s data for YoY comparisons
📘 KPI Definition Sheet – Your Internal Metric Guide
-
Define each KPI’s formula, unit, and explanation
-
Keeps your HR and operations teams aligned on what matters
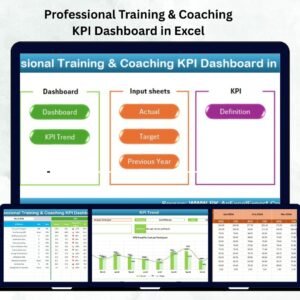
📂 What’s Inside the Template
Download the file and you’ll get:
✅ 7 Interconnected Excel Worksheets
✅ Real-time charts with automatic updates
✅ Data validation and drop-down selectors
✅ Predefined formulas and KPI logic
✅ Conditional formatting for red/green trends
✅ Fully editable and scalable layout
Whether you’re running a single storefront or managing hundreds of warehouse and customer support employees, this template adapts to your needs.
🛠️ How to Use the Dashboard (Step-by-Step)
1️⃣ Set Your Start Month – Go to the Actual Numbers Input sheet and select your fiscal start month.
2️⃣ Enter Actual Data – Log monthly MTD and YTD values for each KPI.
3️⃣ Add Targets – Switch to the Target sheet and enter performance goals.
4️⃣ Include Previous Year – Input last year’s figures for comparative insights.
5️⃣ View Performance – Head to the Dashboard tab, select a month, and watch the visuals auto-update.
6️⃣ Analyze Trends – Deep dive into the KPI Trend tab and monitor progress over time.
7️⃣ Maintain Definitions – Use the KPI Definition sheet to keep formulas consistent and auditable.
👥 Who Should Use This Dashboard?
Ideal for:
🧑💼 HR Departments – Track turnover, absenteeism, and engagement
📈 Operations Teams – Monitor employee stability and plan better staffing
🛍️ Retail Store Managers – Identify frontline trends affecting customer experience
💻 E-commerce Teams – Improve retention in support and logistics
📣 Business Leaders – Get big-picture clarity on your workforce health
✅ Click here to read the Detailed blog post
🔗 Visit our YouTube channel to learn step-by-step video tutorials


Reviews
There are no reviews yet.