Hiring the right talent is one of the most critical factors for business success. However, many organizations struggle to track recruitment performance effectively. HR teams often rely on scattered spreadsheets, emails, and manual reports to monitor hiring metrics, which makes it difficult to identify bottlenecks or evaluate recruitment efficiency.
This is exactly where the Recruitment KPI Scorecard in Excel becomes a powerful solution.
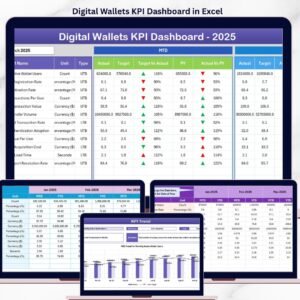
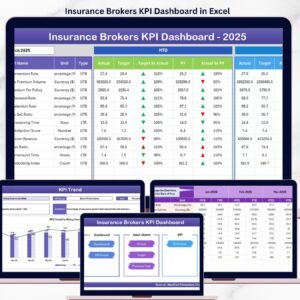
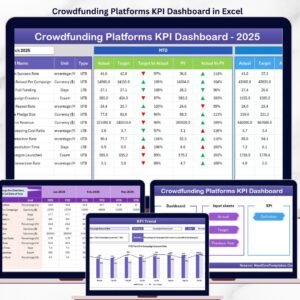
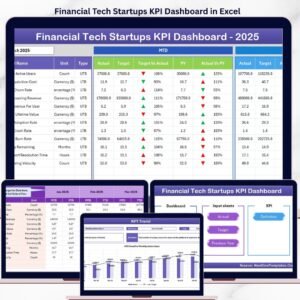
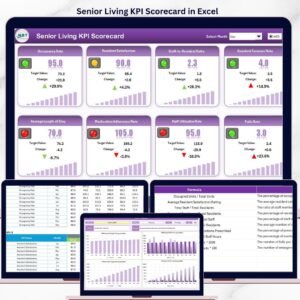
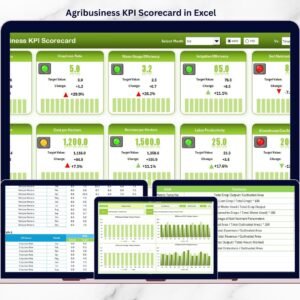
The Recruitment KPI Scorecard in Excel is a ready-to-use HR analytics template designed to help recruitment managers, HR professionals, and talent acquisition teams track key recruitment performance indicators in a structured and visual format. Instead of analyzing multiple recruitment reports, this Excel scorecard consolidates all essential hiring metrics into a single interactive interface.
With clear KPI definitions, automated comparisons, trend analysis charts, and intuitive visual indicators, the scorecard allows organizations to monitor recruitment performance, identify improvement areas, and make data-driven hiring decisions.
Whether your organization handles high-volume hiring or strategic talent acquisition, this recruitment scorecard provides a clear overview of recruitment effectiveness.
By using this template, HR teams can easily compare Actual vs Target performance, monitor Month-To-Date (MTD) and Year-To-Date (YTD) results, and analyze historical recruitment trends.
As a result, organizations gain improved visibility into hiring processes and can continuously optimize recruitment strategies.
🚀 Key Features of Recruitment KPI Scorecard in Excel
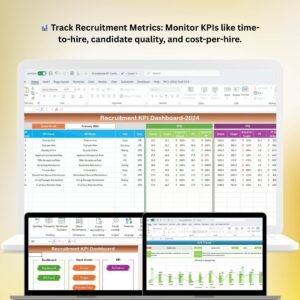
📊 Comprehensive Recruitment KPI Tracking
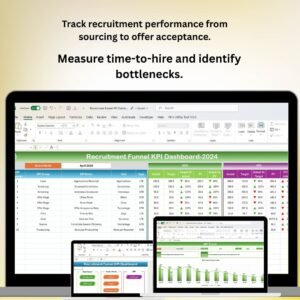
Monitor multiple hiring metrics such as time-to-hire, offer acceptance rate, hiring efficiency, recruitment costs, and candidate conversion rates.
📅 Flexible Time Analysis (MTD & YTD)
Easily switch between Month-To-Date (MTD) and Year-To-Date (YTD) views to evaluate recruitment performance across different time frames.
🎯 Actual vs Target Performance Comparison
Quickly determine whether recruitment KPIs meet organizational targets using automated comparisons.
⚡ Visual Performance Indicators
Color-coded indicators and conditional formatting help HR teams instantly identify high-performing and underperforming metrics.
📈 KPI Trend Analysis Charts
Analyze recruitment performance trends using graphical views that compare Actual, Target, and Previous Year results.
📑 Clear KPI Definitions and Formulas
Each KPI includes definitions, formulas, units, and classification (Lower the Better or Upper the Better) for better understanding.
📂 Simple Data Input System
A dedicated input sheet allows easy entry of recruitment data without affecting the dashboard structure.
🧭 User-Friendly Interface
The dashboard layout ensures HR teams can navigate between scorecard pages and insights effortlessly.
📦 What’s Inside the Recruitment KPI Scorecard in Excel
This Excel template includes four well-structured worksheets designed to simplify recruitment analytics and performance monitoring.
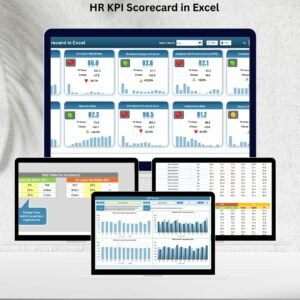
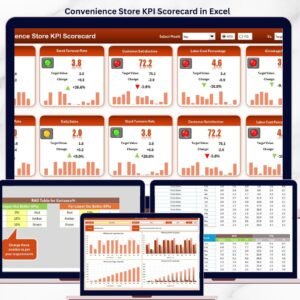
📊 Scorecard Sheet – Recruitment Performance Overview
This sheet acts as the main dashboard of the template.
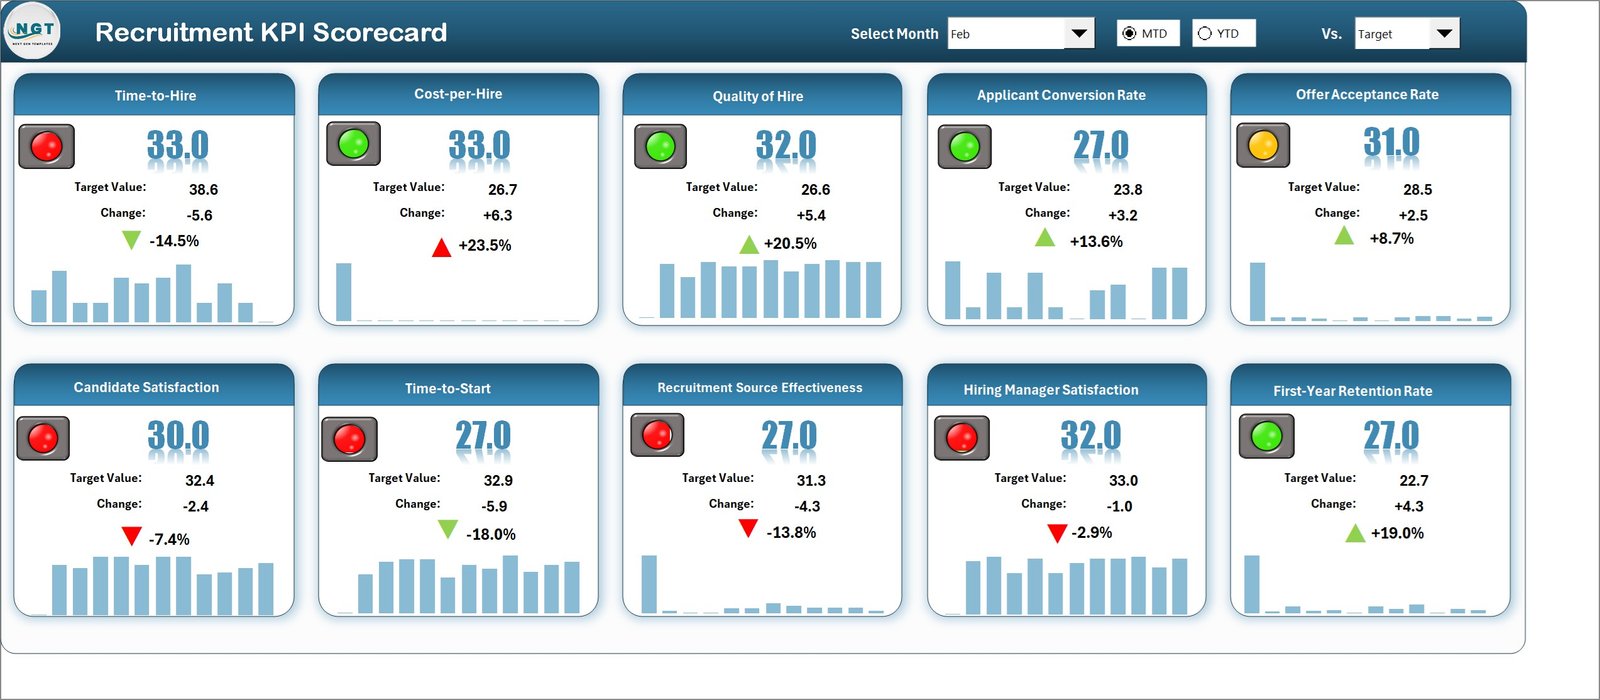
It allows users to:
-
Select month and KPI analysis type (MTD or YTD) using dropdown menus
-
Compare Actual vs Target recruitment metrics
-
View color-coded indicators for quick performance evaluation
-
Analyze all KPIs in one centralized scorecard view
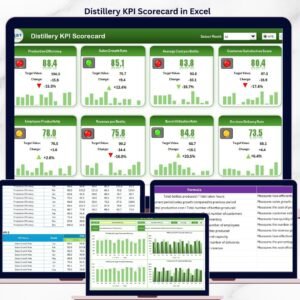
📈 KPI Trend Sheet – Performance Trend Analysis
This sheet enables deeper analysis of recruitment KPIs.
Users can select a KPI from a dropdown list and view detailed KPI information including:
-
KPI Group
-
Unit of Measure
-
KPI Type (Lower the Better or Upper the Better)
-
KPI Formula
-
KPI Definition
Additionally, the sheet displays MTD and YTD trend charts showing Actual, Target, and Previous Year performance data.
📥 Input Data Sheet – Recruitment Data Entry
This sheet serves as the data entry hub for the scorecard.
Users can easily update recruitment metrics including actual values, targets, and related data to keep the scorecard current.
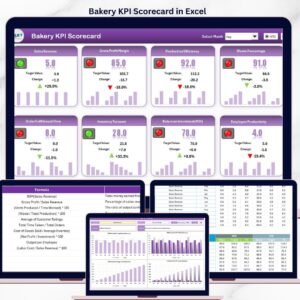
📑 KPI Definition Sheet – KPI Documentation
This sheet stores all KPI metadata including:
-
KPI Name
-
KPI Group
-
Unit of Measurement
-
Formula Used
-
KPI Definition and explanation
This ensures every KPI is clearly defined and standardized across the organization.
🛠 How to Use the Recruitment KPI Scorecard in Excel
Using this template is extremely simple and requires only basic Excel knowledge.
1️⃣ Define recruitment KPIs in the KPI Definition sheet.
2️⃣ Enter monthly recruitment performance data in the Input Data sheet.
3️⃣ Update target values for each KPI.
4️⃣ Select the desired month and analysis type (MTD or YTD) from the dropdown menu.
5️⃣ Review the scorecard dashboard and trend charts to evaluate recruitment performance.
Once the data is updated, the scorecard automatically displays performance comparisons and visual indicators.
HR managers can quickly identify recruitment bottlenecks, evaluate hiring efficiency, and adjust recruitment strategies.
👥 Who Can Benefit from This Recruitment KPI Scorecard in Excel
This template is extremely valuable for organizations and professionals involved in recruitment management.
👨💼 HR Managers – Monitor recruitment performance and improve hiring efficiency.
📊 Talent Acquisition Teams – Track recruitment KPIs and optimize candidate sourcing strategies.
🏢 HR Directors – Evaluate hiring outcomes and align recruitment strategies with business goals.
📈 HR Analysts – Analyze recruitment data trends and generate actionable insights.
🏭 Organizations of All Sizes – Implement structured recruitment performance tracking.
By using this scorecard, organizations can enhance transparency, accountability, and data-driven recruitment decisions.
Click hare to read the Detailed blog post
Visit our YouTube channel to learn step-by-step video tutorials
👉 https://youtube.com/@PKAnExcelExpert