



The Blockchain & Cryptocurrency KPI Dashboard in Excel is a powerful tool for investors, traders, and blockchain enthusiasts who want to track, monitor, and optimize their cryptocurrency portfolio performance. Whether you’re trading on various cryptocurrency exchanges, investing in blockchain projects, or managing a decentralized finance (DeFi) portfolio, this customizable Excel template enables you to track key performance indicators (KPIs) and make data-driven decisions to improve your crypto investments.
With this easy-to-use dashboard, you can monitor real-time market prices, track portfolio performance, evaluate transaction history, and manage risk, helping you make informed decisions in the volatile world of cryptocurrencies. This tool provides an overview of your cryptocurrency assets, market trends, and profit/loss metrics, enabling you to optimize your investment strategy.
Key Features of the Blockchain Cryptocurrency KPI Dashboard
💰 Comprehensive Portfolio Tracking
Track the performance of your crypto assets, including Bitcoin, Ethereum, and other altcoins. Monitor price fluctuations, portfolio value, and individual cryptocurrency performance.
⚡ Real-Time Price Monitoring
Stay updated with real-time cryptocurrency prices and track changes in market value. Easily view current market trends and make informed decisions based on up-to-the-minute data.
📈 Transaction History & Profit/Loss Calculation
Record your transactions, track purchase prices, and calculate profits or losses. This allows you to evaluate your overall portfolio performance and optimize your trading strategy.
📅 Customizable KPIs for Cryptocurrency Tracking
Easily adjust the dashboard to track KPIs relevant to your crypto investment goals, including transaction volume, asset allocation, and profit margins.
🖥️ Interactive & User-Friendly Interface
This Excel-based dashboard is designed to be simple and intuitive, allowing you to input data, track your cryptocurrency investments, and visualize performance trends easily.
Why You’ll Love the Blockchain Cryptocurrency KPI Dashboard

✅ Track Your Cryptocurrency Portfolio
Monitor and manage your cryptocurrency investments by tracking key metrics such as portfolio value, market prices, and asset performance across multiple cryptocurrencies.
✅ Optimize Your Trading & Investment Strategy
Evaluate transaction history and profits to identify the most successful strategies and optimize your portfolio’s performance. Maximize returns and minimize risk based on your data.
✅ Monitor Market Trends in Real-Time
Stay updated on market fluctuations with real-time price tracking. This enables you to react to market changes quickly and capitalize on investment opportunities.
✅ Visualize Your Investment Performance
With interactive charts and graphs, easily visualize portfolio performance, profits, losses, and market trends, making it easier to identify areas for improvement.
✅ Customizable for Any Crypto Investor
Tailor the dashboard to fit your cryptocurrency portfolio’s unique needs, whether you’re a day trader, long-term investor, or managing a DeFi portfolio.
What’s Inside the Blockchain Cryptocurrency KPI Dashboard Template?
- Portfolio Performance Tracking: Track the value of your crypto assets, including Bitcoin, Ethereum, and altcoins.
- Transaction History: Record and track purchase prices, transaction volume, and profits or losses.
- Real-Time Market Data: Monitor live cryptocurrency prices and market trends.
- Customizable KPIs: Track metrics specific to your crypto investment strategy.
- Profit & Loss Calculation: Calculate profits and losses on each transaction to evaluate investment performance.
- Visual Insights: Use charts and graphs to visualize trends, portfolio performance, and market fluctuations.
How to Use the Blockchain Cryptocurrency KPI Dashboard
1️⃣ Download the Template: Get instant access to the Blockchain Cryptocurrency KPI Dashboard.
2️⃣ Enter Crypto Data: Input your cryptocurrency holdings, transaction history, and current market prices.
3️⃣ Track Portfolio Performance: Use the dashboard to monitor your assets’ performance, profits, and losses.
4️⃣ Analyze & Optimize: Leverage insights from the dashboard to make informed decisions, optimize your investment strategy, and manage risk effectively.
Who Can Benefit from the Blockchain Cryptocurrency KPI Dashboard?
🔹 Crypto Investors & Traders
🔹 Blockchain Enthusiasts & DeFi Investors
🔹 Portfolio Managers & Financial Advisors
🔹 Cryptocurrency Analysts & Researchers
🔹 Anyone Looking to Track & Optimize Cryptocurrency Investments
Track, analyze, and optimize your cryptocurrency portfolio with the Blockchain Cryptocurrency KPI Dashboard in Excel. Monitor your investments, assess market trends, and make data-driven decisions to maximize returns and minimize risk.
Click here to read the Detailed blog post
Visit our YouTube channel to learn step-by-step video tutorials
Youtube.com/@PKAnExcelExpert
Compatibility and Requirements
- Works in Microsoft Excel desktop (Excel 2016 or later, or Microsoft 365).
- Results are shown in charts and graphs. Microsoft explains Excel charts in Create a chart from start to finish.
Frequently Asked Questions
What does the crypto KPI dashboard track?
It tracks portfolio value, individual coin performance, transaction history, profit and loss, and KPIs such as transaction volume and asset allocation.
Which coins can I track?
You can track Bitcoin, Ethereum and other altcoins that you hold.
Where do the prices come from?
You enter your holdings, transactions and current market prices, and the dashboard calculates performance from them.
Does it calculate profit and loss?
Yes. It uses your purchase prices to work out the profit or loss on each transaction.
Is there a Power BI version?
Yes. The Blockchain & Cryptocurrency KPI Dashboard in Power BI covers the same KPIs in Power BI.
Related Blockchain and Crypto Templates
- Blockchain & Cryptocurrency KPI Dashboard in Power BI: the same KPIs in Power BI
- Blockchain & Cryptocurrency KPI Dashboard in Google Sheets: the same KPIs in Google Sheets
- Blockchain & Cryptocurrency KPI Scorecard in Excel: a scorecard view of crypto KPIs
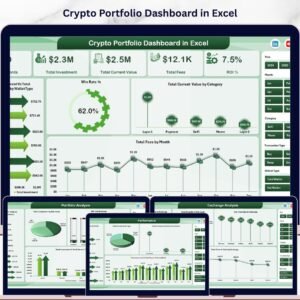
- Crypto Portfolio Dashboard in Excel: follow your coin holdings
- Blockchain & Cryptocurrency Dashboard in Excel: a full crypto dashboard in Excel
Browse all Excel KPI dashboards or the Excel financial tools.



















Reviews
There are no reviews yet.