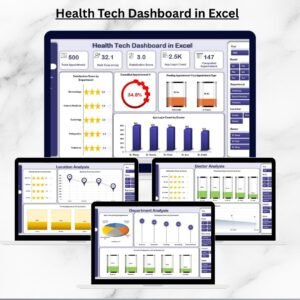
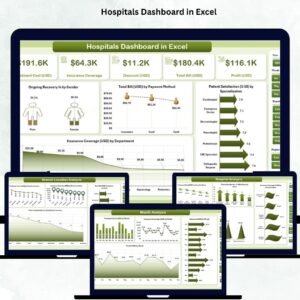
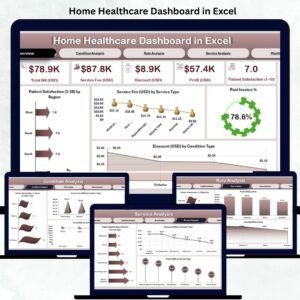
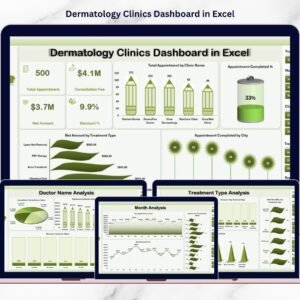
The demand for alternative and holistic healthcare continues to rise as patients increasingly prefer natural healing methods such as Ayurveda, acupuncture, naturopathy, chiropractic therapy, and wellness treatments. However, as clinics grow, managing appointments, practitioners, treatments, revenue, and patient satisfaction using scattered spreadsheets becomes challenging.
The Alternative Medicine Dashboard in Excel provides a smart and structured solution.
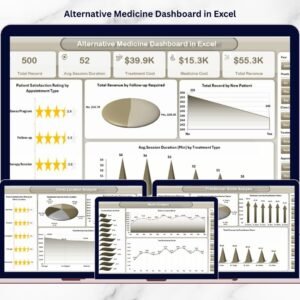
This ready-to-use Excel dashboard converts everyday clinic data into meaningful visual insights. Instead of reviewing multiple reports manually, clinic managers can monitor operational performance, treatment effectiveness, practitioner productivity, and financial outcomes from one centralized dashboard.
Designed specifically for alternative medicine clinics and wellness centers, this dashboard enables faster decision-making, improved patient experience, and better financial control — all without expensive healthcare software.
🔑 Key Feature of Alternative Medicine Dashboard in Excel
📊 Centralized Clinic Performance Monitoring
Track treatments, practitioners, revenue, and patient satisfaction in one place.
🎯 Interactive Slicers & Filters
Analyze data dynamically by month, practitioner, treatment type, or clinic location.
⭐ Patient Satisfaction Tracking
Monitor ratings to improve service quality and patient experience.
💰 Revenue & Cost Analysis
Compare treatment revenue with medicine and operational costs.
👩⚕️ Practitioner Performance Insights
Evaluate productivity and performance using real data.
🏥 Multi-Location Clinic Analysis
Compare performance across branches instantly.
📅 Monthly Trend Monitoring
Identify seasonal performance patterns and growth opportunities.
⚡ Automatic Dashboard Updates
Refresh data and update visuals instantly.
🧩 Fully Customizable Excel Template
Adapt KPIs and charts according to clinic operations.
📦 What’s Inside the Alternative Medicine Dashboard in Excel
This dashboard includes five interactive analytical pages:

✔️ Overview Page – Complete clinic performance snapshot
✔️ Clinic Location Analysis – Branch performance comparison
✔️ Practitioner Name Analysis – Practitioner productivity insights
✔️ Treatment Type Analysis – Treatment profitability evaluation
✔️ Month Analysis – Time-based performance trends
Supporting sheets:
Data Sheet – Central operational data entry
Support Sheet – Backend calculations and validation lists
Together, these components create a professional healthcare analytics system.
🛠️ How to Use the Alternative Medicine Dashboard in Excel
Follow these simple steps:
Step 1: Enter clinic records into the Data Sheet
Step 2: Add treatment, practitioner, and revenue information
Step 3: Refresh Pivot Tables if required
Step 4: Apply slicers to filter insights instantly
Step 5: Review KPI cards and charts
Step 6: Take action based on insights
Within minutes, clinics gain complete visibility into operations.
🎯 Who Can Benefit from This Alternative Medicine Dashboard in Excel
This dashboard is ideal for:
✅ Ayurveda Clinics
✅ Naturopathy Centers
✅ Acupuncture Clinics
✅ Chiropractic Practices
✅ Holistic Wellness Centers
✅ Alternative Therapy Studios
✅ Clinic Administrators & Managers
Both small clinics and multi-location healthcare organizations can use this solution effectively.
Why This Dashboard Improves Clinic Performance
Instead of relying on manual analysis, clinics can:
✔️ Identify profitable treatments
✔️ Improve patient satisfaction levels
✔️ Monitor practitioner efficiency
✔️ Control treatment and medicine costs
✔️ Track revenue growth clearly
✔️ Make faster data-driven decisions
As a result, clinics achieve sustainable growth and enhanced patient care.
### Click hare to read the Detailed blog post
📺 Visit our YouTube channel to learn step-by-step video tutorials
👉 Youtube.com/@PKAnExcelExpert
Watch the step-by-step video tutorial:
Compatibility and Requirements
- Works in Microsoft Excel desktop (Excel 2016 or later, or Microsoft 365).
- The dashboard uses Pivot Tables and slicers. Microsoft explains slicers in Use slicers to filter data.
Frequently Asked Questions
Which pages does the dashboard have?
Five analysis pages: Overview, Clinic Location Analysis, Practitioner Name Analysis, Treatment Type Analysis and Month Analysis. Two supporting sheets hold the data: the Data Sheet and the Support Sheet.
How do I add my own clinic data?
Enter your records in the Data Sheet, including treatment, practitioner and revenue details. Refresh the Pivot Tables if needed and the charts and KPI cards update.
Can I filter the dashboard by practitioner or treatment?
Yes. Slicers let you filter by month, practitioner, treatment type or clinic location.
Can I compare more than one clinic location?
Yes. The Clinic Location Analysis page compares performance across branches.
Is there a Power BI version?
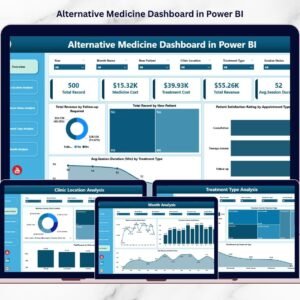
Yes. See the Alternative Medicine Dashboard in Power BI.
Related Healthcare Templates
- Alternative Medicine KPI Dashboard in Excel: a KPI view for the same type of clinic
- Alternative Medicine Dashboard in Power BI: the Power BI edition of this dashboard
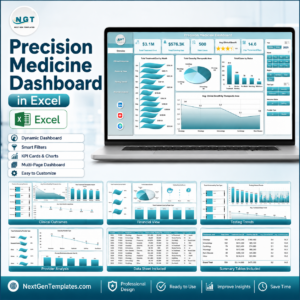
- Precision Medicine Dashboard in Excel: a healthcare dashboard for another medical field
- Telemedicine Platforms KPI Dashboard in Excel: KPIs for remote care services
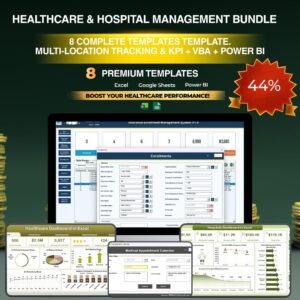
- Healthcare & Hospital Management Bundle: 8 healthcare templates in one download
Browse all Excel dashboards.