Managing company vehicles should not feel like chasing fuel bills, insurance papers, and maintenance logs across multiple files. If your organization operates office vehicles, you already know how quickly costs add up. Fuel prices fluctuate. Maintenance expenses increase. Insurance premiums rise. Departments use vehicles differently. Vendors charge differently.
Without a centralized system, tracking everything becomes chaotic.
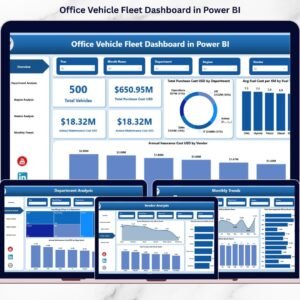
That is exactly why the Office Vehicle Fleet Dashboard in Power BI is built.
This ready-to-use Power BI solution transforms scattered fleet data into one powerful, interactive dashboard. Instead of manual calculations and disconnected spreadsheets, you get real-time insights into vehicle costs, usage, downtime, and vendor performance — all in one place.
If you want better control, smarter budgeting, and improved fleet efficiency, this dashboard is your game-changing solution.
🚀 Key Features of Office Vehicle Fleet Dashboard in Power BI
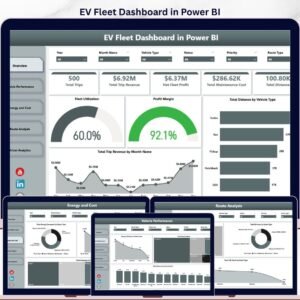
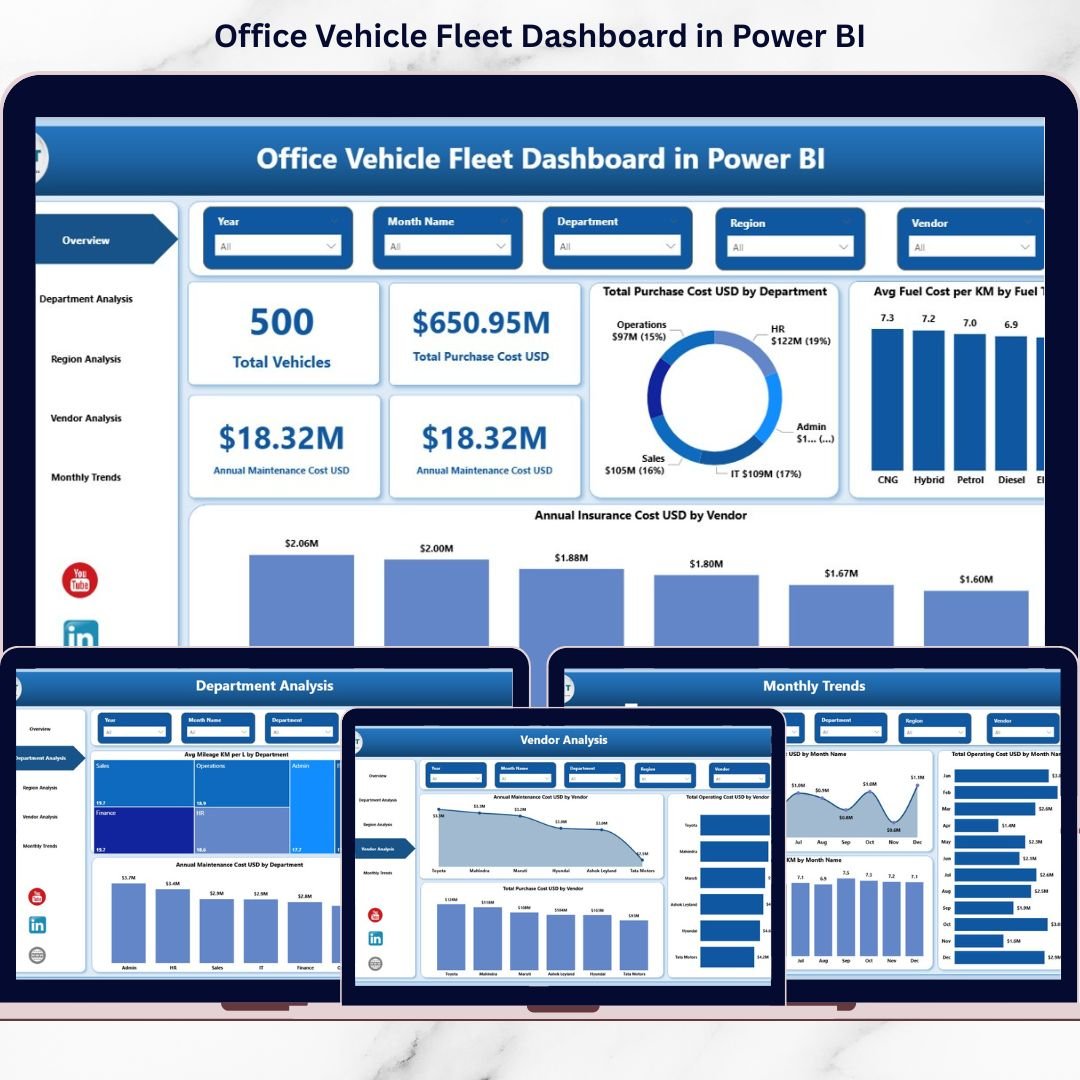
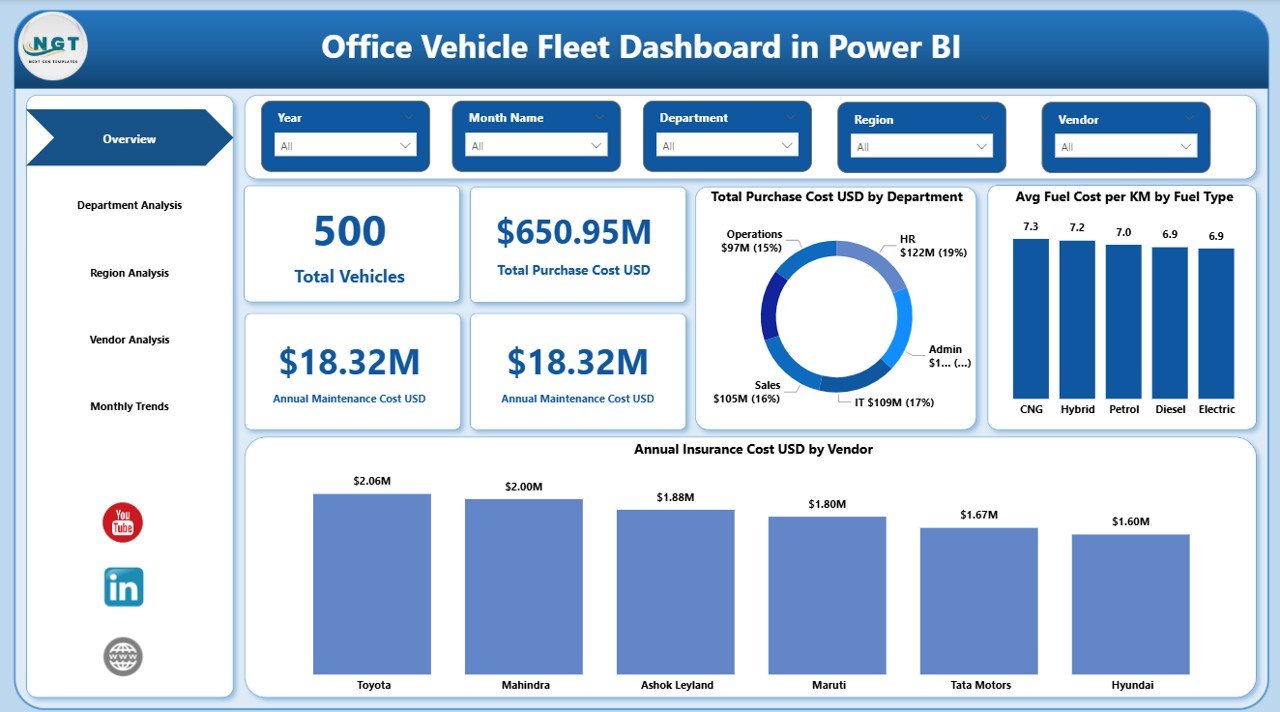
📊 5 Fully Interactive Dashboard Pages
Analyze fleet performance from multiple perspectives including overview, department, region, vendor, and monthly trends.
📌 Powerful KPI Cards
Instantly track Total Vehicles, Purchase Cost, Maintenance Cost, Insurance Cost, Operating Cost, Downtime Days, and Mileage.
🎯 Dynamic Slicers & Filters
Filter by Year, Department, Region, or Vendor with just one click for instant insights.
💰 Complete Cost Visibility
Monitor financial KPIs like purchase cost, maintenance cost, insurance expenses, and total operating cost.
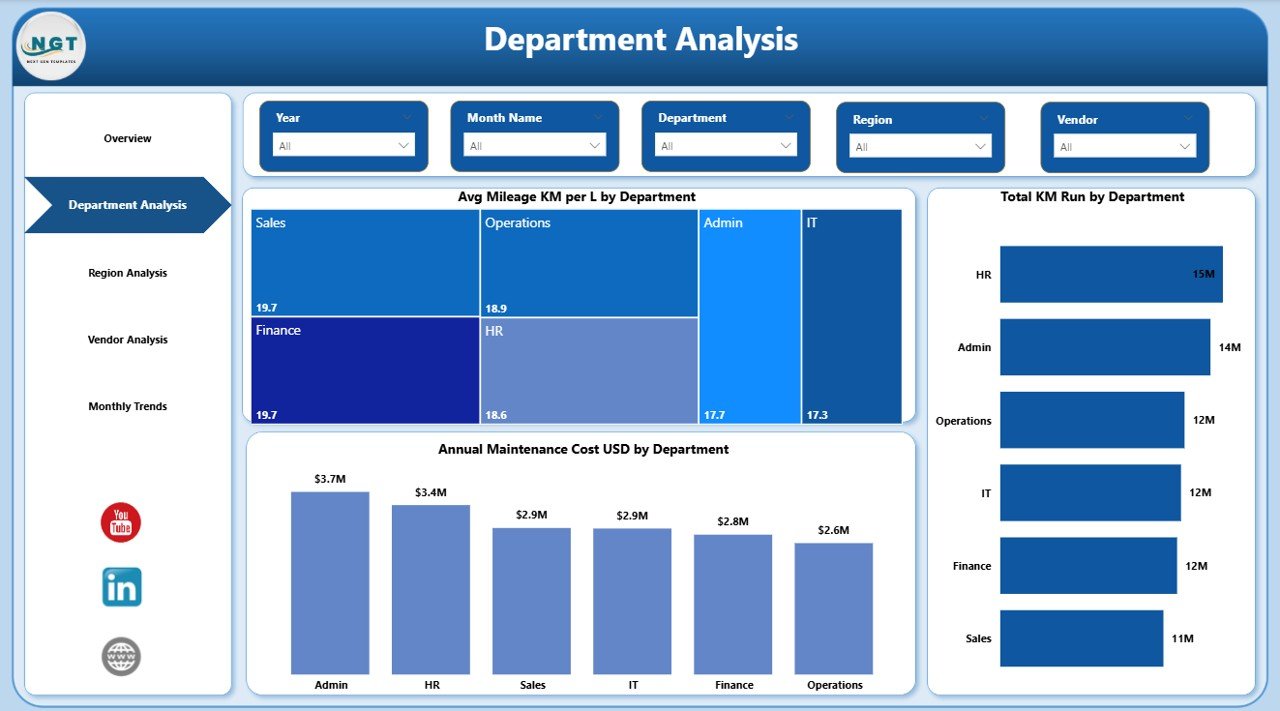
🏢 Department Usage Analysis
Compare vehicle usage, mileage efficiency, and maintenance expenses across departments.
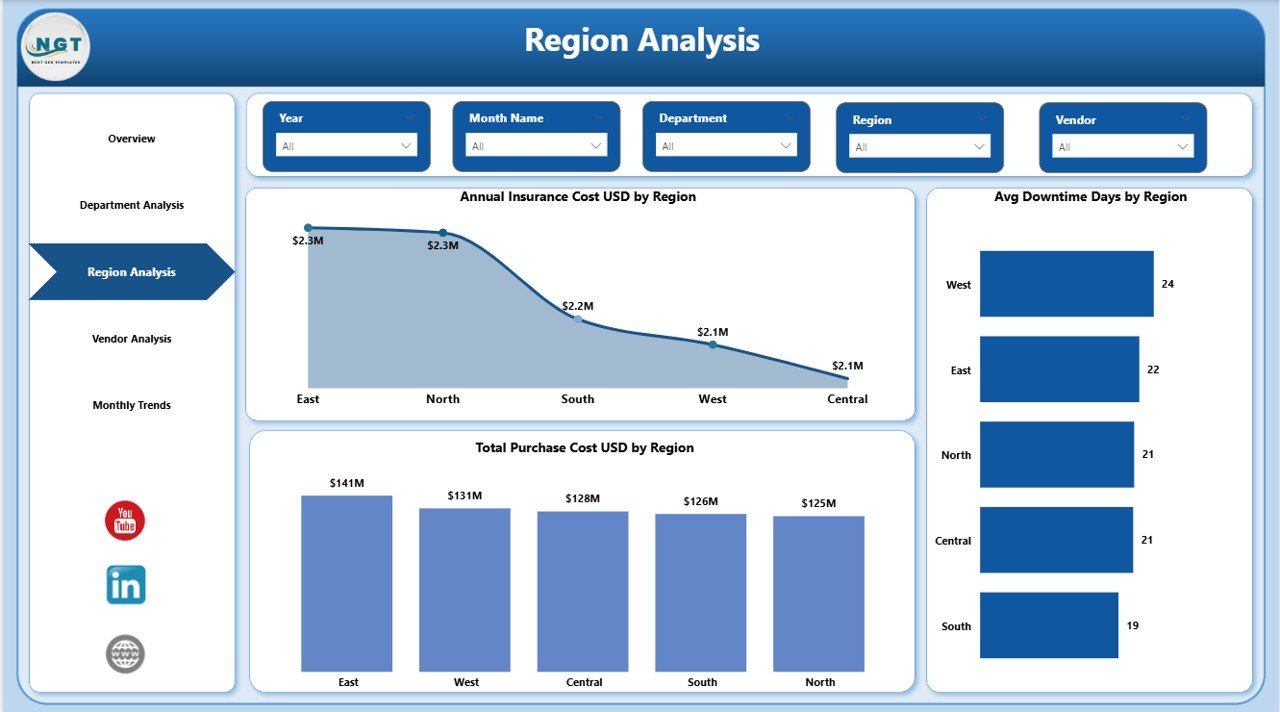
🌍 Region-Based Performance Tracking
Identify high-cost regions, downtime patterns, and capital investments geographically.
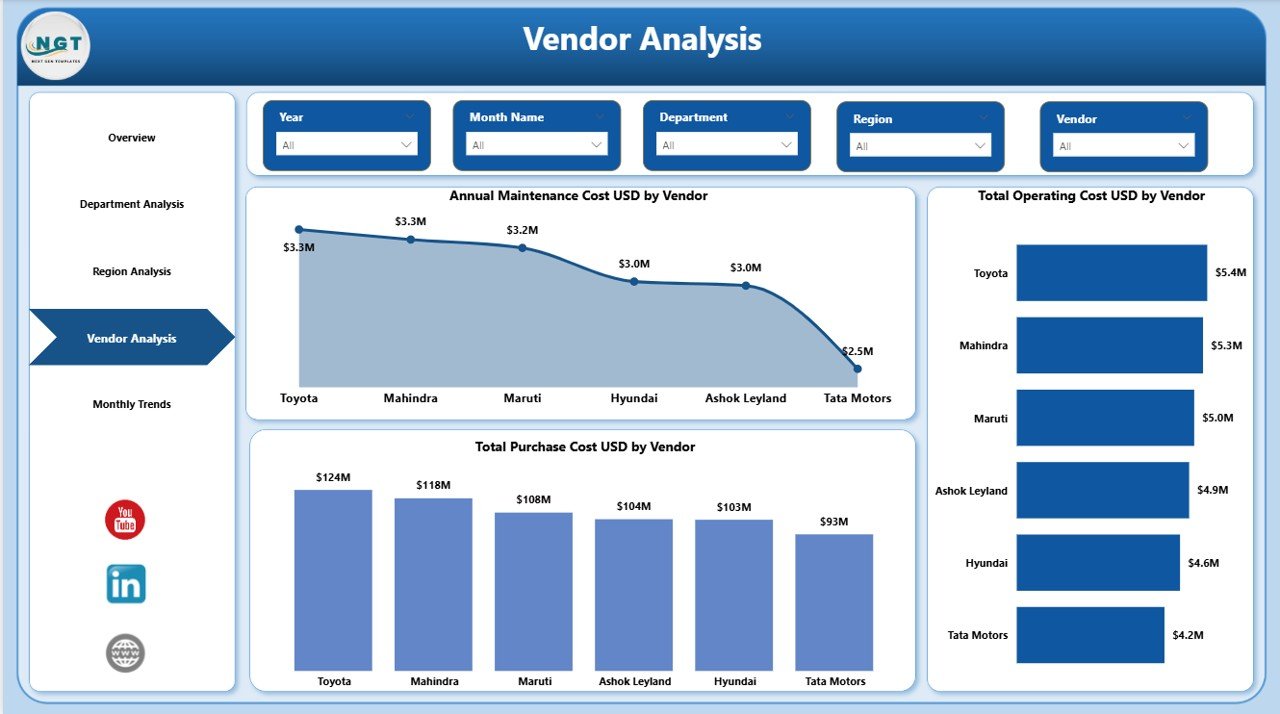
🤝 Vendor Performance Comparison
Evaluate vendor costs versus performance to negotiate better contracts.
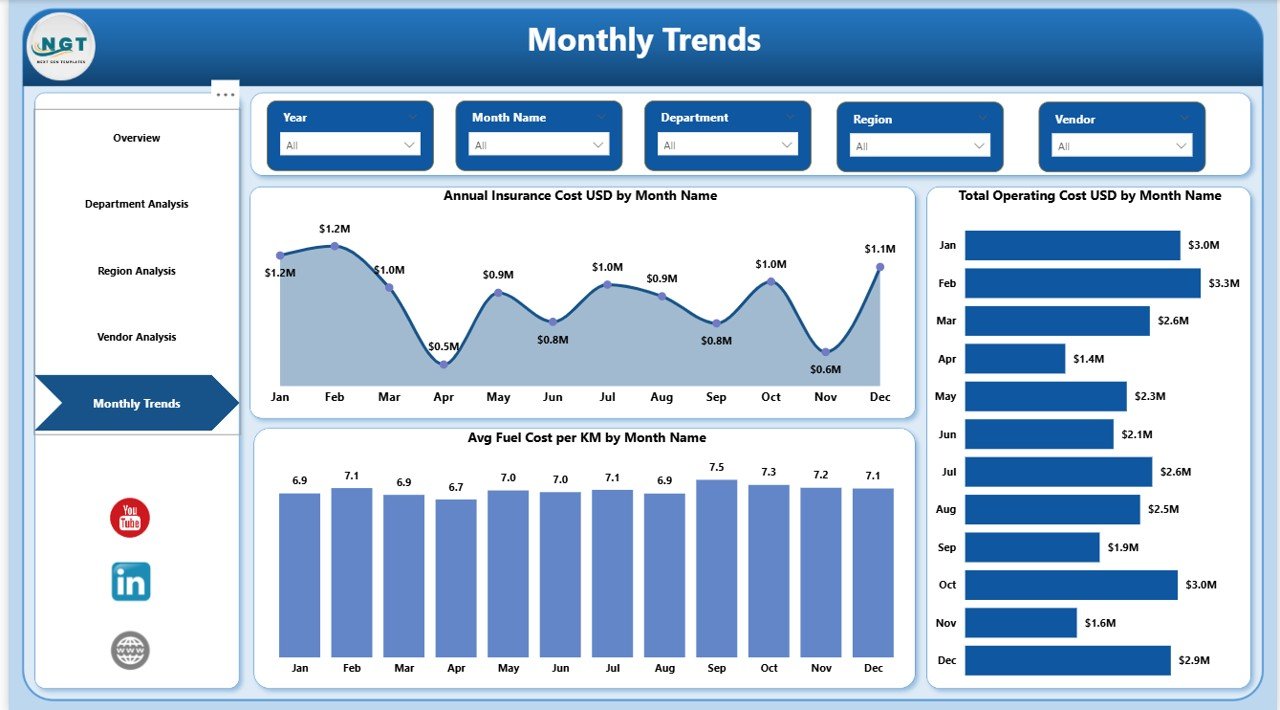
📈 Monthly Cost Trend Analysis
Track operating and insurance costs month-by-month to plan budgets effectively.
⚡ Real-Time Business Intelligence
Power BI visuals provide instant clarity and faster decision-making.
📦 What’s Inside the Office Vehicle Fleet Dashboard in Power BI
When you download this product, you receive:
✔ A ready-to-use Power BI (.pbix) dashboard file
✔ 5 structured and professionally designed report pages
✔ Pre-built KPI measures and calculations
✔ Interactive slicers for easy data filtering
✔ Clean and organized data model
✔ Sample data structure for easy customization
✔ Fully formatted visualizations and charts
✔ User-friendly layout designed for decision-makers
The dashboard is built with a clear structure so you can easily replace the sample data with your organization’s real fleet data.
No complex coding. No complicated setup. Just plug in your data and start analyzing.
🛠 How to Use the Office Vehicle Fleet Dashboard in Power BI
Using this dashboard is simple and straightforward:
1️⃣ Open the Power BI file.
2️⃣ Connect or replace the sample data with your fleet dataset.
3️⃣ Ensure columns like Vehicle, Department, Region, Vendor, Cost, Mileage, and Date are properly mapped.
4️⃣ Use slicers to filter by department, year, region, or vendor.
5️⃣ Review KPIs and charts for actionable insights.
You can update your data monthly or weekly for better accuracy. The dashboard will automatically refresh calculations and visuals.
Within minutes, you can identify:
-
Which department consumes the most fuel
-
Which vendor costs more
-
Which region has higher downtime
-
How monthly operating costs fluctuate
This is not just a report. It is a decision-making engine.
🎯 Who Can Benefit from This Office Vehicle Fleet Dashboard in Power BI
This dashboard is ideal for:
🏢 Corporate Offices managing official vehicles
🚚 Logistics & Transportation Departments
💼 Sales Teams with field vehicles
🏥 Healthcare Institutions
🏫 Educational Organizations
🏭 Manufacturing Companies
🏛 Government Agencies
If your organization operates multiple vehicles and wants financial clarity, cost control, and operational efficiency, this dashboard becomes essential.
Why This Dashboard Is a Must-Have
Fleet expenses often remain unnoticed until budgets overflow. This dashboard eliminates blind spots. It improves accountability. It strengthens vendor negotiation. It supports strategic planning.
Instead of reacting to rising costs, you proactively manage them.
This is not just a dashboard. It is your fleet command center.
Click here to read the Detailed blog post
Visit our YouTube channel to learn step-by-step video tutorials
Watch the step-by-step video tutorial: