



Electricity procurement is one of the largest and most recurring operational expenses for organizations. Electricity Procurement Dashboard in Excel Whether you manage manufacturing units, commercial facilities, data centers, utilities, or public infrastructure, electricity costs directly impact profitability and sustainability. However, when procurement data is spread across multiple spreadsheets and manual reports, visibility drops. As a result, cost overruns increase, supplier inefficiencies go unnoticed, and decisions become reactive.
That is exactly why the Electricity Procurement Dashboard in Excel becomes an essential solution.
Electricity Procurement Dashboard in Excel This ready-to-use Excel dashboard transforms raw electricity procurement data into clear KPIs, interactive charts, and actionable trends. Instead of analyzing complex tables, procurement teams, finance managers, energy professionals, and leadership gain instant insight into gross cost, net procurement cost, tax impact, supplier performance, contract efficiency, energy mix, and monthly trends—all in one structured Excel file.
Because it is built entirely in Excel, this dashboard is easy to use, flexible, cost-effective, and fully customizable, without requiring Power BI or any external tools
🔑 Key Features of Electricity Procurement Dashboard in Excel
⚡ Centralized Electricity Procurement Analysis
Track all electricity procurement data in one structured Excel dashboard.
💰 Complete Cost & Tax Transparency
Analyze Gross Cost, Net Procurement Cost, Tax Amount, and Tax Impact % clearly.
🏢 Utility Supplier Performance Analysis
Compare electricity cost and volume across utility suppliers.
📑 Contract Type Cost Evaluation
Understand how different contract types impact cost, tax, and transmission charges.
🌱 Energy Source & Sustainability Insights
Analyze procurement cost by energy source and support renewable planning.
📅 Monthly Trend Analysis
Track procurement cost, tax, and spending behavior over time.
🧭 Page Navigator for Smooth Navigation
Move instantly between analytical pages without searching sheets.
⚙️ 100% Excel-Based & Customizable
No macros, no BI tools—easy to edit, extend, and maintain.
📦 What’s Inside the Electricity Procurement Dashboard in Excel
This professionally designed dashboard includes five powerful analytical pages, supported by structured backend sheets.
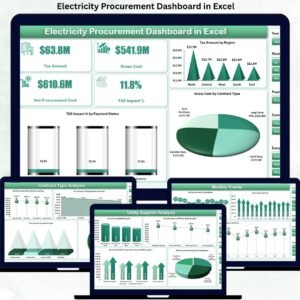
📊 Overview Page – Electricity Procurement Performance Snapshot

The Overview Page acts as the executive summary.
KPI Cards Display:
Tax Amount
Gross Cost
Net Procurement Cost
Tax Impact %
Charts Included:
Tax Amount by Region
Gross Cost by Contract Type
Tax Impact % by Payment Status
This page instantly explains where electricity money is going and why.
🏢 Utility Supplier Analysis Page
Evaluate supplier efficiency using:
Gross Cost by Utility Supplier
Units Purchased (MWh) by Utility Supplier
Gross Cost vs Net Procurement Cost by Utility Supplier
Net Procurement Cost by Utility Supplier
This analysis supports supplier comparison and contract negotiation.
📑 Contract Type Analysis Page
Understand procurement behavior across contracts:
Net Procurement Cost by Contract Type
Transmission Charges by Contract Type
Tax Impact % by Contract Type
Tax Amount by Contract Type
Helps optimize fixed, variable, long-term, and short-term contract decisions.
🌱 Energy Source Analysis Page
Analyze procurement cost by energy mix:
Tax Amount by Energy Source
Tax Impact % by Energy Source
Net vs Gross Procurement Cost by Energy Source
Transmission Charges by Energy Source
Supports renewable energy planning and ESG reporting.
📅 Monthly Trends Page
Track time-based procurement patterns:
Net Procurement Cost by Month
Gross Cost by Month
Tax Amount by Month
Ideal for budgeting, forecasting, and seasonal analysis.
🗂️ Data Sheet & Support Sheet
Data Sheet stores raw procurement data (supplier, contract, region, energy source, tax, cost, units).
Support Sheet handles calculations, helper columns, and validations.
This structure keeps the dashboard accurate, scalable, and easy to update.
▶️ How to Use the Electricity Procurement Dashboard in Excel
1️⃣ Enter or update electricity procurement data in the Data Sheet
2️⃣ Maintain consistent supplier, contract, and energy source names
3️⃣ Review KPIs on the Overview Page
4️⃣ Analyze suppliers, contracts, and energy sources
5️⃣ Monitor tax impact and hidden cost drivers
6️⃣ Use monthly trends for forecasting and budgeting
7️⃣ Make faster, data-driven procurement decisions
No advanced Excel skills required.
🎯 Who Can Benefit from This Dashboard
⚡ Energy & Electricity Managers
💼 Procurement & Sourcing Teams
💰 Finance & Accounting Professionals
🌱 Sustainability & ESG Teams
🏭 Operations & Plant Managers
🏛️ Senior Management & Decision-Makers
Perfect for organizations aiming to control electricity spend, improve transparency, and strengthen procurement strategy.
👉 Click here to read the Detailed Blog Post
🔔 Visit our YouTube channel for step-by-step Excel dashboard tutorials
👉 https://www.youtube.com/@PKAnExcelExpert
Watch the step-by-step video tutorial:
Compatibility and Requirements
- Works in Microsoft Excel desktop (Excel 2016 or later, or Microsoft 365).
- The dashboard has five analysis pages, a Data Sheet and a Support Sheet. Excel explains how to build charts like these in Create a chart from start to finish.
Frequently Asked Questions
Which pages are included?
Five analysis pages: Overview, Utility Supplier Analysis, Contract Type Analysis, Energy Source Analysis and Monthly Trends. A Data Sheet and a Support Sheet sit behind them.
Which KPIs does the Overview page show?
Four KPI cards: Tax Amount, Gross Cost, Net Procurement Cost and Tax Impact %. Charts below them show tax amount by region, gross cost by contract type and tax impact % by payment status.
Where do I enter my data?
Enter or update your electricity procurement data in the Data Sheet. It holds supplier, contract, region, energy source, tax, cost and units. The Support Sheet handles calculations, helper columns and validations.
Can I compare utility suppliers?
Yes. The Utility Supplier Analysis page shows gross cost, units purchased (MWh), gross cost vs net procurement cost and net procurement cost for each supplier.
Is there a Power BI version?
Yes. See the Electricity Procurement Dashboard in Power BI.
Related Procurement Templates
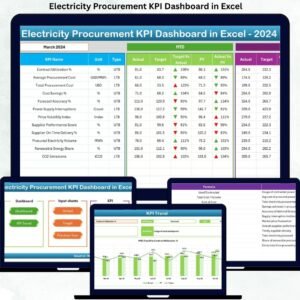
- Electricity Procurement KPI Dashboard in Excel: a KPI-focused view of electricity procurement
- Electricity Procurement Dashboard in Power BI: the Power BI edition
- Procurement Dashboard in Excel: general procurement analysis in Excel
- Procurement Spend Analysis Dashboard in Excel: spend analysis across suppliers
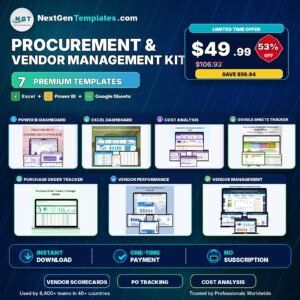
- Procurement and Vendor Management Kit: 7 procurement templates in one download
Browse all Excel dashboards.










Reviews
There are no reviews yet.