

Managing procurement in a clinic is a challenging task. Clinics deal with medicines, medical equipment, consumables, vendors, invoices, and strict budgets on a daily basis. When procurement data is scattered across Excel files and manual reports, visibility reduces, costs increase, and decision-making becomes slow and ineffective.
That is exactly why the Clinic Procurement Dashboard in Power BI is an essential solution. 🚀
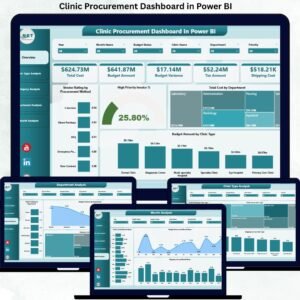
This professionally designed dashboard helps clinics track procurement activities, monitor vendor performance, analyze costs, and gain full control over purchasing operations using interactive and easy-to-understand visuals.
Built using Power BI with Excel as the data source, this dashboard allows clinics to manage procurement efficiently without technical complexity.
Key Features of Clinic Procurement Dashboard in Power BI 🔑
📊 Centralized Procurement Monitoring
Track all clinic procurement data from a single, interactive dashboard.
📈 Real-Time Cost & Budget Tracking
Monitor total cost, budget usage, and high-priority spending instantly.
🧭 Interactive Filters & Slicers
Analyze procurement data by clinic type, category, department, and month.
📉 Vendor Performance Analysis
Evaluate supplier ratings, shipping cost, and invoice behavior.
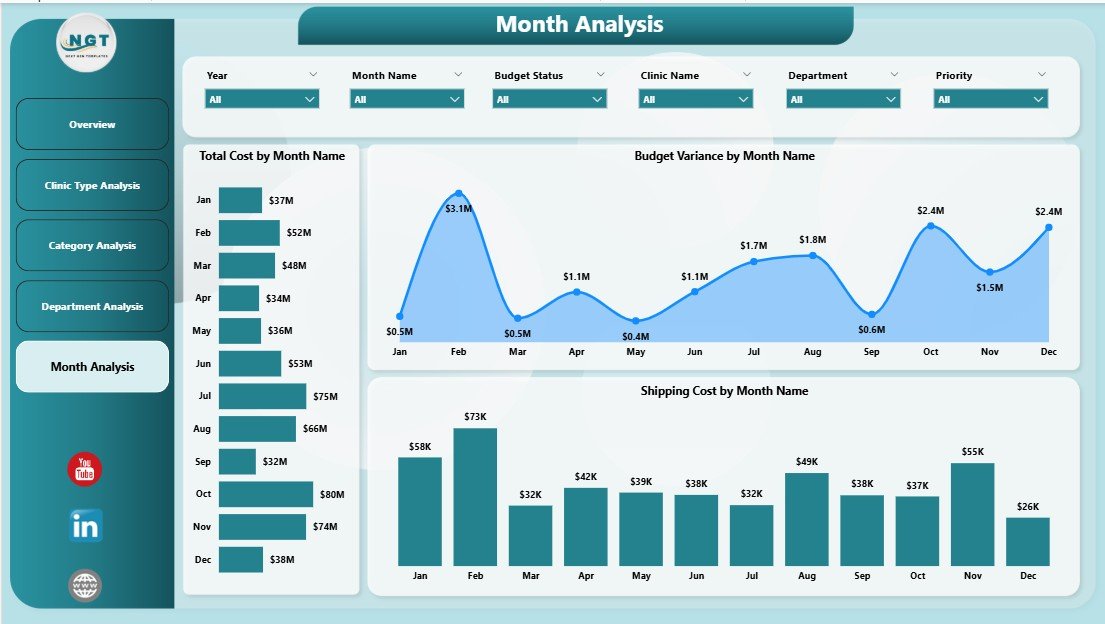
📅 Monthly Trend Analysis
Track procurement patterns and identify seasonal cost variations.
⚡ Faster & Smarter Decision-Making
Visual insights help reduce delays and control procurement risks.
💼 Management-Ready Reports
Perfect for audits, budgeting, and leadership reviews.
What’s Inside the Clinic Procurement Dashboard in Power BI 📁
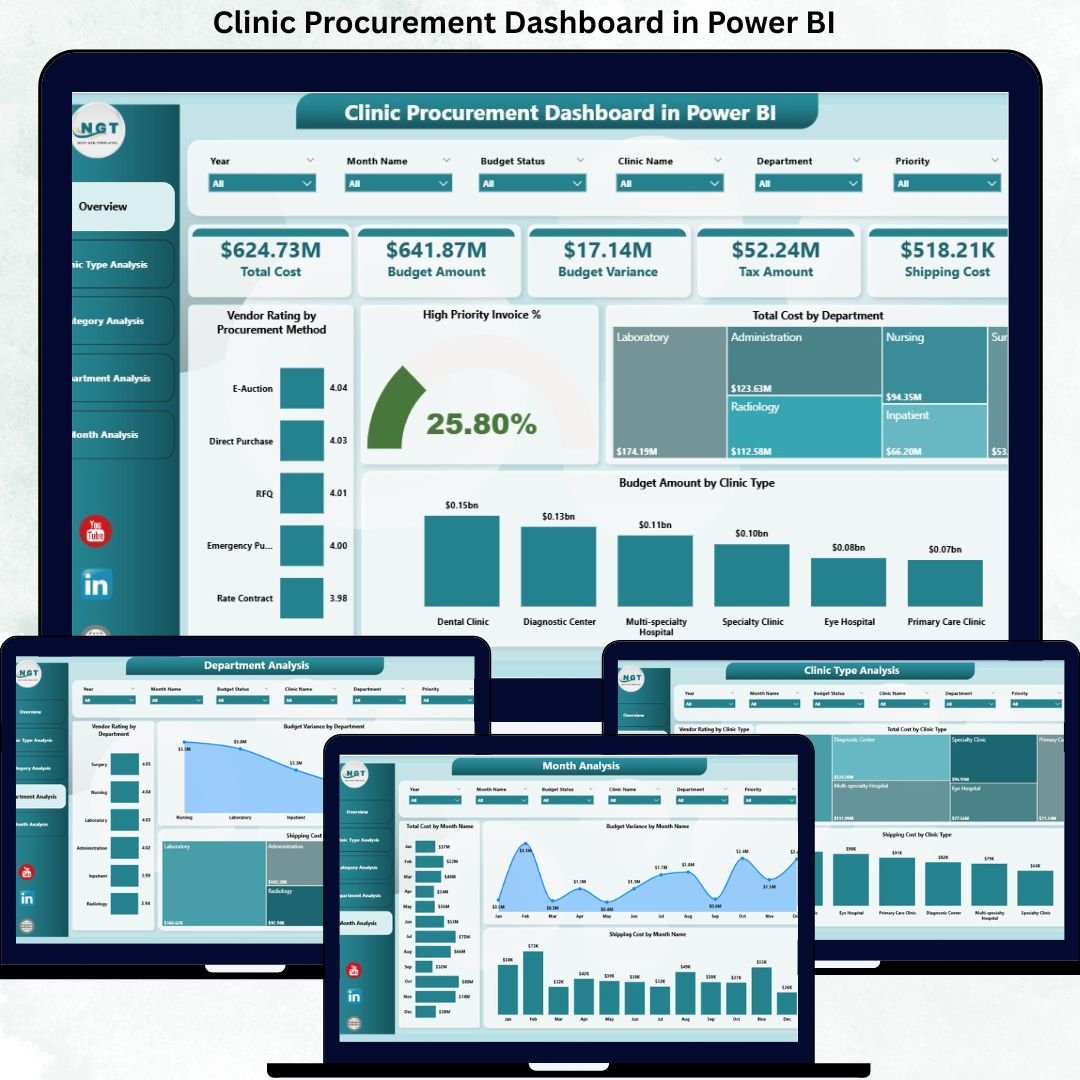
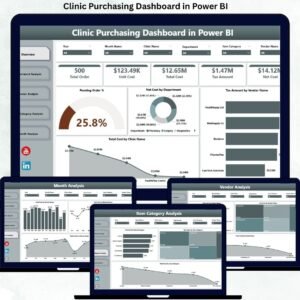
This ready-to-use dashboard includes five powerful analytical pages, designed to give complete procurement visibility.
📄 Overview Page
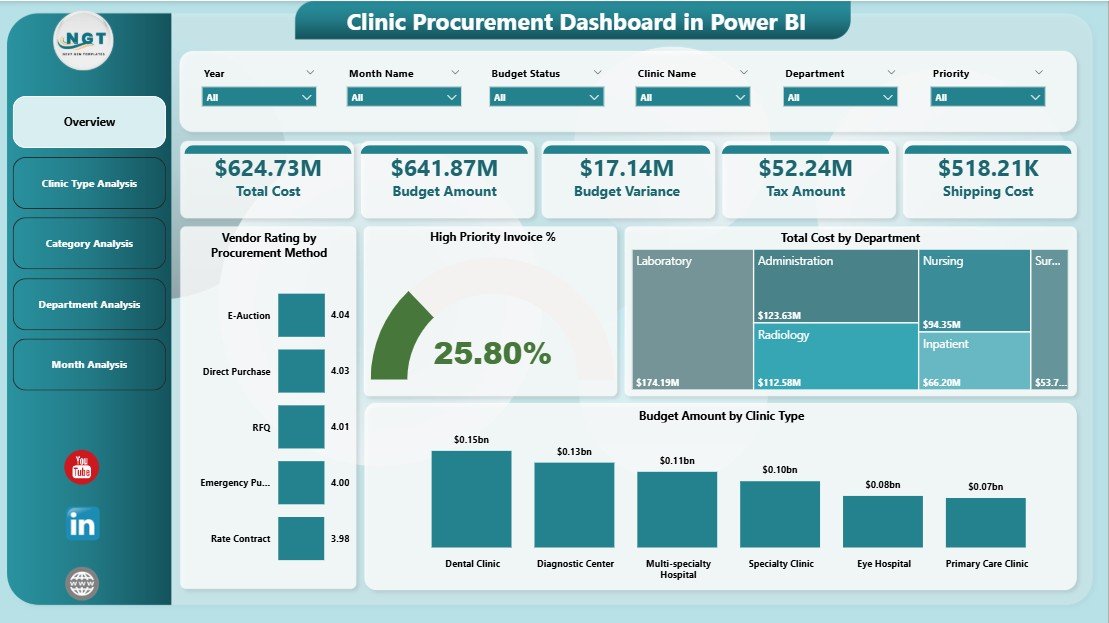
The central control panel of the dashboard that provides a quick summary of procurement performance.
Includes:
Total Procurement Value
High Priority Invoice %
Total Cost
Budget Overview
Vendor Rating by Procurement Method
Cost by Department
Budget by Clinic Type
✅ Helps management understand overall procurement health instantly.
📄 Clinic Type Analysis Page
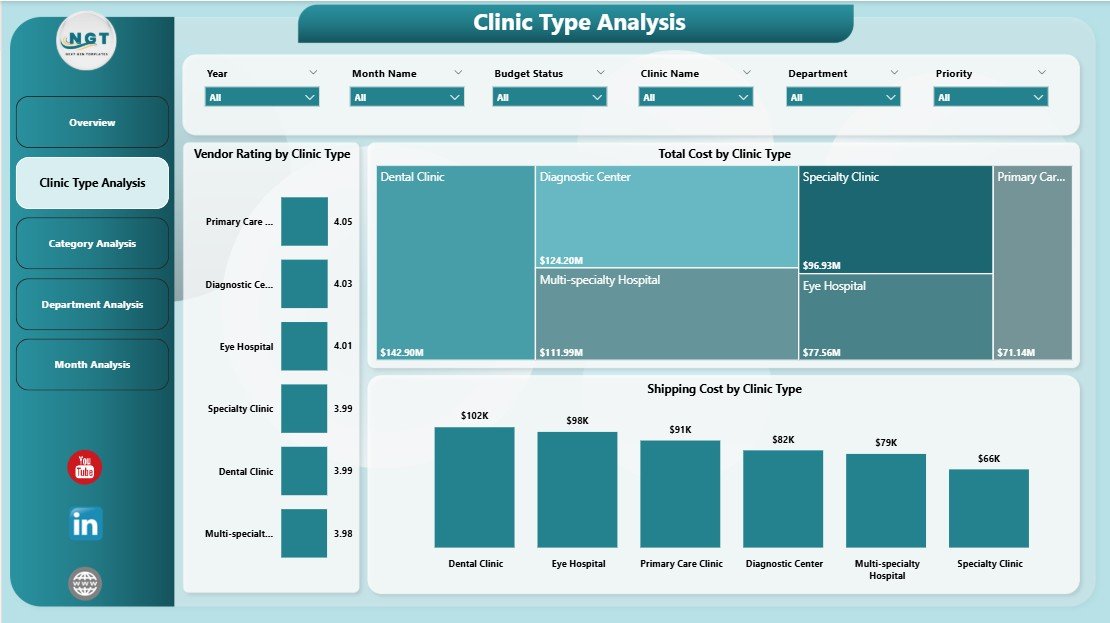
Analyzes procurement performance across different clinic types.
Key Insights:
Vendor Rating by Clinic Type
Total Cost by Clinic Type
Shipping Cost by Clinic Type
✅ Helps identify cost-heavy clinic types and optimize procurement strategy.
📄 Category Analysis Page
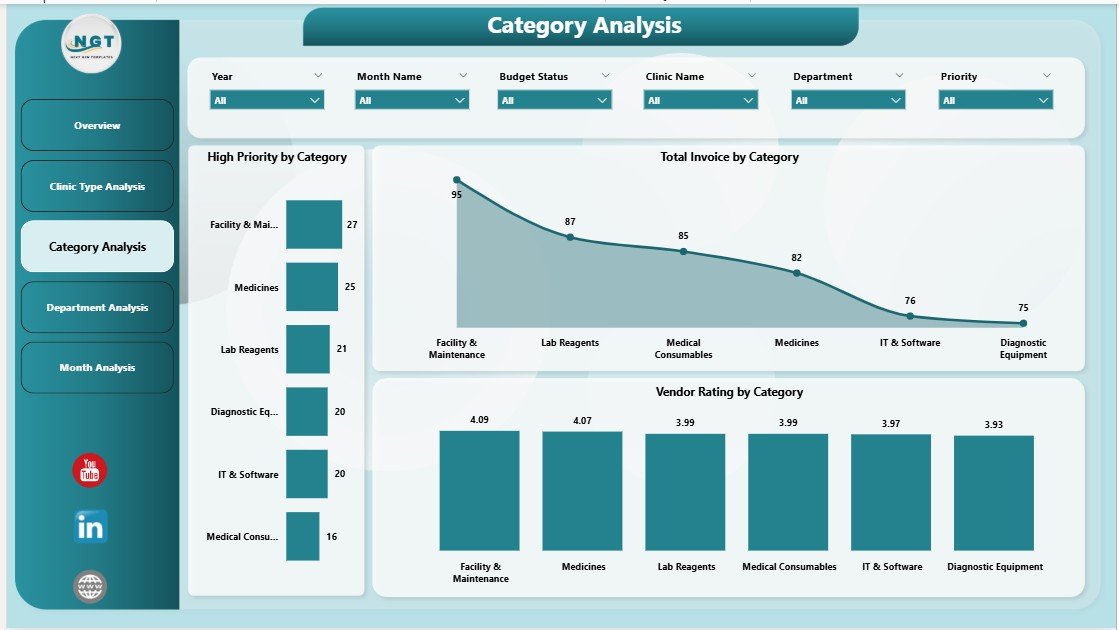
Provides deep insight into procurement categories such as medicines, equipment, and consumables.
Includes:
Vendor Rating by Category
Total Invoice Value by Category
High Priority Purchases by Category
✅ Helps control category-level costs and improve inventory planning.
📄 Department Analysis Page
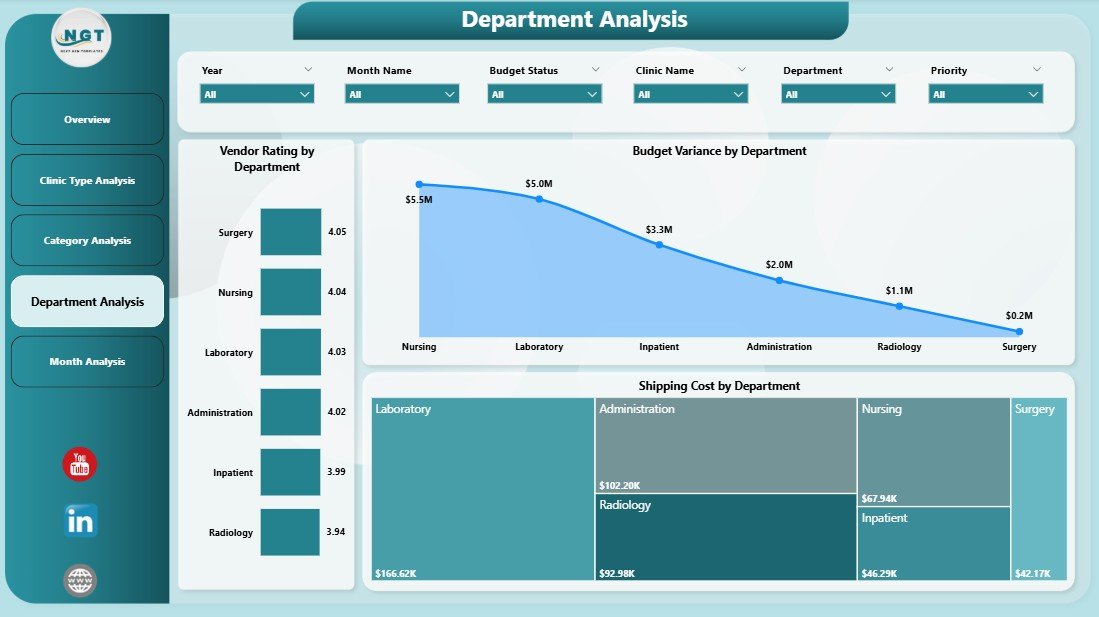
Tracks department-wise procurement behavior and cost efficiency.
Includes:
Vendor Rating by Department
Budget Variance by Department
Shipping Cost by Department
✅ Improves accountability and budget control across departments.
📄 Monthly Trends Page
Shows how procurement performance changes over time.
Includes:
Total Cost by Month
Budget Variance by Month
Shipping Cost by Month
✅ Helps forecast future expenses and identify cost spikes early.
📄 Data & Support Sheets
Store raw procurement data
Power calculations and charts
Enable easy data refresh
Maintain dashboard accuracy
How to Use the Clinic Procurement Dashboard in Power BI 🛠️
1️⃣ Update procurement data in Excel
2️⃣ Refresh the Power BI dashboard
3️⃣ Apply filters for clinic, category, or month
4️⃣ Review KPIs and charts
5️⃣ Use insights for decision-making
No advanced technical knowledge required — the dashboard works automatically.
Who Can Benefit from This Clinic Procurement Dashboard 👥
🏥 Clinic Administrators – Monitor procurement performance
📦 Procurement Managers – Track vendors and costs
💰 Finance Teams – Control budgets and expenses
📊 Operations Managers – Improve efficiency
👔 Healthcare Management – Make data-driven decisions
Perfect for small clinics, large hospitals, and multi-location healthcare centers.














Reviews
There are no reviews yet.