

The shipbuilding industry operates at some of the highest levels of complexity in the world. Every vessel—whether a cargo ship, naval vessel, tanker, cruise ship, or offshore structure—involves thousands of activities, multiple shipyards, engineering teams, safety departments, procurement units, and financial checkpoints. As operations grow, the data becomes scattered across emails, spreadsheets, and manual reports. This leads to delayed decisions, rising costs, miscommunication, and lack of clarity.
The Shipbuilding Dashboard in Excel solves this problem by bringing every important KPI—risk rating, delays, planned cost, actual cost, project count, segment performance, and monthly trends—into one clean, interactive, and ready-to-use dashboard. It helps project managers, shipyard heads, engineering teams, planning teams, and senior management monitor end-to-end performance without navigating multiple files.
📌 What Is a Shipbuilding Dashboard in Excel?
A Shipbuilding Dashboard in Excel is a structured reporting tool that tracks shipbuilding performance across:
-
Shipyards
-
Vessel types
-
Segments
-
Regions
-
Monthly KPIs
Using simple Excel formulas, slicers, PivotTables, and navigation buttons, it gives a clear view of:
-
Planned vs actual cost
-
Actual hours vs planned hours
-
Delayed project percentage
-
Risk rating analysis
-
Vessel performance
-
Shipyard output
-
Monthly production and cost trends
Since all visuals update based on slicers, the dashboard delivers insights instantly—without complex tools or learning curves.
🎯 Why Shipbuilding Companies Need This Dashboard
Shipbuilding involves engineering, procurement, planning, labor management, material management, financial tracking, and risk monitoring. Without a central tool:
-
Data becomes scattered
-
Cost overruns go unnoticed
-
Delays increase
-
Teams work with outdated information
-
Leadership lacks clarity
This dashboard centralizes information so every team aligns on performance.
Teams use it to:
-
Track shipyard performance
-
Control rising project costs
-
Identify delays early
-
Compare planned vs actual metrics
-
Monitor region-wise and vessel-wise KPIs
-
Improve accountability
-
Manage resources effectively
Because it runs in Excel, every team member can use it immediately.
📊 Key Features of the Shipbuilding Dashboard
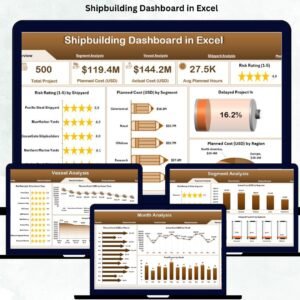
The dashboard includes five analytical pages and a support sheet, all designed with a left-side navigation menu for easy movement.
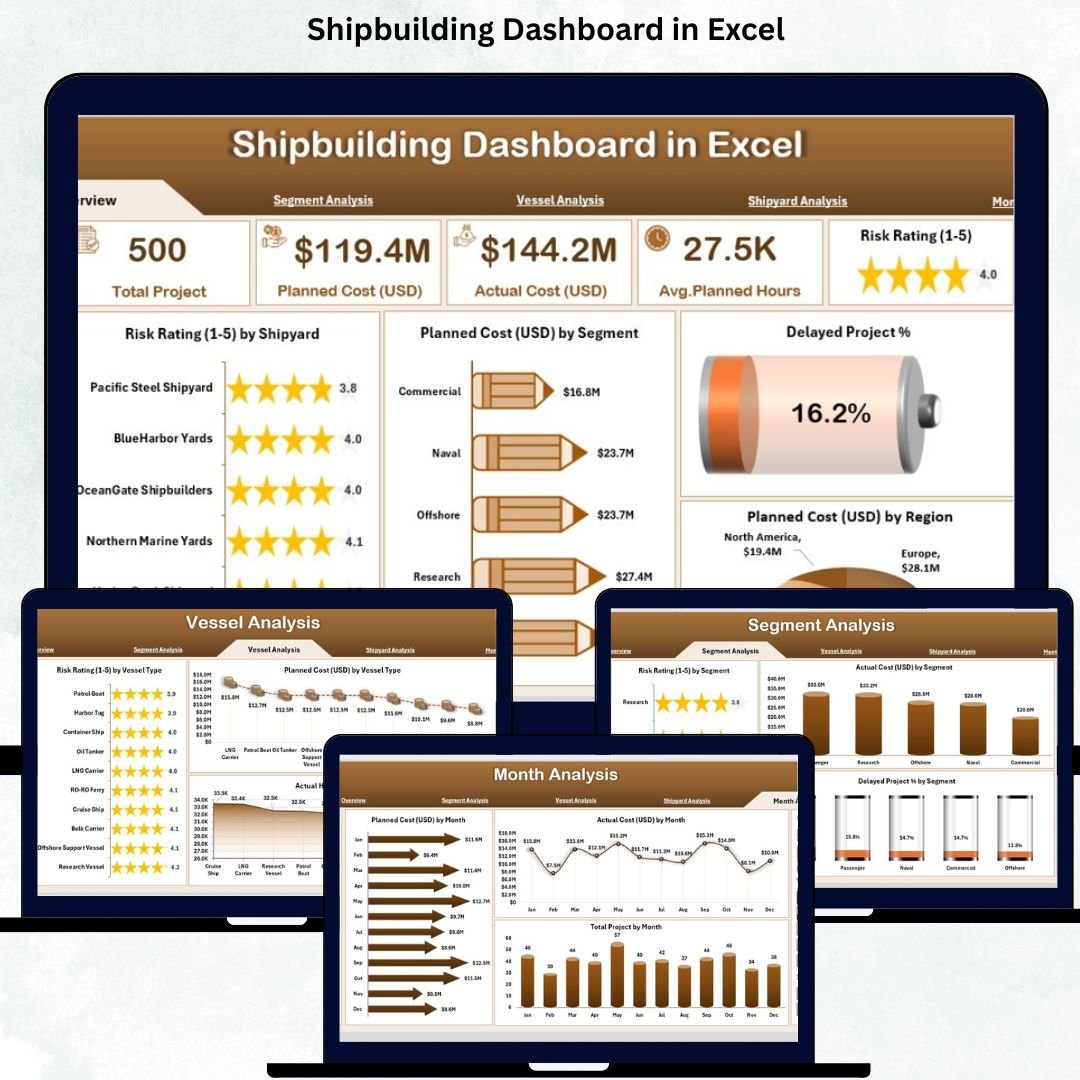
🟦 1. Overview Page – High-Level Shipbuilding Summary
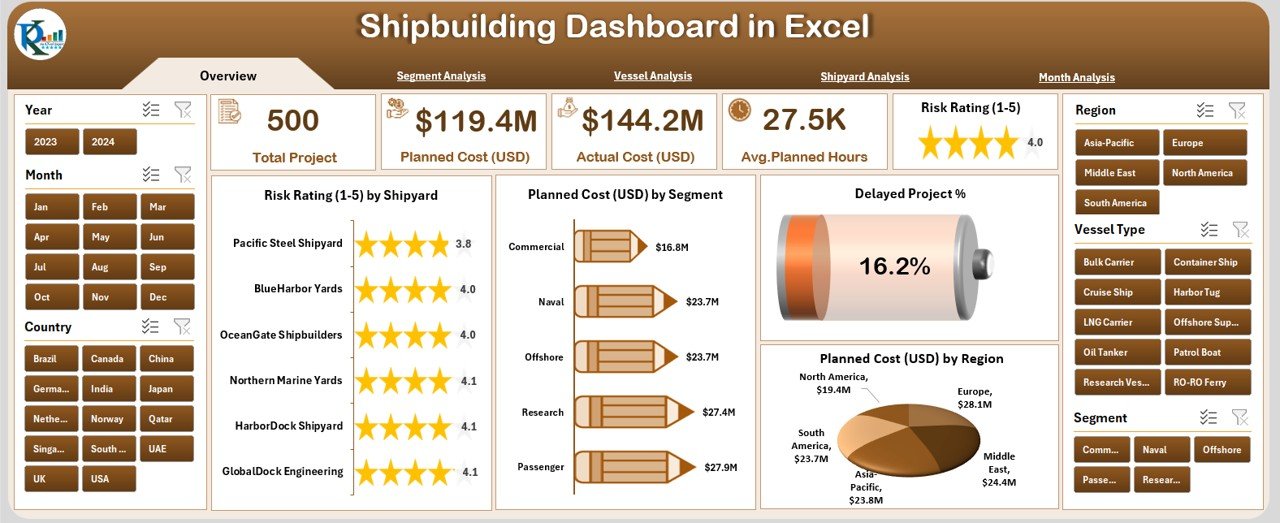
The Overview Page provides instant visibility into company-wide KPIs.
⭐ Right-Side Slicer Panel
Users can filter by:
-
Year
-
Segment
-
Shipyard
-
Vessel Type
-
Region
⭐ KPI Cards
Five essential cards display:
-
Total Projects
-
Total Planned Cost
-
Total Actual Cost
-
Delayed Project %
-
Total Actual Hours
These help leaders assess overall performance instantly.
⭐ Overview Page Charts
-
Risk Rating by Shipyard
-
Planned Cost (USD) by Segment
-
Delayed Project %
-
Planned Cost (USD) by Region
These visuals highlight risks, high-cost segments, delay percentages, and region-based performance gaps.
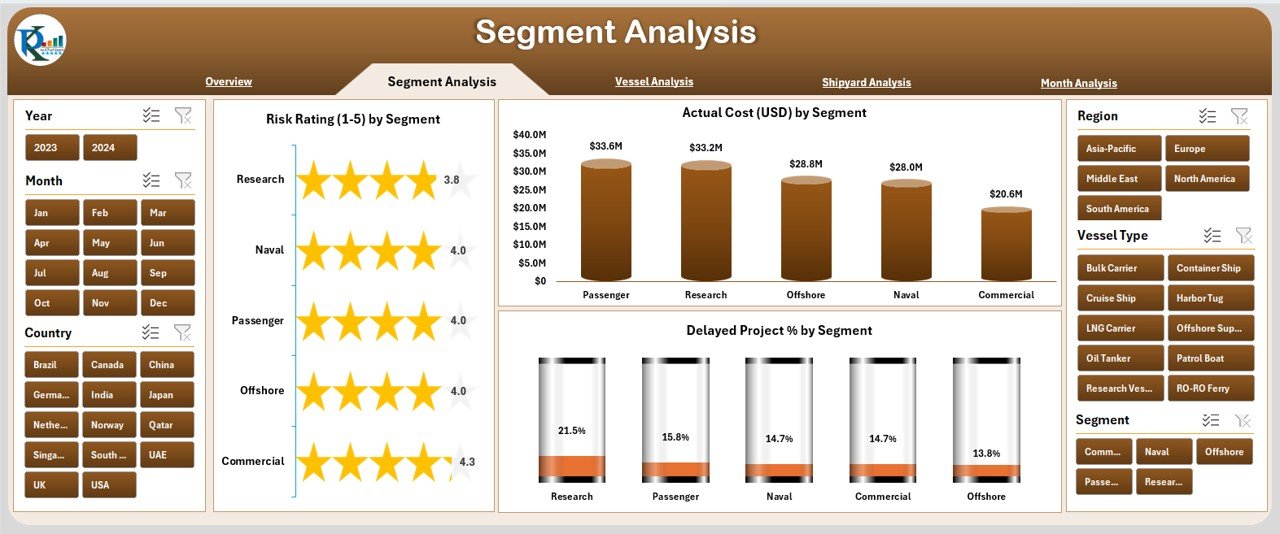
🟧 2. Segment Analysis Page – Understand Segment-Wise Performance
Shipbuilding companies work across multiple segments such as:
-
Commercial vessels
-
Naval vessels
-
Offshore structures
-
Special-purpose vessels
This page shows segment-specific performance through:
⭐ Slicers for Year, Segment & Region
⭐ Charts:
-
Risk Rating by Segment
-
Delayed Project % by Segment
-
Actual Cost (USD) by Segment
This allows managers to identify high-risk segments, cost-heavy segments, and segments causing repeated delays.
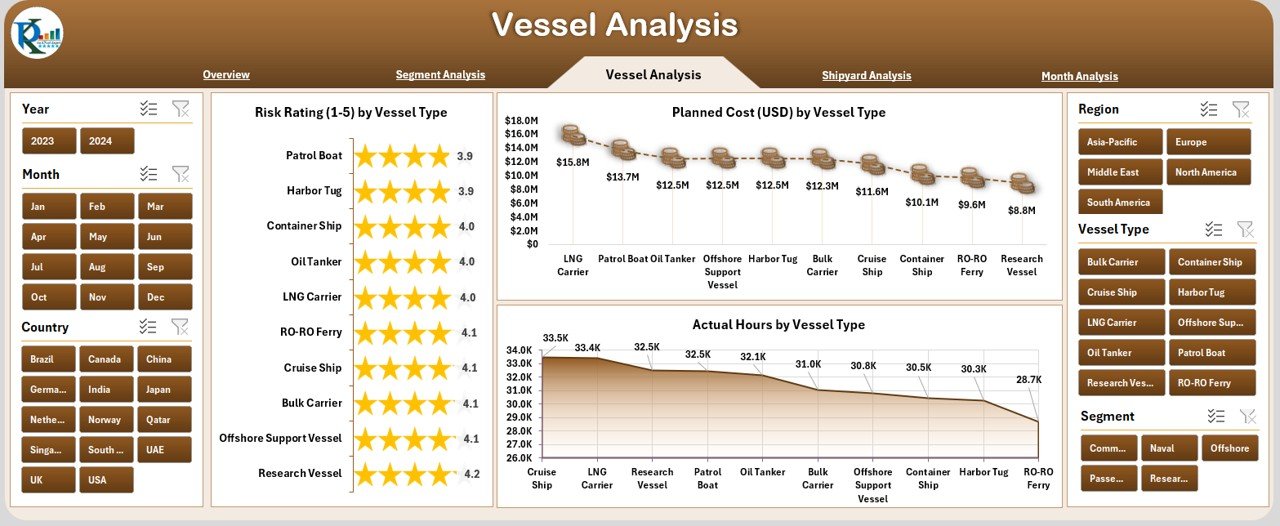
🟩 3. Vessel Analysis Page – Track Vessel-Type Behavior
Each vessel category has different complexity, cost, labor effort, and risks.
This page includes:
⭐ Right-Side Filters
⭐ Charts:
-
Risk Rating by Vessel Type
-
Planned Cost (USD) by Vessel Type
-
Actual Hours by Vessel Type
These insights help optimize planning, labor allocation, and project timelines.
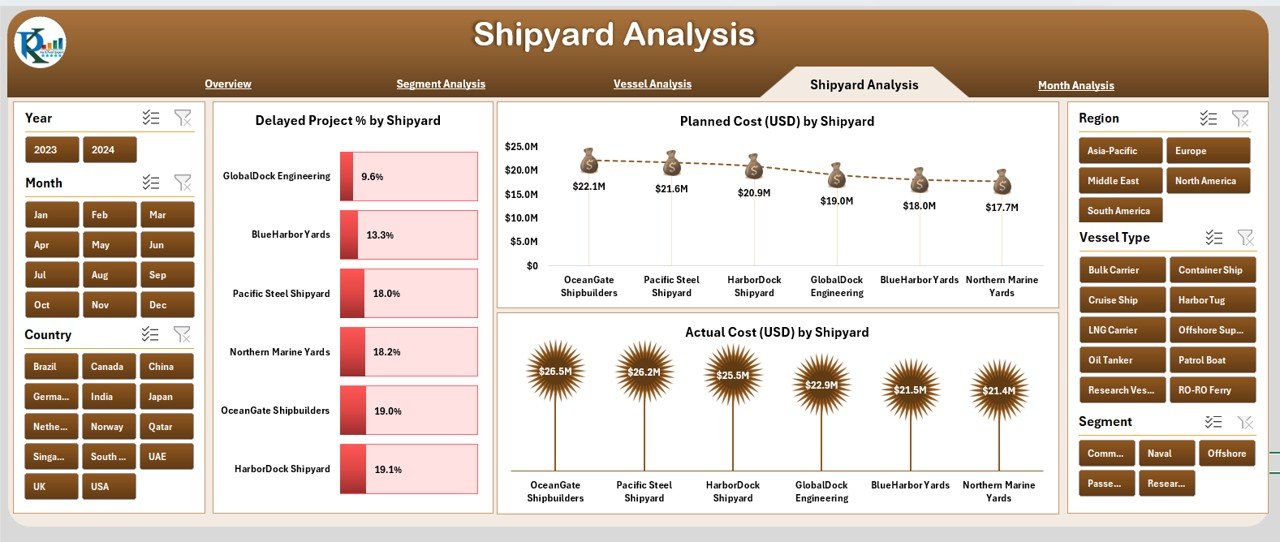
🟪 4. Shipyard Analysis Page – Compare Performance Across Shipyards
Performance varies across shipyards due to:
-
Workforce skill levels
-
Location
-
Material availability
-
Machinery capacity
-
Supplier networks
This page shows:
⭐ Charts:
-
Delayed Project % by Shipyard
-
Planned Cost (USD) by Shipyard
-
Actual Hours by Shipyard
With these visuals, leadership identifies underperforming shipyards and takes corrective action.
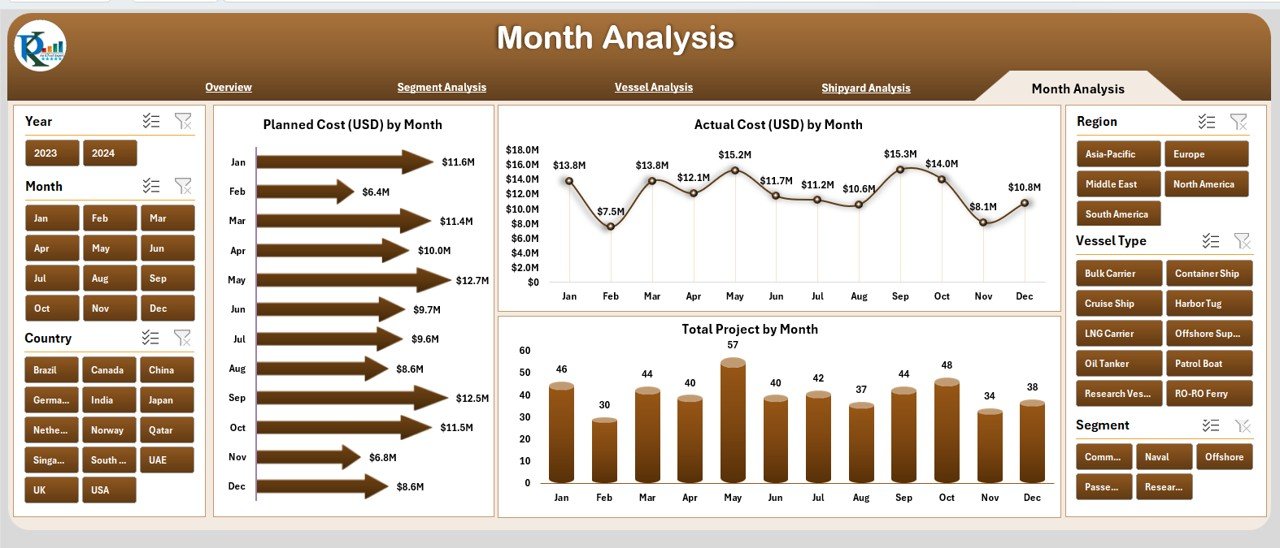
🟫 5. Monthly Analysis Page – Track Monthly Patterns & Trends
Shipbuilding projects run for several months or years. This page helps track long-term patterns.
⭐ Charts:
-
Planned Cost (USD) by Month
-
Actual Cost (USD) by Month
-
Total Projects by Month
Teams understand seasonal patterns, workload peaks, downtime periods, and cost fluctuations.
🛠 Support Sheets
✔ Data Sheet
Stores raw data: cost, hours, segment, vessel type, shipyard, region, delays, risk levels.
✔ Support Sheet
Stores dropdown lists, mappings, categories, and backend data references.
🌟 Advantages of the Shipbuilding Dashboard in Excel
⭐ 1. Real-Time Monitoring
Charts and KPIs update instantly based on slicers.
⭐ 2. Reduce Project Delays
The dashboard highlights high-risk areas early.
⭐ 3. Control Cost Overruns
Clear comparison of planned vs actual spending.
⭐ 4. Enhance Workforce Efficiency
Actual hours vs vessel type and shipyard show labor utilization.
⭐ 5. Improve Productivity
Simple structure makes analysis easy for everyone.
⭐ 6. Support Fast Decision-Making
Clean visuals highlight the exact areas requiring attention.
🧠 Best Practices for Using the Dashboard
-
Update data weekly
-
Maintain clean and consistent data
-
Use slicers for detailed comparisons
-
Track monthly trends regularly
-
Monitor risk ratings frequently
-
Review planned vs actual metrics
-
Keep backup copies of the file
🏁 Conclusion
The Shipbuilding Dashboard in Excel is a powerful, easy-to-use decision-making tool for shipbuilding companies. It simplifies complex engineering data, improves cost control, increases transparency, and enhances operational performance. With pages for segment analysis, vessel analysis, shipyard performance, and monthly tracking, this dashboard gives complete clarity on production health and project efficiency.
Visit our YouTube channel to learn step-by-step video tutorials















Reviews
There are no reviews yet.