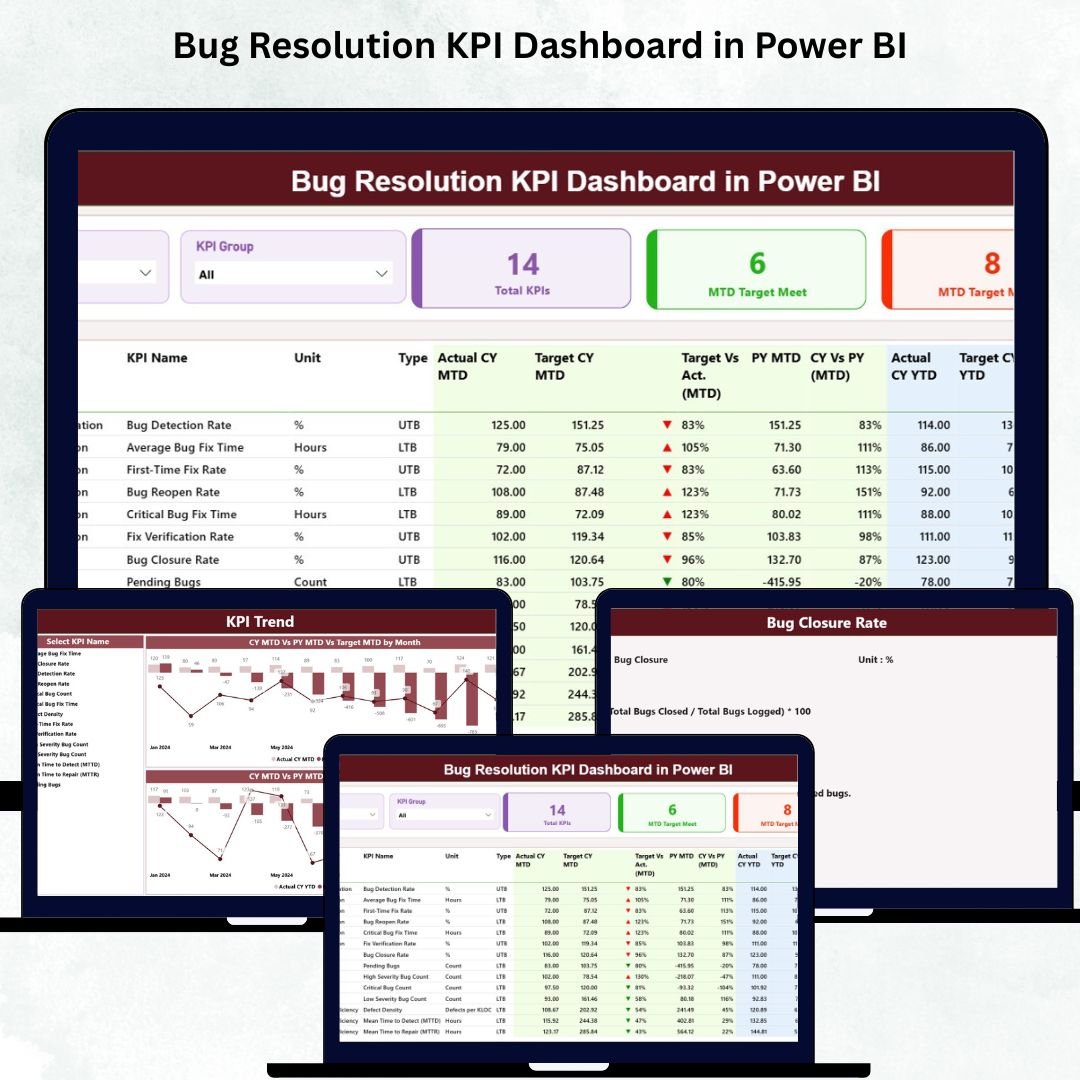
Fixing bugs quickly is essential for delivering stable, high-quality software. But as engineering teams grow and product complexity increases, tracking bug patterns becomes difficult. Manual spreadsheets, scattered reports, and unclear KPIs slow teams down. The Bug Resolution KPI Dashboard in Power BI solves this problem by providing a complete, visual, and real-time performance monitoring system. 🐞📊
This ready-to-use dashboard transforms your bug-tracking data into meaningful insights. Whether you’re a QA lead, engineering manager, product owner, or Scrum master, you can instantly see how efficiently your team resolves bugs, meets targets, and improves over time. Designed with KPI cards, slicers, dynamic tables, and combo charts, this dashboard gives you complete clarity without manual work.
🔑 Key Features of Bug Resolution KPI Dashboard in Power BI
This dashboard includes powerful features that help teams monitor bug resolution performance with speed and accuracy:
✔ Real-Time KPI Insights
Track essential metrics including:
-
Bug Detection Rate
-
Average Resolution Time
-
Reopened Bug Count
-
Severity-Level Performance
-
Target vs Actual (MTD & YTD)
These KPIs reveal gaps and improvement areas instantly.
✔ Detailed KPI Table
Understand performance thoroughly with a structured table including:
-
KPI Number
-
KPI Name & Group
-
Units
-
Actual vs Target (MTD & YTD)
-
Previous Year Comparison
-
Green/Red Arrows for KPI Status
This table works like a performance dashboard for the entire engineering team.
✔ Dynamic Slicers
Use slicers for:
-
Month
-
KPI Group
-
KPI Selection
Every chart refreshes instantly for accurate, filtered analysis.
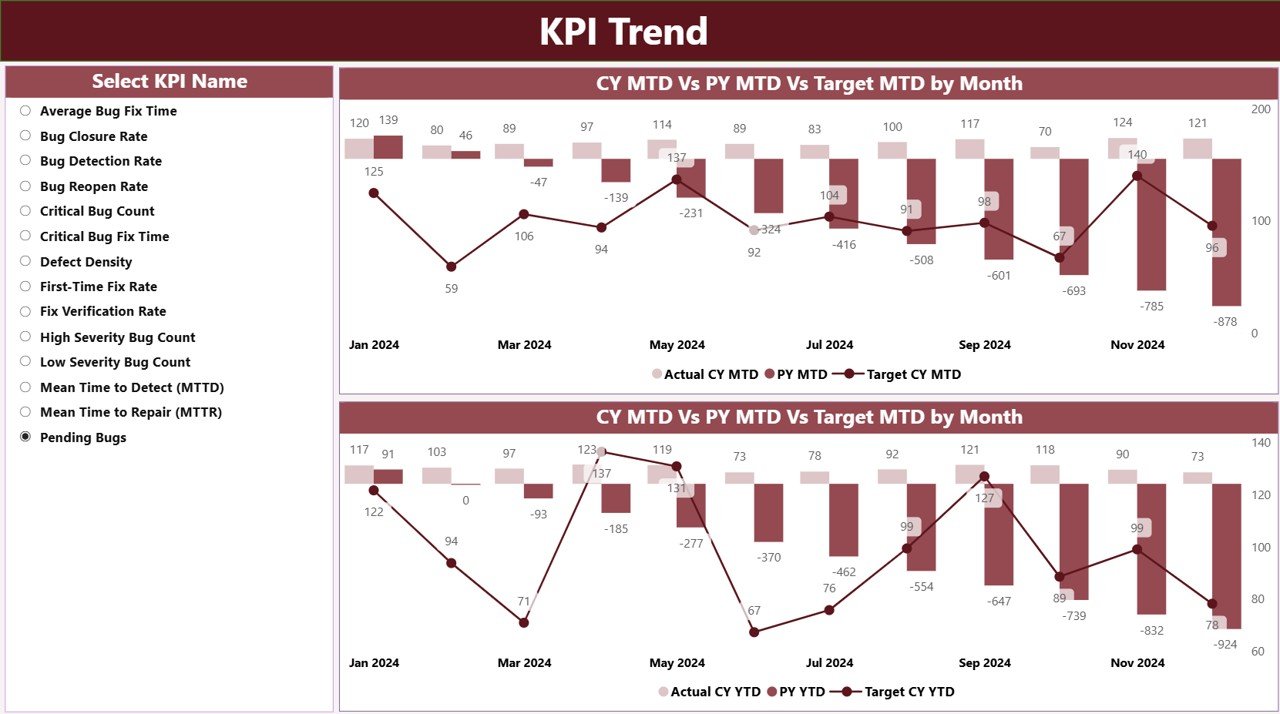
✔ MTD & YTD Trend Charts
Two combo charts (MTD & YTD) help teams analyze seasonal patterns, compare previous year results, and evaluate consistency month-by-month.
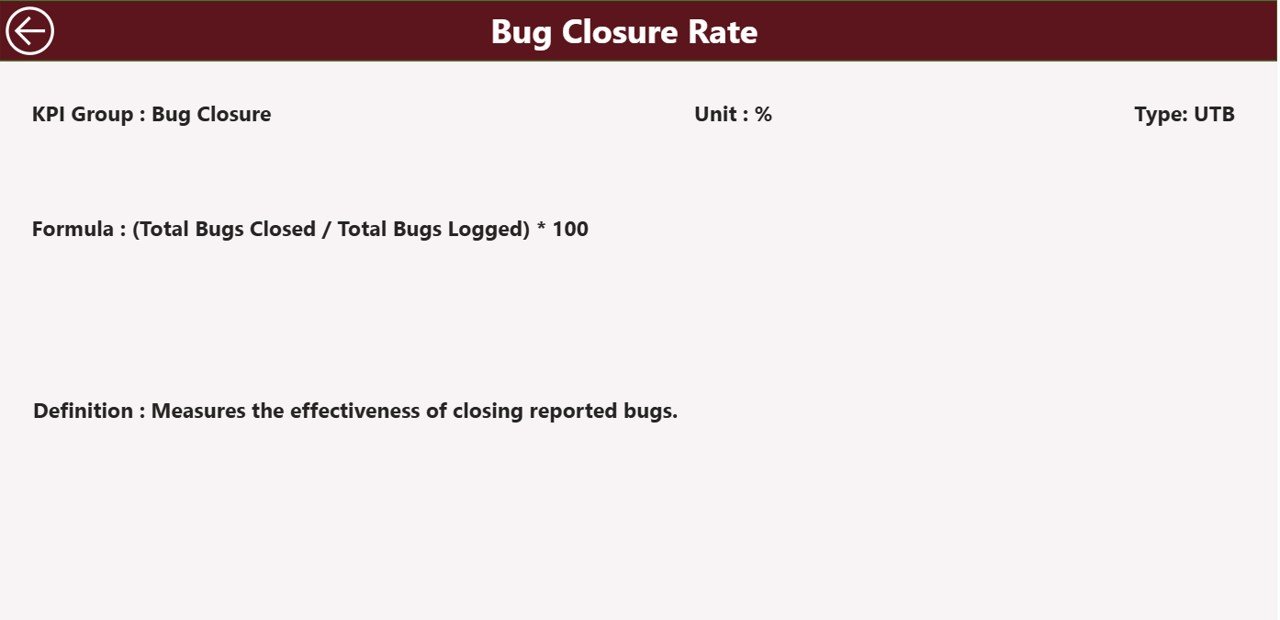
✔ Drill-Through KPI Definition Page
Right-click any KPI to view:
-
KPI Formula
-
Type (LTB/UTB)
-
KPI Description
-
Unit & Group
This ensures there is no confusion about KPI meaning or calculation.
📦 What’s Inside the Bug Resolution KPI Dashboard in Power BI
Your dashboard includes three powerful pages designed to give complete visibility:
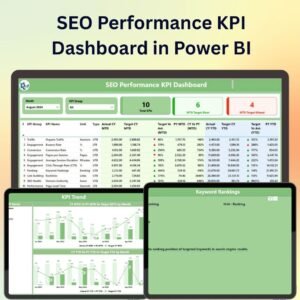
1️⃣ Summary Page – Complete KPI Snapshot
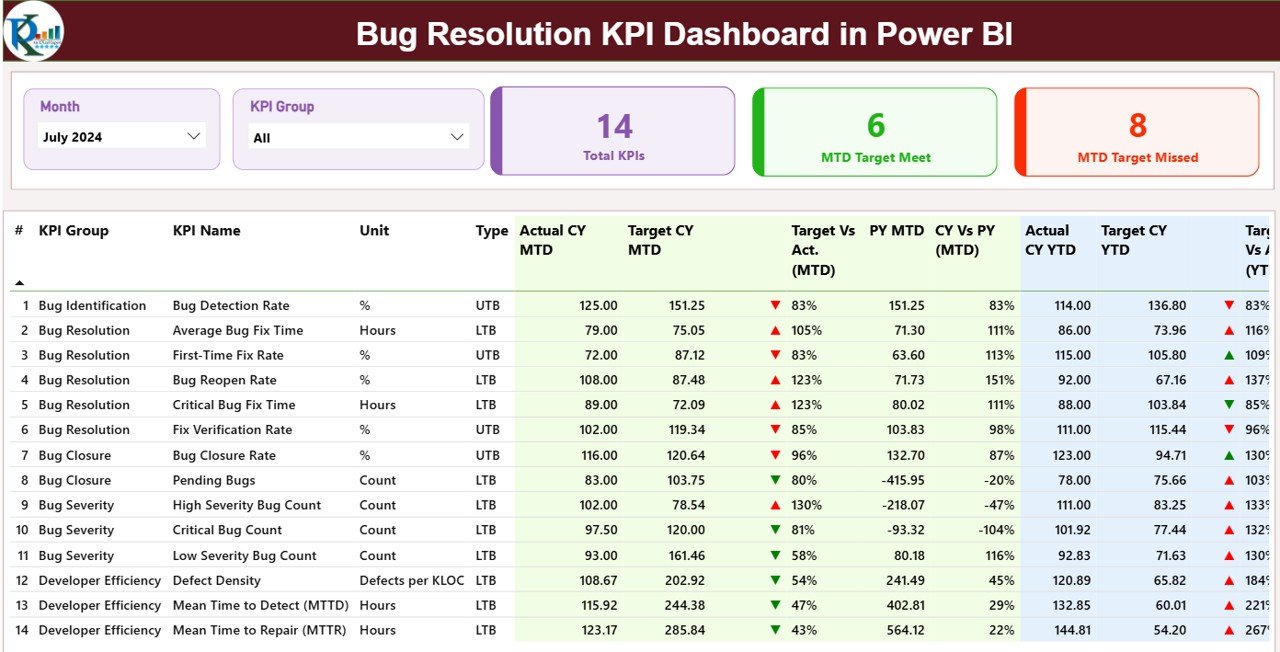
This page gives an instant overview of:
-
Total KPIs Count
-
MTD Target Met
-
MTD Target Missed
It also displays a detailed table showing performance at both the monthly and annual level. Green ▲ and red ▼ icons make it easy to assess progress.
2️⃣ KPI Trend Page – Month-by-Month Analysis
This page includes:
-
KPI Name Slicer
-
MTD Trend Chart
-
YTD Trend Chart
Great for sprint reviews, retrospectives, quarterly planning, and leadership reports.
3️⃣ KPI Definition Page – Understand KPI Logic
This drill-through page includes:
-
KPI Formula
-
Description
-
Unit
-
Type (UTB/LTB)
It ensures full transparency and easy onboarding for new team members.
🧠 How to Use the Bug Resolution KPI Dashboard in Power BI
Using the dashboard is simple:
1️⃣ Update Input_Actual with monthly values
2️⃣ Update Input_Target with MTD/YTD goals
3️⃣ Refresh Power BI
4️⃣ Review the Summary Page daily
5️⃣ Use the Trend Page for deeper analysis
6️⃣ Drill-through when you need detailed KPI definitions
No advanced Power BI skills required — just refresh and review. ⚡
👥 Who Can Benefit from This Dashboard?
This dashboard is perfect for:
-
🧪 QA Engineers
-
👨💻 Developers
-
🛠️ Engineering Managers
-
🚀 Agile Coaches
-
📈 Product Owners
-
📊 Project Managers
-
🧩 Tech Leads
-
📉 Quality Analysts
Any team working with bugs, sprints, or software releases will benefit from this dashboard.
### Click here to read the Detailed blog post
Visit our YouTube channel to learn step-by-step video tutorials
👉 Youtube.com/@PKAnExcelExpert


Reviews
There are no reviews yet.