Managing electricity distribution requires precision, visibility, and rapid response. The Electricity Distribution KPI Dashboard in Google Sheets is a smart, ready-to-use performance monitoring system designed for utility companies, distribution networks, energy departments, and operational teams.
Built with automated charts, MTD/YTD comparisons, and KPI-driven analytics, this dashboard transforms complex electricity distribution data into actionable insights that help improve reliability, reduce losses, and enhance customer service.
From power interruptions to energy loss percentage, every essential metric is visualized clearly — enabling faster decision-making and stronger operational control.
⚡ Key Features of Electricity Distribution KPI Dashboard in Google Sheets
This dashboard provides electricity distributors with complete visibility of supply quality, efficiency, and reliability. Each sheet is interconnected to offer seamless reporting and accurate performance summaries.
📊 What’s Inside the Electricity Distribution KPI Dashboard
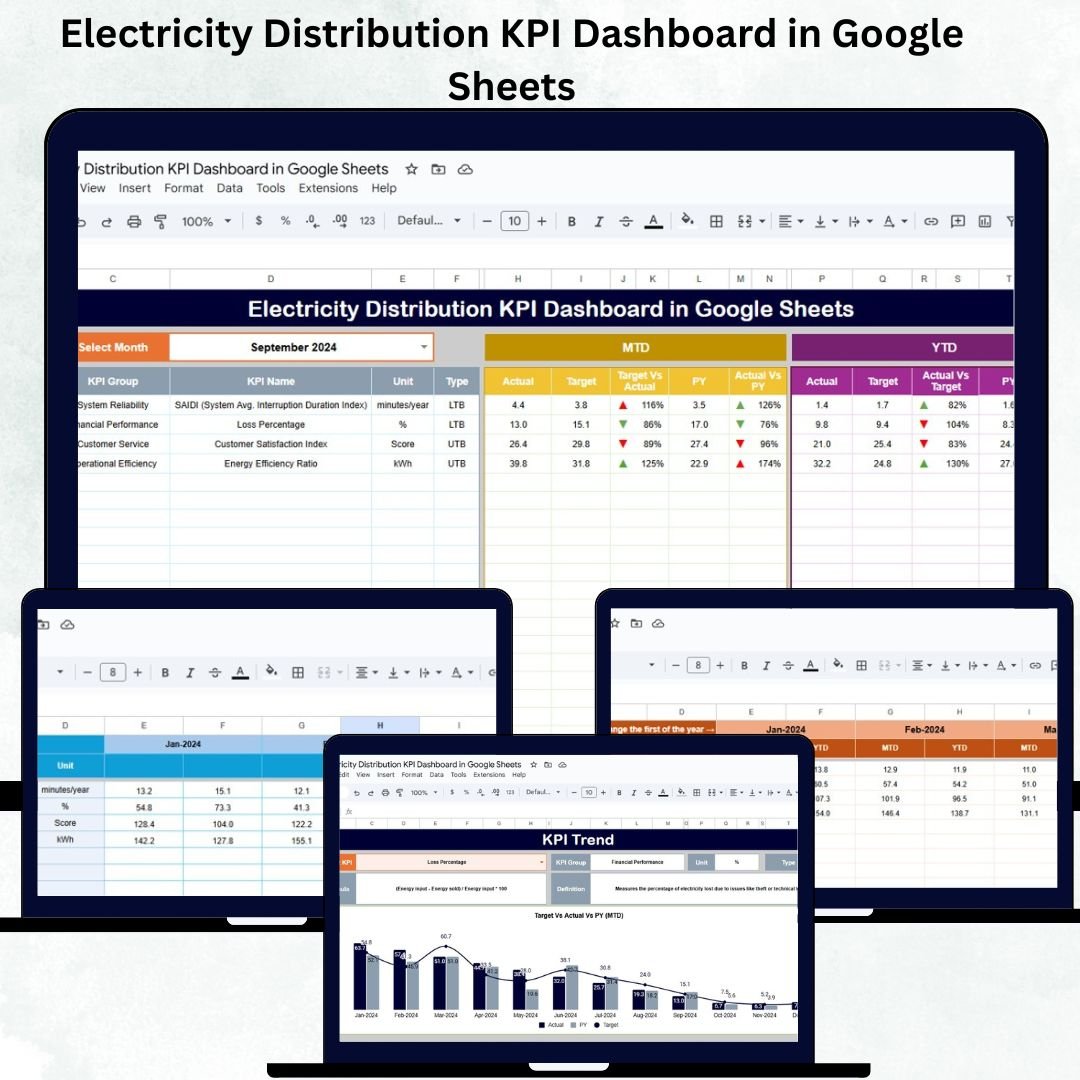
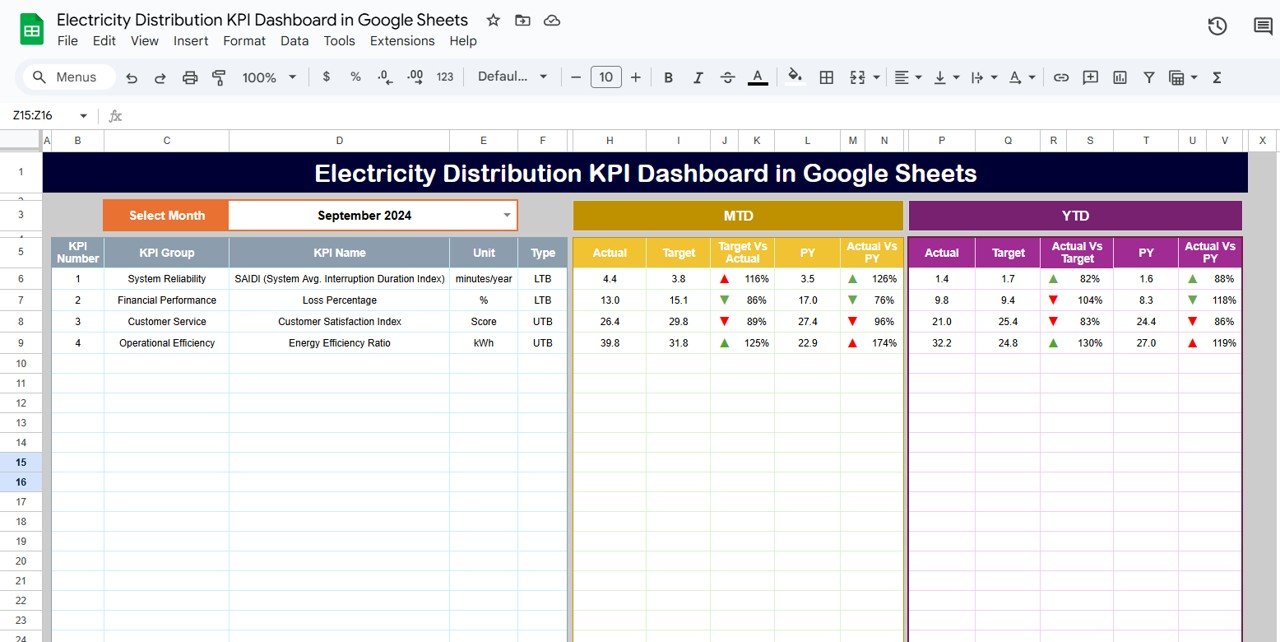
🟦 Dashboard Sheet Tab – Your Central Command Center
This is the main visualization page that displays all monthly KPIs in a single interactive screen.
Key Highlights:
✔ Month Selector (Cell D3) – choose any month and instantly refresh the dashboard
✔ MTD Actual vs Target vs Previous Year
✔ YTD Actual vs Target vs Previous Year
✔ Conditional formatting with Green (↑) and Red (↓) arrows
✔ Clean layout showing performance status clearly
KPIs automatically update based on the values entered in the Actual, Target, and Previous Year sheets.
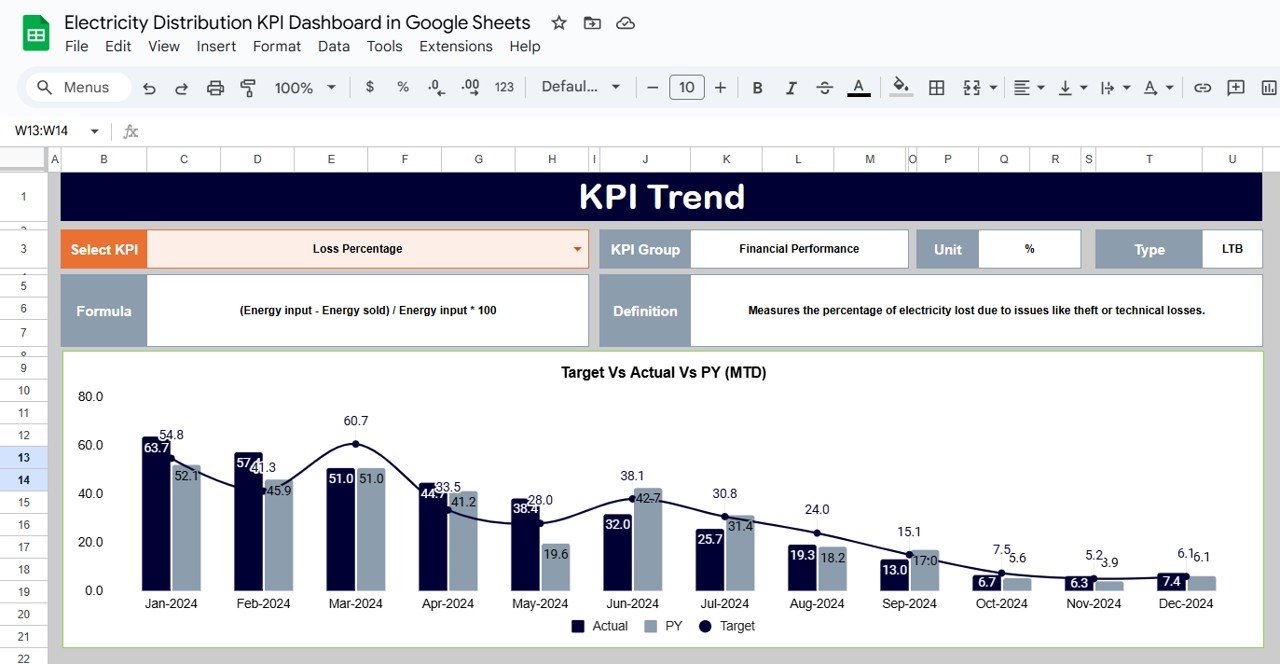
📈 KPI Trend Sheet Tab – Deep KPI-Level Analysis
Perfect for energy analysts and decision-makers who want to track long-term performance behavior.
Features on Trend Tab:
-
KPI Selection Dropdown (Cell C3)
-
Shows KPI Group, Unit, Formula, KPI Type (UTB/LTB), and Definition
-
Interactive trend chart using MTD/YTD values
-
Ideal for identifying monthly variations, spikes, or improvements
This sheet is essential for diagnosing performance issues and planning future improvements.
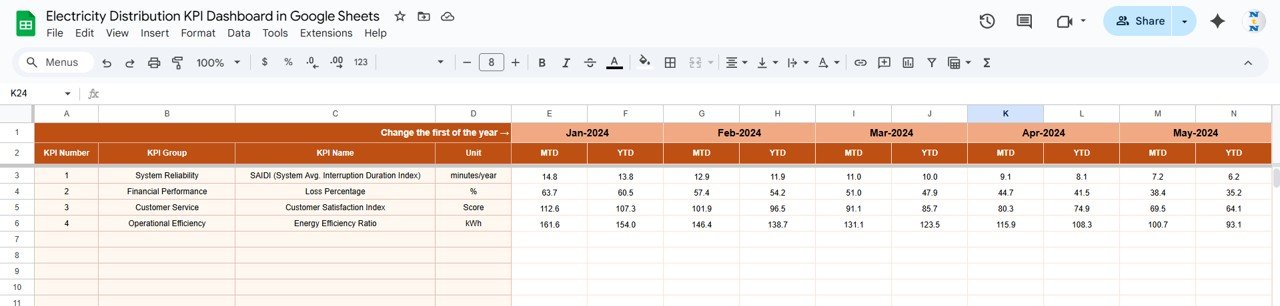
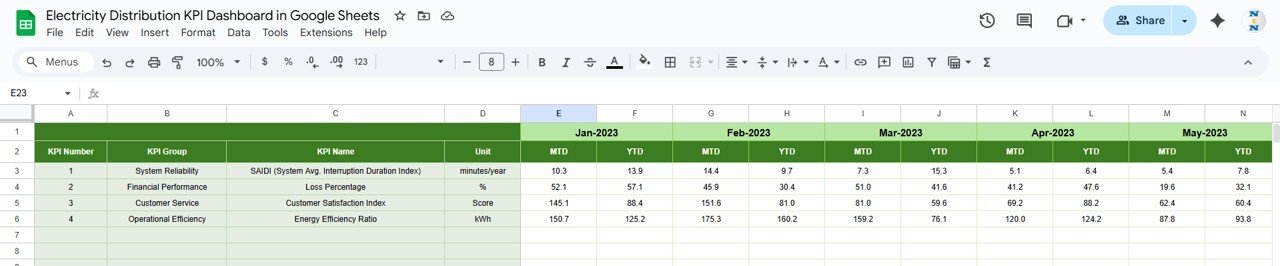
🔢 Actual Number Sheet Tab – Enter Monthly KPI Data
This tab stores all MTD and YTD actual numbers for each KPI.
How It Works:
✔ Choose year-start month on Cell E1
✔ Enter actual KPI data each month
✔ Dashboard updates automatically
This eliminates manual recalculation and ensures accuracy in reporting.
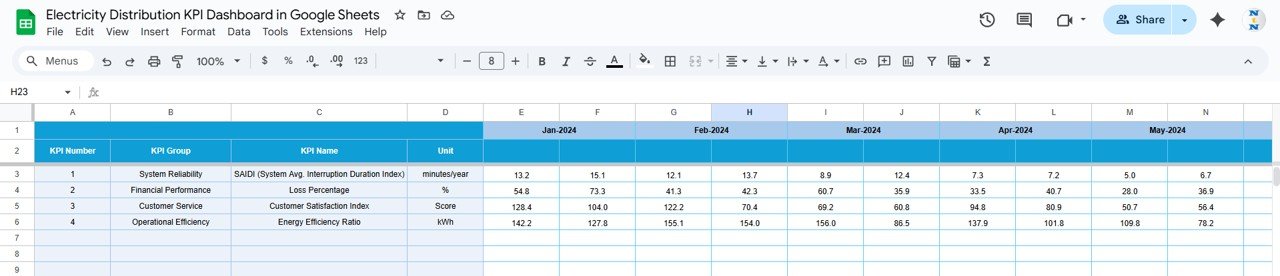
🎯 Target Sheet Tab – Define Monthly Expectations
Enter all target KPIs for the year, including:
-
MTD targets
-
YTD targets
Targets help teams compare actual performance against goals instantly.
📅 Previous Year Number Sheet Tab – YOY Benchmarking
This sheet stores historic performance data.
Entry of previous year values allows easy YOY comparison — vital for evaluating improvement or decline.
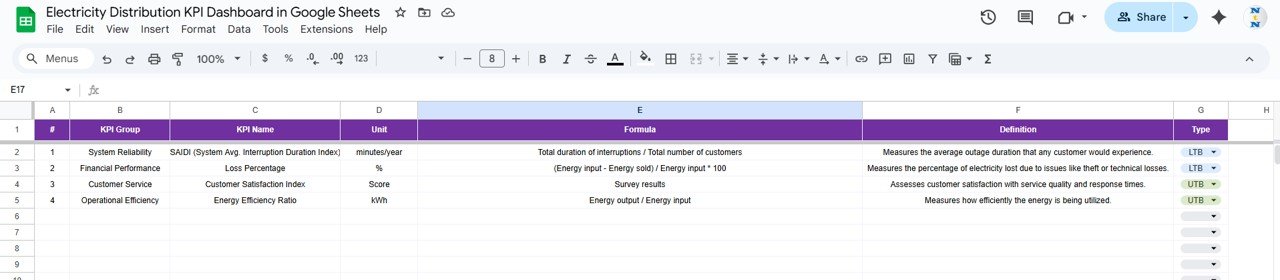
📘 KPI Definition Sheet Tab – Complete KPI Framework
This tab includes:
-
KPI Name
-
KPI Group
-
Unit
-
Formula
-
Definition
-
KPI Type (UTB – Upper The Better / LTB – Lower The Better)
A clear definition sheet helps teams maintain consistency in KPI measurement.
⚙️ How to Use the Electricity Distribution KPI Dashboard
1️⃣ Enter Actual monthly MTD/YTD values
2️⃣ Enter Target values in the target sheet
3️⃣ Enter Previous Year numbers for comparison
4️⃣ Select month from Dashboard (cell D3)
5️⃣ View auto-updating visuals instantly
6️⃣ Use trend analysis for deeper evaluation
No coding. No formulas. No setup. Simply plug in your data and analyze.
👥 Who Can Benefit From This Dashboard?
⚡ Utility Distribution Companies
⚡ Government Energy Departments
⚡ Power System Operations Teams
⚡ Electricity Board Engineers
⚡ Management & Regulation Authorities
⚡ Renewable Energy Monitoring Teams
⚡ Smart Grid & Distribution Automation Teams
Any organization managing electricity distribution will benefit immensely from this structured analytics system.
🌟 Advantages of the Electricity Distribution KPI Dashboard
✨ Real-time monitoring of distribution network performance
✨ Helps reduce energy losses and outage duration
✨ Improves customer satisfaction through faster response
✨ Identifies performance gaps instantly
✨ Supports regulatory compliance and audits
✨ Easy-to-use, cloud-ready, and shareable
✨ Enables YOY and MTD/YTD performance tracking
✨ Reduces manual reporting time dramatically
🚀 Opportunities for Improvement
You can expand this dashboard by adding:
💡 Google Form integration for outage reporting
💡 Predictive transformer failure model
💡 Region-wise dashboards for different service areas
💡 Heatmaps for peak-load analysis
💡 Automated alerts for KPI breaches
💡 Power factor monitoring summaries
🧠 Best Practices
✔ Update Actual values monthly
✔ Maintain consistent KPI definitions
✔ Compare YTD trends for long-term planning
✔ Track outage-related KPIs weekly
✔ Use department/region sheets for deeper insights
✔ Validate formulas in definition sheet regularly


Reviews
There are no reviews yet.