As the world transitions toward sustainability, organizations must measure their renewable material performance with accuracy and accountability. The Renewable Material KPI Dashboard in Google Sheets provides a powerful, data-driven solution to monitor renewable sourcing, waste reduction, energy usage, and cost efficiency — all in one automated and interactive file.
This ready-to-use Google Sheets dashboard enables sustainability teams, procurement managers, and environmental analysts to visualize progress, benchmark performance, and align with global sustainability goals. With automated MTD/YTD metrics and color-coded visualizations, it offers transparency, precision, and real-time decision support without complex tools or coding.
🔑 Key Features of the Renewable Material KPI Dashboard in Google Sheets
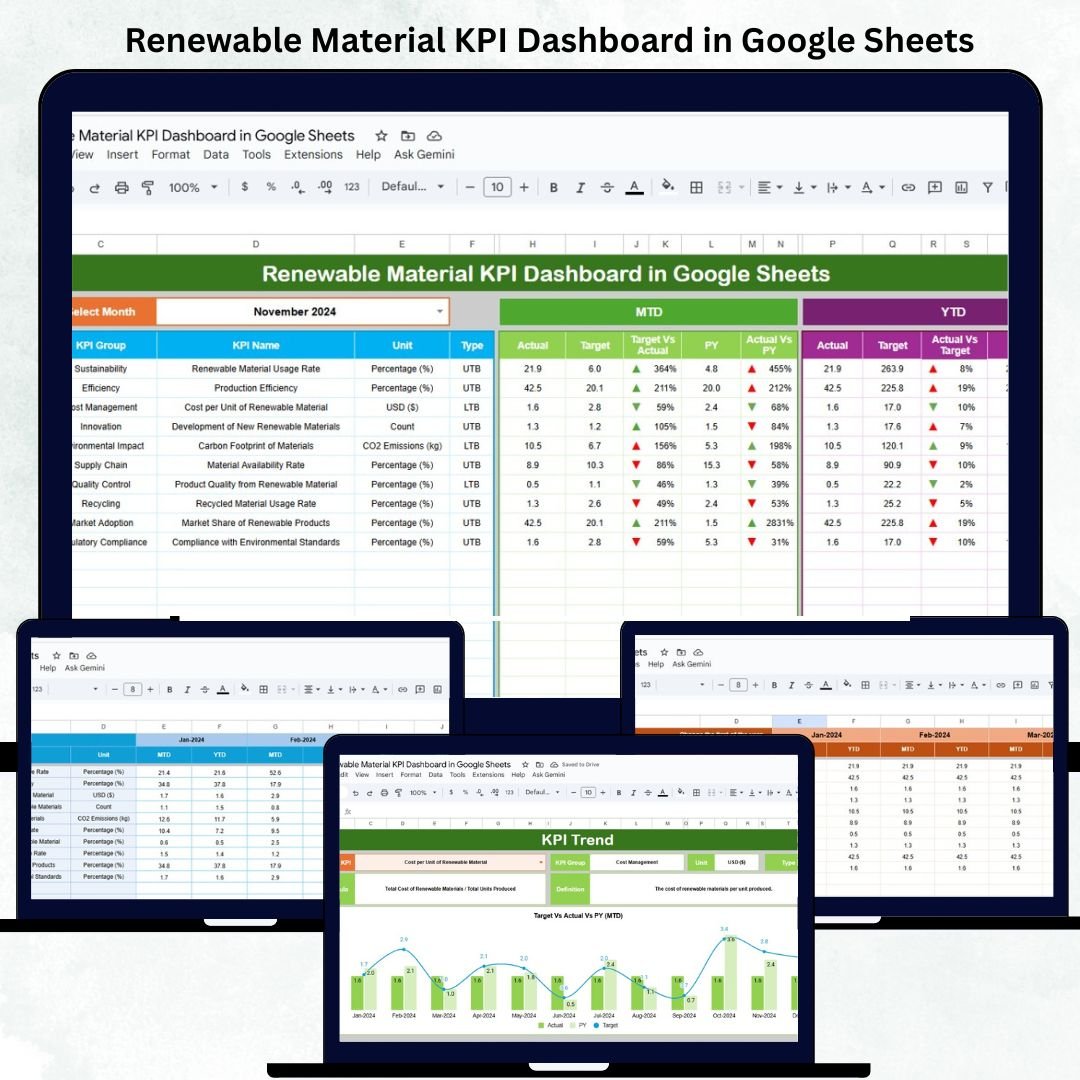
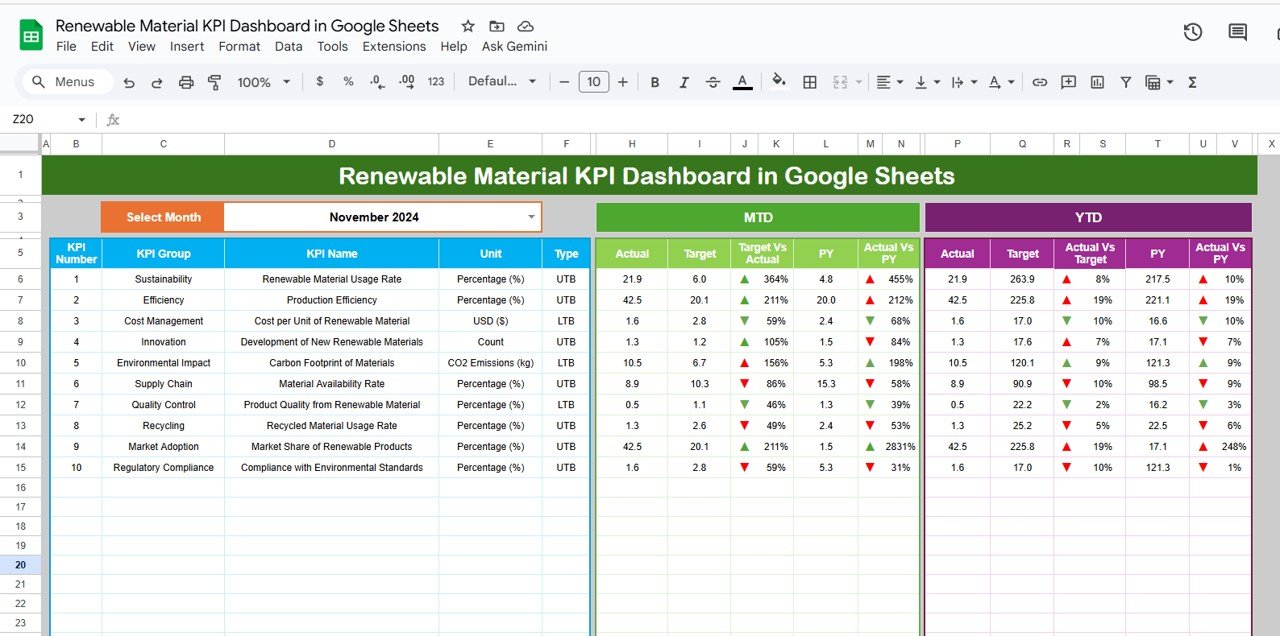
📊 Dashboard Sheet Tab (Main Visualization Page)
The central hub of the dashboard, combining visuals, KPI cards, and automated summaries for instant insights.
Features include:
-
📅 Month Selector (Cell D3): Switch between reporting periods effortlessly.
-
📈 MTD & YTD Comparisons: View Actual vs Target vs Previous Year at a glance.
-
🟢 Conditional Indicators: Up/down arrows and colors highlight performance shifts.
-
⚙️ Fully Automated Calculations: No formulas to edit manually.
KPI Cards Displayed:
-
Total Renewable Material Used (tons)
-
Renewable Material Percentage (%)
-
Recycled Content Ratio (%)
-
Material Waste (%)
-
Energy Usage per Unit (kWh/unit)
-
CO₂ Emissions (tons)
-
Procurement Cost per Ton ($)
-
Supplier Compliance (%)
-
Cost Savings through Renewable Sourcing ($)
-
Sustainability Rating (Index)
All indicators update automatically, helping users instantly interpret trends in renewable material adoption and environmental efficiency.
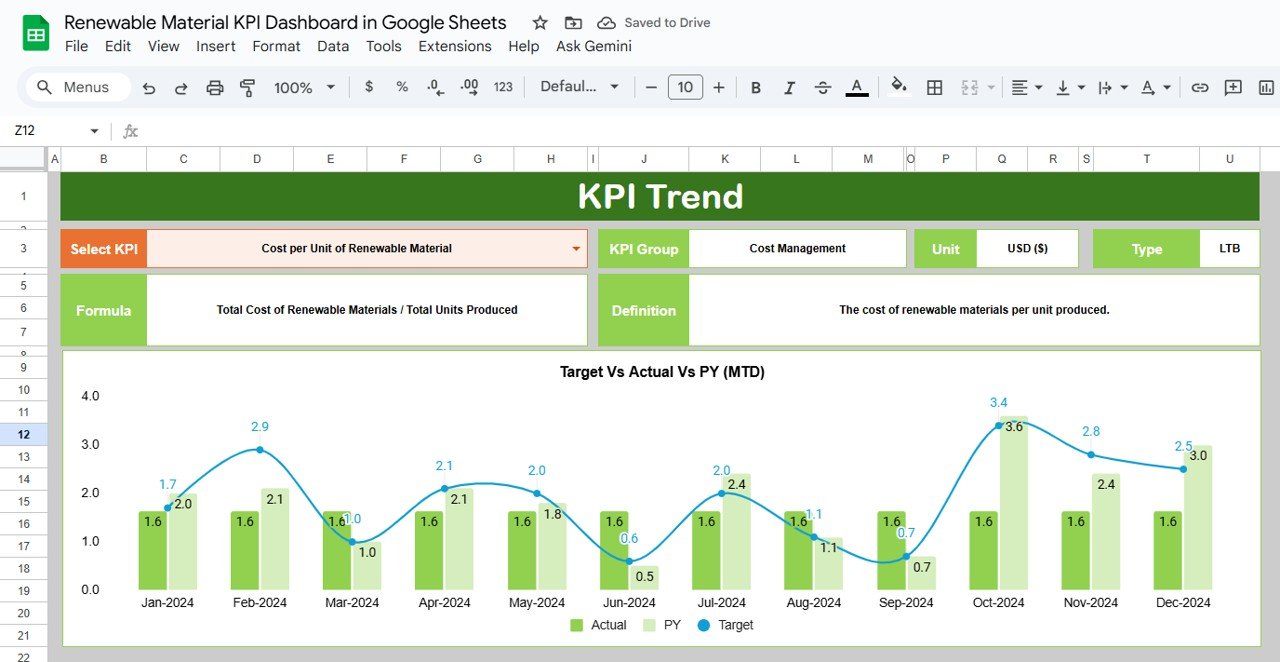
📉 KPI Trend Sheet Tab
Dive deeper into long-term KPI trends with interactive filters and graphs.
-
Dropdown in Range C3 to select any KPI.
-
Displays KPI Group, Unit, Type (UTB/LTB), Formula, and Definition.
-
Line and bar charts visualize month-wise MTD and YTD progression.
Perfect for tracking sustainability improvement trajectories or identifying areas requiring corrective action.
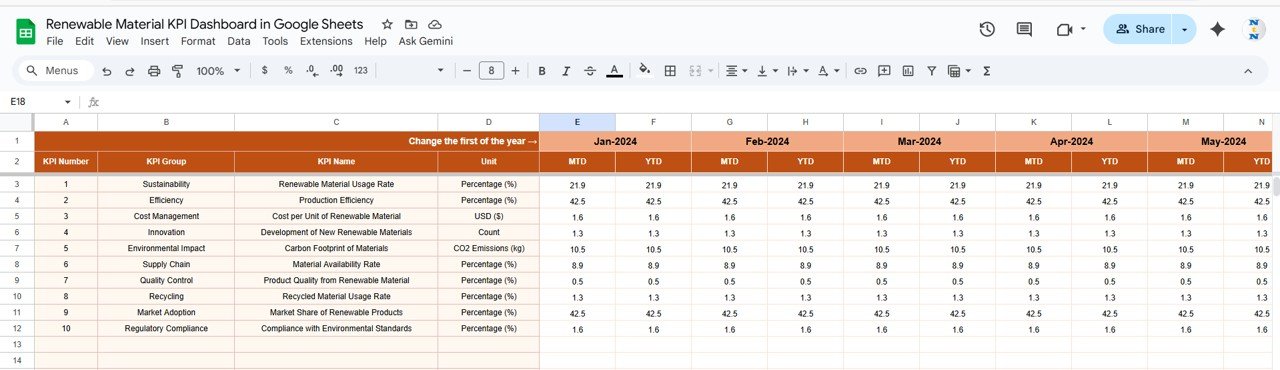
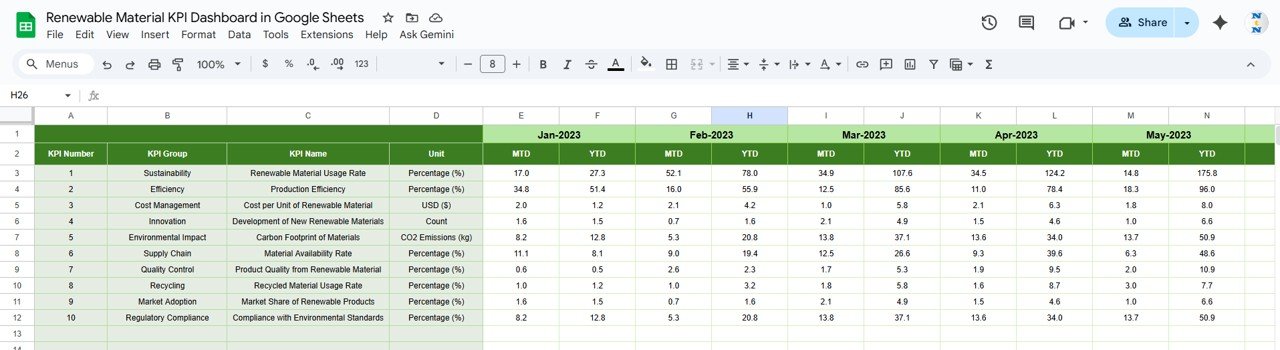
🧮 Actual Number Sheet Tab
The foundation of the dashboard — where users enter raw monthly performance data.
-
Columns for Month, MTD Actual, and YTD Actual.
-
Fiscal start month set in Range E1 to recalculate YTD automatically.
-
Drives every visualization on the dashboard.
🎯 Target Sheet Tab
Establish clear sustainability goals.
-
Define monthly and yearly targets for each KPI.
-
The dashboard calculates achievement % and displays red/green status automatically.
Use this sheet to track whether renewable material initiatives are meeting organizational expectations.
📆 Previous Year Number Sheet Tab
Benchmark your current sustainability progress against last year’s achievements.
-
Enables instant YoY comparisons.
-
Helps analyze seasonal performance patterns or long-term gains.
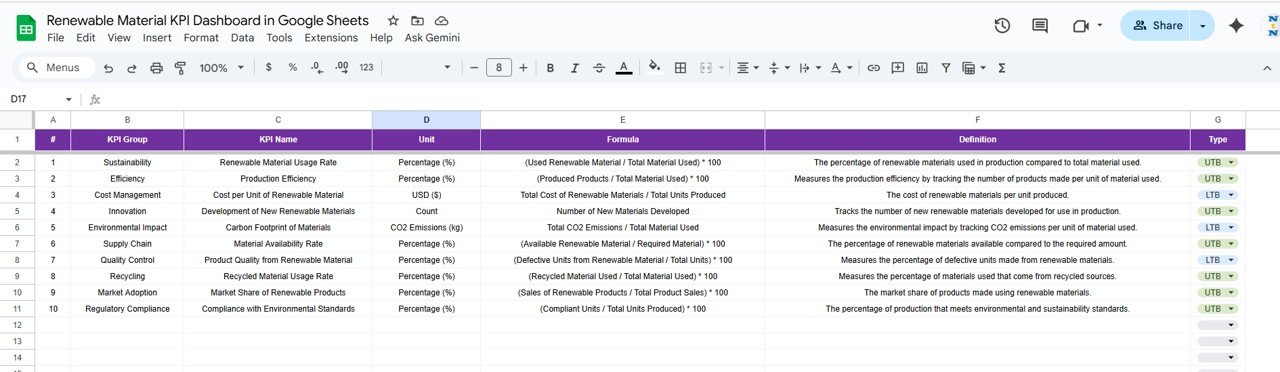
📘 KPI Definition Sheet Tab
A complete KPI library ensuring clarity and data consistency.
Includes:
KPI Group | Unit | Formula | Definition | Type (UTB/LTB)
📦 What’s Inside the Dashboard
✅ Interactive Dashboard Sheet with automated charts
✅ MTD/YTD & YoY comparisons
✅ KPI Trend sheet for visual analysis
✅ Fully editable data and target tables
✅ Conditional formatting & color indicators
✅ Cloud-based collaboration via Google Sheets
🧑💼 Who Can Use This Dashboard
🌿 Sustainability Managers — Track renewable sourcing and waste reduction.
🏭 Procurement Teams — Evaluate supplier compliance and cost efficiency.
💡 Environmental Analysts — Monitor CO₂ emissions and energy usage.
📊 Operations Leaders — Identify areas to improve material efficiency.
🌍 Corporate Sustainability Officers — Report KPIs for ESG and CSR initiatives.
⚙️ Opportunities for Improvement
You can expand this dashboard by:
-
🌱 Integrating IoT data for real-time emission tracking.
-
🔄 Adding supplier-level analytics and regional breakdowns.
-
📈 Building forecast models for future renewable material demand.
-
✉️ Automating email alerts for low performance KPIs.
-
🧭 Linking to Google Data Studio for enhanced executive visuals.
🧠 Best Practices
✅ Update actual and target data monthly.
✅ Use consistent units (e.g., tons, kWh).
✅ Apply standard supplier/region dropdowns for accuracy.
✅ Review energy and emission KPIs quarterly.
✅ Backup data routinely for audit and ESG reporting.
🌟 Why Choose the Renewable Material KPI Dashboard in Google Sheets
-
🌿 All-in-one sustainability management system.
-
⚙️ Completely automated calculations and charts.
-
📈 Real-time performance against targets and previous year.
-
☁️ Google Sheets collaboration for cross-team transparency.
-
🧩 Fully customizable for any industry or organization size.
With this Renewable Material KPI Dashboard, businesses can transform environmental goals into measurable outcomes — driving sustainability performance through data-backed insights and actionable analytics. 🌱📊
🔗 Read the detailed blog post
Watch the step-by-step video Demo:


Reviews
There are no reviews yet.