



In today’s competitive market, data is the ultimate driver of marketing success. Whether you’re launching a new product, optimizing campaigns, or tracking ROI, visibility into your marketing KPIs can make or break your strategy. The Product Marketing KPI Dashboard in Excel from NextGenTemplates.com is your all-in-one performance management tool — designed to help marketers measure, visualize, and improve results with ease.
Built entirely in Microsoft Excel, this ready-to-use dashboard simplifies complex data into clean, actionable visuals. It tracks Month-to-Date (MTD) and Year-to-Date (YTD) performance, automatically compares results with targets, and highlights key trends — giving you the clarity to make confident marketing decisions.
⚙️ Key Features of the Product Marketing KPI Dashboard in Excel
📊 7 Worksheets: Home | Dashboard | KPI Trend | Actual Input | Target | Previous Year | KPI Definition
📅 MTD & YTD Tracking: View performance across short- and long-term periods.
🎯 Target vs Actual Comparison: Instantly spot over- and under-performing KPIs.
📈 Dynamic Charts & Slicers: Interactive visuals for campaign, product, and region analysis.
📉 Conditional Formatting: Green and red arrows signal performance trends.
🧮 Automated Formulas: No manual calculations or coding needed.
💡 Customizable Structure: Add or modify KPIs as your marketing strategy evolves.
💻 User-Friendly Navigation: Home sheet buttons for instant access to any section.
🧭 Dashboard Structure and Pages
🏠 1️⃣ Home Sheet – The Navigation Hub

The Home Sheet acts as your control panel, featuring buttons that link directly to all major sections. Even non-technical users can navigate easily between Dashboard, KPI Trend, Actuals, Target, and Definition sheets.
💡 Purpose: Simplify access and maintain a professional, intuitive interface.
📊 2️⃣ Dashboard Sheet – The Heart of Marketing Performance
This is where the magic happens — a visual summary of your marketing success.
Includes:
Month selector (cell D3) for quick filtering.
KPI cards showing Actual, Target, and Previous Year (PY) data for MTD & YTD.
Trend arrows (🟢 for growth, 🔴 for decline).
Dynamic charts showcasing campaign results, conversion rates, and sales performance.
💡 Purpose: Instantly monitor progress and share results during marketing reviews.
📈 3️⃣ KPI Trend Sheet – Deep Dive into Performance
Analyze any individual KPI’s movement over time using a dropdown (cell C3).
Features:
Displays KPI Group, Unit, Formula, and Type (UTB/LTB).
Dynamic MTD & YTD trend charts comparing Actual vs Target vs PY.
Identify seasonality or recurring patterns in campaign performance.
💡 Purpose: Enable managers to understand “why” performance is improving or lagging.
📋 4️⃣ Actual Numbers Input Sheet – Record Real-Time Data
This sheet captures actual KPI results, linking directly to the dashboard visuals.
Columns: KPI Name | Month | MTD Actual | YTD Actual
Automatically integrates with all charts and comparisons once updated.
💡 Purpose: Maintain accurate, up-to-date data for live insights.
🎯 5️⃣ Target Sheet – Set Measurable Goals
Define monthly and yearly targets for every KPI to ensure each performance metric has a benchmark.
💡 Purpose: Compare actual progress against strategic objectives.
🕰️ 6️⃣ Previous Year Numbers Sheet – Benchmark Historical Growth
Input last year’s MTD and YTD results to visualize year-over-year improvement.
💡 Purpose: Evaluate long-term growth and performance consistency.
📘 7️⃣ KPI Definition Sheet – Maintain Consistency
Keep your KPIs standardized with clear definitions, formulas, and units.
Columns: KPI Name | Group | Unit | Formula | Definition | Type (LTB/UTB)
💡 Purpose: Prevent confusion and ensure every stakeholder interprets KPIs uniformly.
🌟 Advantages of the Product Marketing KPI Dashboard
✅ Complete Marketing Visibility: Track sales, campaigns, and engagement in one place.
📈 Real-Time Updates: View progress instantly as data changes.
📉 Automated Comparisons: CY vs PY and Target vs Actual.
💼 Professional Presentation: Ideal for stakeholder or board reporting.
📊 Visual Insights: Identify trends and underperforming areas fast.
⚙️ No Additional Software: 100 % Excel-based — no Power BI or macros required.
💰 Cost-Effective Solution: Enterprise-level analytics without added cost.
💡 Popular KPIs to Track
🎯 Marketing KPIs: Campaign ROI (%), Cost per Lead ($), Conversion Rate (%), Product Awareness (%).
💵 Sales KPIs: Revenue Growth (%), Units Sold, Average Order Value ($).
💬 Customer KPIs: Retention Rate (%), NPS (Net Promoter Score), Refund Rate (%).
💡 Use these metrics to understand campaign performance and ROI effectively.
🧠 Best Practices for Using This Dashboard
📅 Update Actual & Target data monthly.
📋 Define KPIs clearly before implementation.
🟢 Use conditional formatting for better visualization.
📊 Analyze trends quarterly for strategic adjustments.
📈 Focus on KPIs that align with business goals.
🔐 Protect formulas and dropdowns from edits.
👩💼 Who Can Use This Dashboard
💼 Product Marketing Managers
📊 Data & Performance Analysts
🏢 Brand Strategists
💻 Marketing Agencies
📈 Business Development Teams
🧩 Conclusion
The Product Marketing KPI Dashboard in Excel is more than a reporting tool — it’s a complete performance management system for data-driven marketers.
From campaign effectiveness to ROI tracking, it gives marketing teams the insights they need to make informed, strategic decisions.
📊 Analyze smarter, report faster, and drive results — with NextGen Templates’ Product Marketing KPI Dashboard in Excel.
🔗 Click Here to Read the Detailed Blog Post
📺 Visit our YouTube Channel for step-by-step tutorials.
Watch the step-by-step video tutorial:
Compatibility and Requirements
- Works in Microsoft Excel desktop (Excel 2016 or later, or Microsoft 365).
- The dashboard uses dynamic charts and slicers. Microsoft explains them in Use slicers to filter data.
Frequently Asked Questions
Which sheets are included?
Seven sheets: Home, Dashboard, KPI Trend, Actual Input, Target, Previous Year and KPI Definition.
How do I update the dashboard?
Enter your MTD and YTD results in the Actual Numbers input sheet and your goals in the Target sheet. Then pick a month in cell D3 of the Dashboard sheet and the KPI cards and charts update.
Can I compare this year with last year?
Yes. Add last year’s MTD and YTD figures to the Previous Year Numbers sheet. The Dashboard shows them next to your actuals and targets.
How do I see the trend for one KPI?
Open the KPI Trend sheet and choose the KPI from the dropdown in cell C3. It shows the KPI group, unit, formula and type (UTB or LTB), with MTD and YTD charts comparing actual, target and previous year.
Is there a Power BI version?
Yes. See the Product Marketing KPI Dashboard in Power BI.
Related Marketing Templates
- Product Marketing KPI Dashboard in Power BI: the same KPIs in Power BI
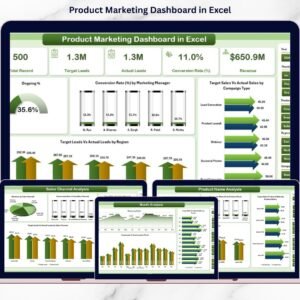
- Product Marketing Dashboard in Excel: another Excel dashboard for product marketing
- Marketing Dashboard in Excel: a general marketing performance view
- Sales and Marketing Product Development KPI Dashboard in Excel: KPIs for product development work
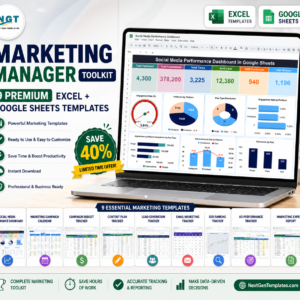
- Marketing Manager Toolkit: 9 templates for marketers in one download
Browse all Excel KPI dashboards.




















Reviews
There are no reviews yet.