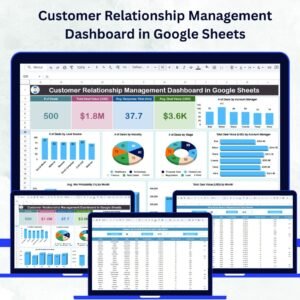
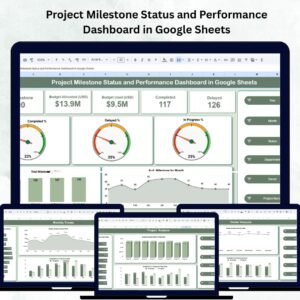
Managing multiple projects efficiently requires visibility, structure, and data-driven insights. The Project Milestone Tracking Dashboard in Google Sheets is a ready-to-use, fully interactive dashboard designed to help teams monitor milestones, track budgets, and visualize progress in real time.
Built with simplicity and flexibility in mind, this Google Sheets-based template transforms complex project data into clear, actionable visuals — enabling managers and teams to stay aligned, identify risks, and meet deadlines effectively.
🔑 Key Features of the Project Milestone Tracking Dashboard in Google Sheets
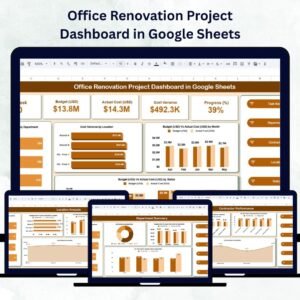
📊 Overview Sheet Tab
The Overview tab acts as your project control center — displaying all critical metrics and progress indicators in one view.
Cards Section:
-
🧩 # of Milestones – Total milestones across all projects.
-
💰 Budget Allocated (USD) – Total project budget planned.
-
💸 Budget Used (USD) – Actual expenditure to date.
-
✅ Completed – Number of successfully achieved milestones.
-
⚠️ Delayed – Number of milestones behind schedule.
Charts Section:
-
Total Milestone by Status – Displays completion vs. in-progress vs. delayed percentages.
-
Completed % / In Progress % / Delayed % – Snapshot of current performance.
This tab gives an instant visual summary of project health — ideal for management reviews and stakeholder reporting.
🏗️ Project Analysis Tab
Dive deeper into individual project performance with visual comparisons.
Charts include:
-
Budget Used (USD) by Project Name
-
Budget Allocated (USD) by Project Name
-
Completed vs. In Progress by Project Name
This helps identify projects that are underperforming, over budget, or facing delays — allowing timely corrective actions.
🏢 Department Analysis Tab
Measure milestone progress and spending across departments.
Charts include:
-
Budget Used vs. Allocated (USD) by Department
-
Completed vs. In Progress by Department
This view supports interdepartmental performance evaluation, enabling department heads to optimize resource allocation and project planning.
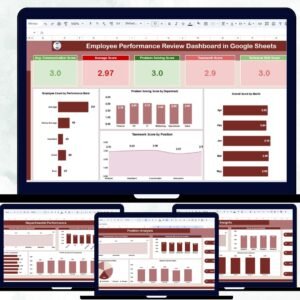
👥 Owner Analysis Tab
Evaluate accountability and performance at the project owner level.
Charts include:
-
Budget Used vs. Allocated (USD) by Owner
-
Completed vs. In Progress by Owner
Ideal for leadership reporting, this analysis reveals which project managers consistently deliver within scope, time, and budget.
📅 Monthly Trends Tab
Gain a time-based understanding of project progress.
Charts include:
-
Budget Used vs. Allocated (USD) by Month
-
Completed vs. In Progress by Month
Helps forecast workload, detect recurring issues, and evaluate seasonality in project execution.
🔍 Search Tab
Quickly find specific project or milestone records using keyword or field-based search filters.
Search for:
-
Project name
-
Department
-
Owner
-
Milestone status
-
Date range
This dynamic search functionality saves time and enhances user navigation.
📋 Data Sheet Tab
The backbone of the dashboard — where all project and milestone data resides.
Includes fields for:
-
Project Name
-
Department
-
Owner
-
Budget Allocated
-
Budget Used
-
Milestone Status
-
Completion Date
All visualizations update automatically as you input or modify data — no coding required.
📦 What’s Inside the Template
✅ Overview Dashboard (KPIs + Charts)
✅ Project, Department, and Owner Analysis Pages
✅ Monthly Trend Analysis
✅ Keyword Search Page
✅ Centralized Data Input Sheet
✅ Auto-Updating Graphs and KPIs
✅ Fully Editable Design
Everything you need for real-time project performance tracking — in a single Google Sheets file.
👩💼 Who Can Use This Dashboard
🎯 Project Managers – Monitor progress, budgets, and timelines easily.
🏢 Department Heads – Track team performance and workload distribution.
💼 Executives – Gain a top-level overview of organizational project health.
📈 PMOs (Project Management Offices) – Standardize milestone reporting and reduce manual tracking time.
🌍 Remote Teams – Collaborate seamlessly with shared, cloud-based access.
🌟 Advantages of Using the Project Milestone Tracking Dashboard
-
📊 Centralized Monitoring: Keep all project data in one interactive view.
-
💸 Budget Control: Compare allocated vs. used funds to prevent overspending.
-
⏱️ Timely Insights: Detect delays before they impact delivery.
-
⚙️ Customizable Design: Add KPIs, charts, or filters as per your workflow.
-
🤝 Collaborative Access: Teams can update and analyze together in real time.
-
📈 Data Visualization: Convert raw project data into actionable performance insights.
💡 Best Practices
-
Update milestone data weekly for accurate visuals.
-
Use conditional color coding (green, yellow, red) to flag project health.
-
Define consistent milestone naming conventions for clarity.
-
Track department and owner performance monthly to optimize efficiency.
-
Review the Monthly Trends tab for forecasting and performance improvement.
🚀 How This Dashboard Helps Project Managers
-
Simplifies Project Oversight: View all milestones, budgets, and owners in one dashboard.
-
Improves Accountability: Track who owns what and whether it’s on track.
-
Supports Data-Driven Planning: Identify budget leaks and performance gaps instantly.
-
Enhances Transparency: Share a single dashboard with stakeholders for real-time reporting.
-
Saves Time: Automates reporting tasks and eliminates repetitive data entry.


Reviews
There are no reviews yet.