



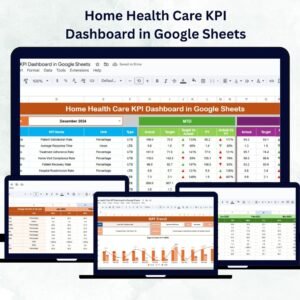
In today’s healthcare industry, data-driven insights are key to delivering quality patient care, improving staff performance, and maintaining operational efficiency. The Home Health Care KPI Dashboard in Google Sheets is a ready-to-use and fully automated performance tracking tool that empowers home care agencies to monitor their clinical, operational, and financial KPIs in real time — all in one interactive dashboard.
Built in Google Sheets, this template helps healthcare professionals easily input data, track Month-to-Date (MTD) and Year-to-Date (YTD) performance, and visualize results through automated charts and indicators. Whether you manage a small clinic or a multi-location agency, this dashboard gives you a centralized view of your care quality, productivity, and compliance.

🔑 Key Features of the Home Health Care KPI Dashboard in Google Sheets
📋 Dashboard Sheet Tab
The main interface of your performance tracking system.
Month Selection (Cell D3): Choose any month to instantly update all dashboard visuals.
MTD & YTD Metrics: View current progress, targets, and previous year comparisons.
Conditional Icons: Green ▲ for improvement, Red ▼ for decline — simple and visual.
Real-Time Updates: Automatically refreshes based on data entered in other sheets.
Performance Summary: Displays overall KPI count, MTD achievement rate, and YTD trends.
This sheet provides at-a-glance visibility into your organization’s health and performance.
📈 KPI Trend Sheet Tab
Analyze long-term performance with detailed KPI trend charts.
Select a KPI from the dropdown (Cell C3).
Displays KPI Group, Unit, Formula, and Type (UTB/LTB).
Visualize monthly MTD and YTD data through interactive charts.
Spot recurring performance patterns or emerging issues early.
💾 Actual Numbers Sheet Tab
Maintain actual monthly data for all your KPIs.
Update MTD and YTD values for each KPI.
Automatically updates the dashboard and trend visuals.
Change the first month of the year in Cell E1 for flexible reporting cycles.
🎯 Target Sheet Tab
Set measurable goals for your team.
Enter monthly and yearly target values for each KPI.
Enables automatic comparison between Actual vs. Target.
Perfect for performance tracking and goal alignment.
📊 Previous Year Numbers Sheet Tab
Benchmark your growth and consistency.
Record past year’s KPI data for accurate year-over-year analysis.
Identify improvement areas and measure long-term progress.
📖 KPI Definition Sheet Tab
Ensure standardization across all performance metrics.
Define each KPI with details like Group, Unit, Formula, Definition, and Type.
Classify each KPI as UTB (Upper-the-Better) or LTB (Lower-the-Better) for clarity.
Supports team understanding and transparent communication.
📦 What’s Inside the Dashboard Package
✅ Dashboard Sheet – Visual summary of all KPIs with dynamic charts.
✅ KPI Trend Sheet – Analyze month-over-month performance patterns.
✅ Actual Numbers Sheet – Centralized input section for real data.
✅ Target Sheet – Define short- and long-term goals.
✅ Previous Year Sheet – Year-over-year performance tracking.
✅ KPI Definition Sheet – Standardized reference for all metrics.
All sheets are interlinked, auto-calculating, and refresh in real time. No manual formulas needed. 🚀
👩⚕️ Who Can Benefit from This Dashboard
🏥 Home Health Care Agencies – Track clinical performance and staff productivity.
💊 Private Clinics – Manage operational costs, patient flow, and compliance metrics.
👨⚕️ Healthcare Administrators – Monitor MTD/YTD performance for all key areas.
📋 Nurse Supervisors & Case Managers – Evaluate care quality and patient satisfaction.
💼 Consultants & Executives – Present performance reports with clear visual data.
🧠 How to Use the Dashboard
Input Actual Data: Enter monthly figures in the Actual Numbers sheet.
Set Targets: Define KPI goals in the Target Sheet.
Compare Performance: Use the Dashboard Sheet for visual insights.
Analyze Trends: Track long-term KPI progress using the KPI Trend Sheet.
Benchmark Growth: Use the Previous Year Sheet for historical comparison.
All visuals update automatically — no coding or formula adjustments needed.
🌟 Why Choose This Dashboard
Centralized KPI tracking for clinical, operational, and financial data.
Real-time updates with color-coded performance indicators.
Supports MTD and YTD analysis for precise trend monitoring.
Fully customizable — add new KPIs or modify existing ones.
Built in Google Sheets for easy sharing and collaboration.
Ideal for agencies focused on care quality, compliance, and efficiency.
The Home Health Care KPI Dashboard in Google Sheets transforms scattered data into actionable insights, helping you enhance patient outcomes, manage resources efficiently, and maintain transparency across your team.
🔗 Click here to read the Detailed blog post
Watch the step-by-step video Demo:
🔗 Visit our YouTube channel to learn step-by-step video tutorials
Compatibility and Requirements
- Works in Google Sheets. You need a free Google account and a web browser.
- You pick the month in cell D3 of the Dashboard sheet and the KPI in cell C3 of the KPI Trend sheet. Google explains dropdowns in Create an in-cell dropdown list.
Frequently Asked Questions
Which sheets are included?
Six sheets: Dashboard, KPI Trend, Actual Numbers, Target, Previous Year Numbers and KPI Definition.
How do I update the dashboard?
Enter your MTD and YTD values in the Actual Numbers sheet and your goals in the Target sheet. Then choose a month in cell D3 of the Dashboard sheet and the visuals update.
Can I start the year in a different month?
Yes. Change the first month of the year in cell E1 of the Actual Numbers sheet.
What do UTB and LTB mean?
UTB means Upper-the-Better and LTB means Lower-the-Better. The KPI Definition sheet lists the type for each KPI, along with its group, unit, formula and definition.
Is there an Excel or Power BI version?
Yes. See the Home Health Care KPI Dashboard in Excel and the Home Healthcare KPI Dashboard in Power BI.
Related Healthcare Templates
- Home Health Care KPI Dashboard in Excel: the same KPIs in Excel
- Home Healthcare KPI Dashboard in Power BI: the Power BI edition
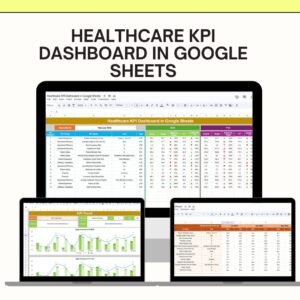
- Healthcare KPI Dashboard in Google Sheets: a general healthcare KPI view in Google Sheets
- Healthcare Dashboard in Google Sheets: another healthcare dashboard in Google Sheets
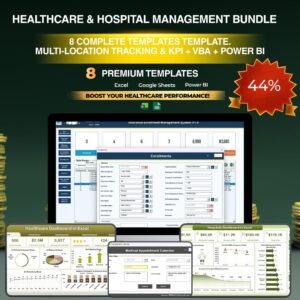
- Healthcare & Hospital Management Bundle: 8 healthcare templates in one download
Browse all Google Sheets KPI dashboards.












Reviews
There are no reviews yet.