


Innovation is the lifeblood of every organization aiming to stay competitive. But how do you measure innovation performance? The R&D KPI Scorecard in Excel makes it simple, structured, and insightful.
This ready-to-use Excel template helps research and development teams track performance, visualize progress, and make data-driven decisions — all in one interactive workbook. Whether you’re leading multiple projects or managing innovation cycles, this tool turns complex data into actionable intelligence.
🔑 Key Features of R&D KPI Scorecard in Excel
📊 Four Powerful Sheets – Scorecard, KPI Trend, Input Data, and KPI Definition.
🎯 Actual vs Target Tracking – Monitor month-to-date (MTD) and year-to-date (YTD) results side by side.
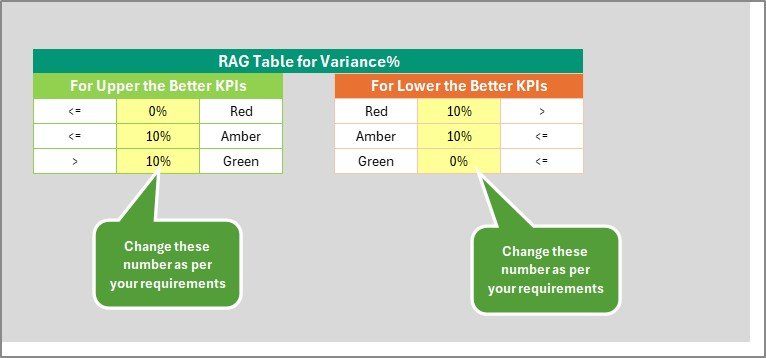
🧠 Color-Coded Indicators – Instantly spot progress using green, yellow, and red signals.
📈 Trend Analysis – Visual charts show how performance evolves over time.
🗂 Dynamic Dropdowns – Filter KPIs by month or metric for faster insights.
📘 Centralized Data Management – Update numbers in one place; dashboards refresh automatically.
⚙️ Customizable KPIs – Add or edit metrics to fit your innovation goals.
💡 User-Friendly Design – No coding or advanced Excel skills needed.
⏱ Time-Saving Automation – Formula-based logic reduces manual reporting.
🧩 Strategic Alignment – Helps teams ensure innovation supports business goals.
📂 What’s Inside the R&D KPI Scorecard
This Excel-based scorecard includes four key worksheet tabs designed for complete performance tracking:
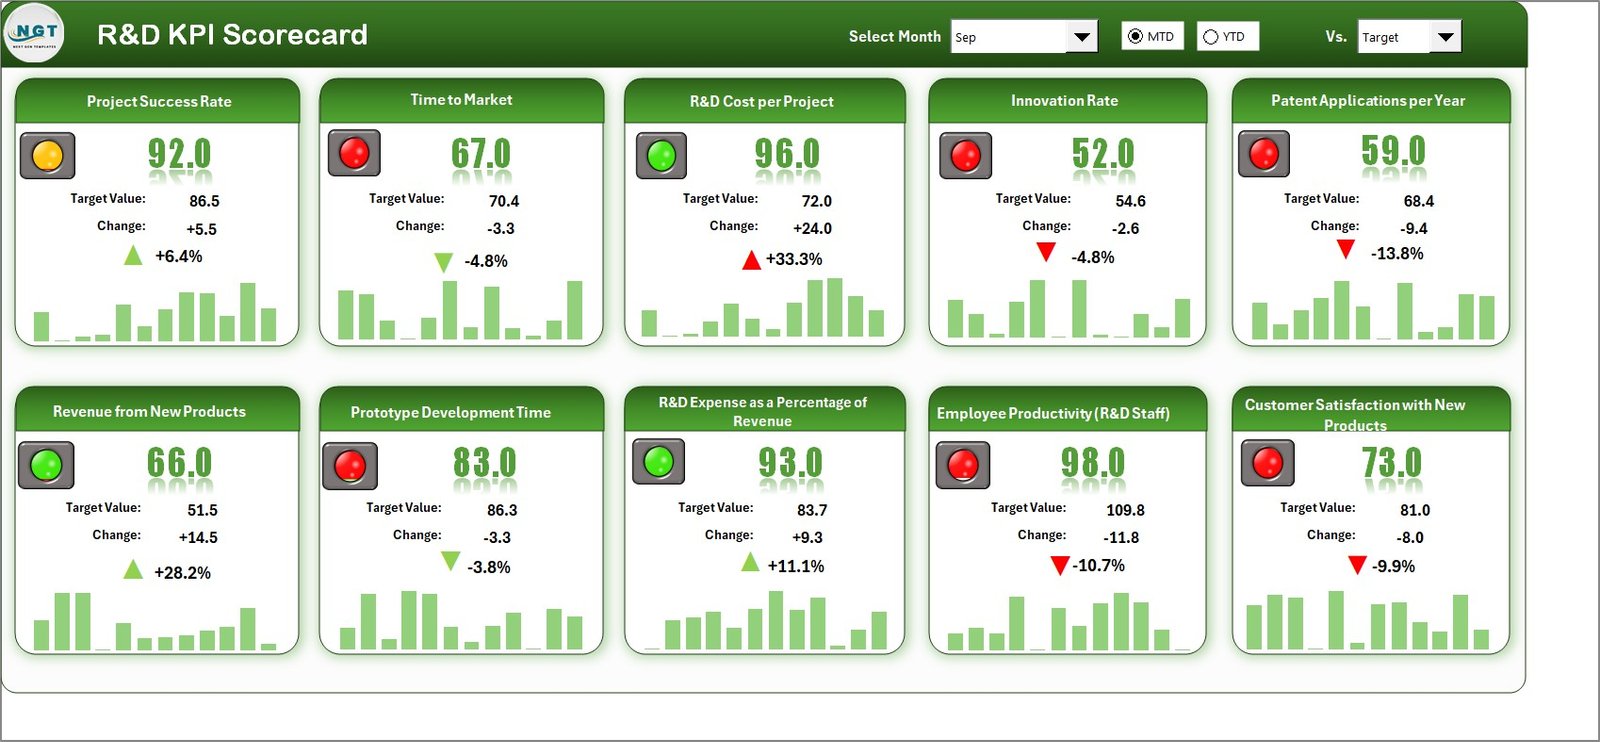
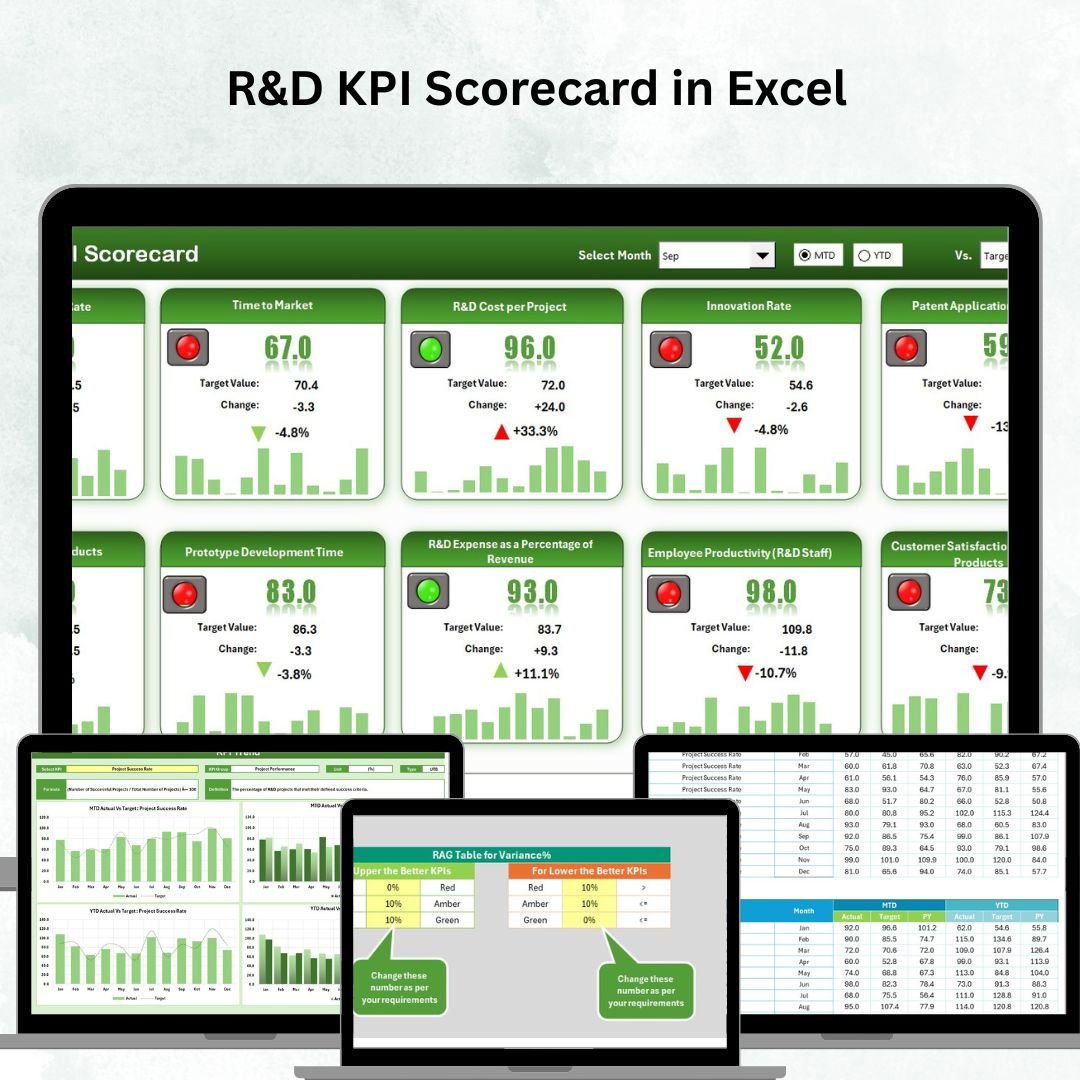
Scorecard Sheet – The Main Dashboard
Central view of all R&D KPIs.
Compare Actual vs Target with color-coded visuals.
Dropdown menus to view data as MTD or YTD.
Overview of innovation performance at a glance.
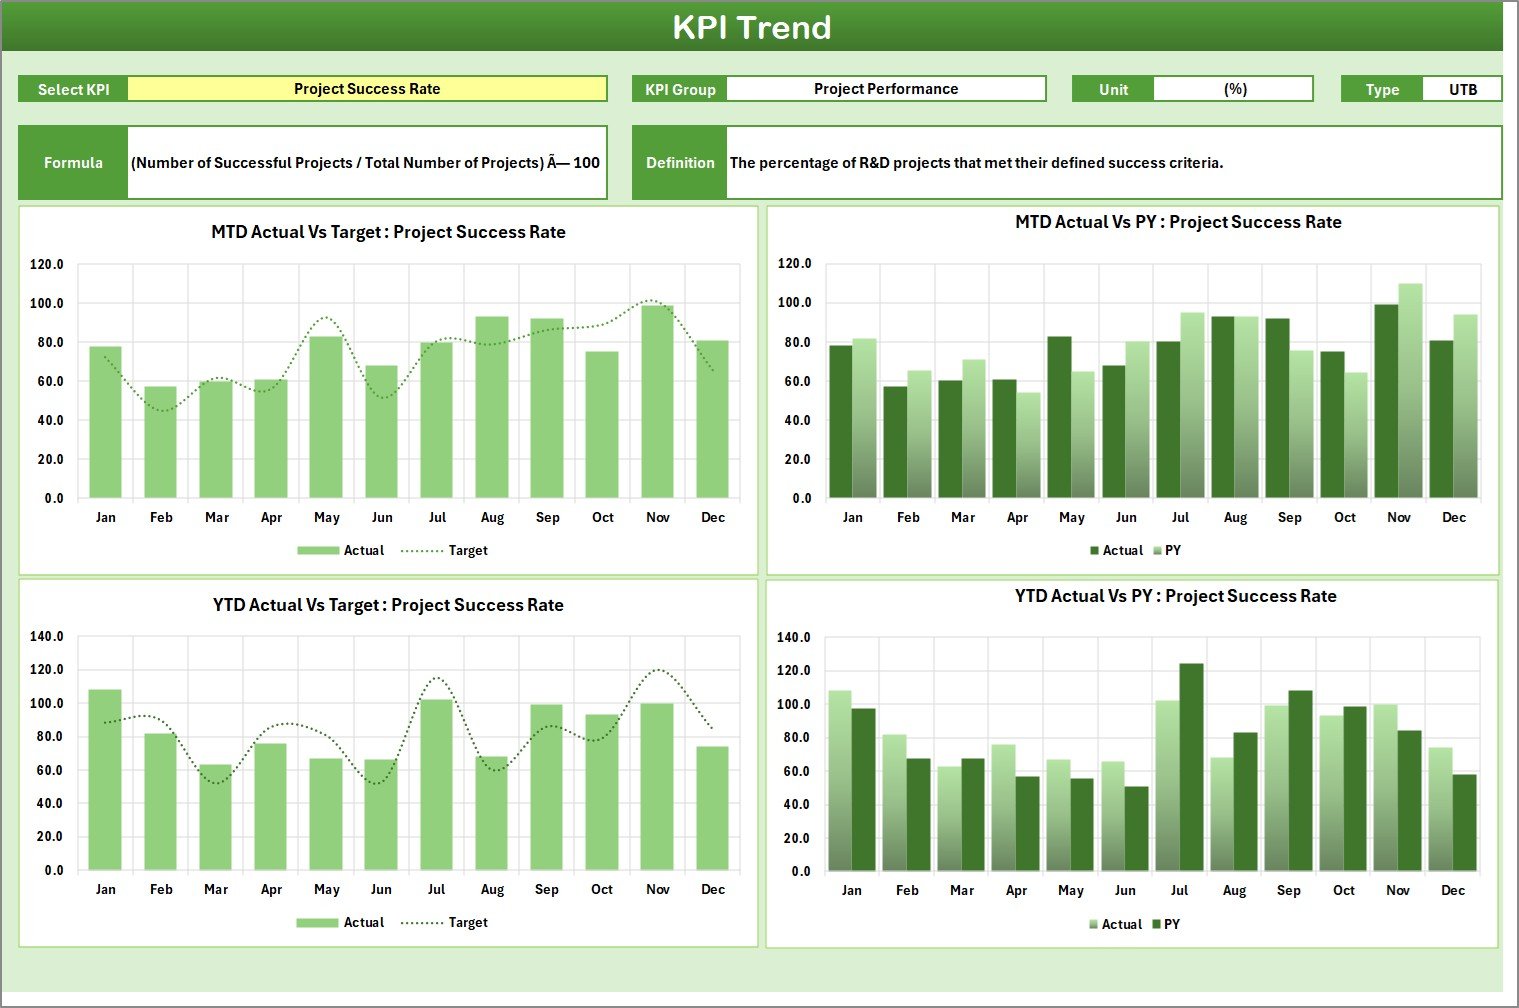
KPI Trend Sheet – Visual Performance Tracking
Analyze trends for any KPI over time.
Displays KPI Group, Formula, Unit, and Definition.
Charts for Actual, Target, and Previous Year data.
Detect seasonal variations and long-term improvements.
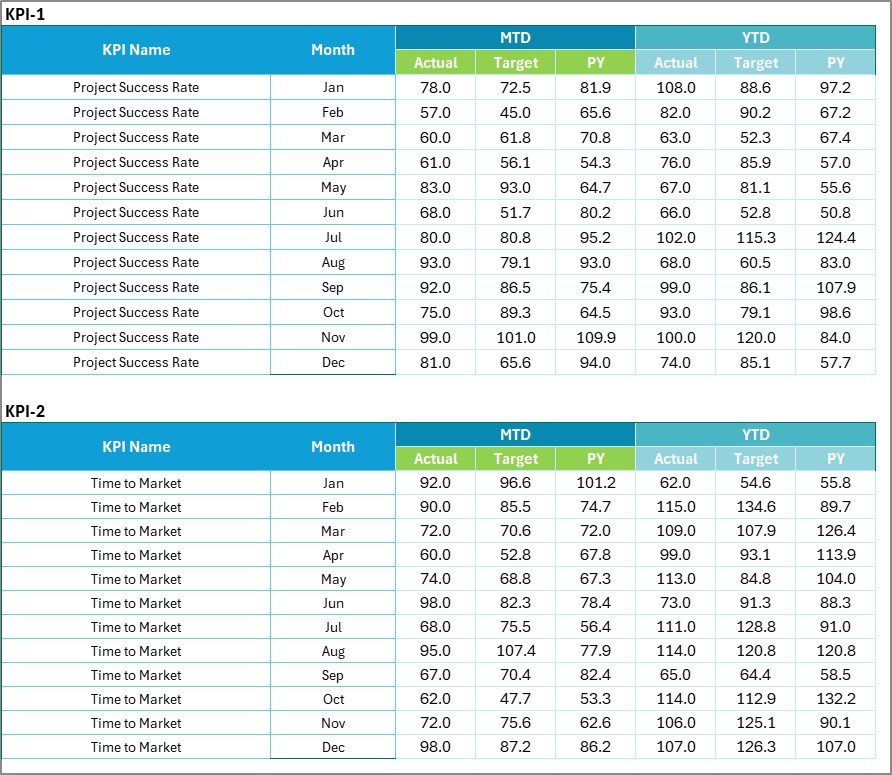
Input Data Sheet – Centralized Data Source
Enter Actual, Target, and Previous Year values monthly.
Automatic updates across all visuals and formulas.
Simplifies data management and ensures accuracy.
KPI Definition Sheet – Your Reference Guide
Lists KPI names, groups, formulas, and definitions.
Promotes consistency and transparency.
Easily editable to adapt to your organization’s KPIs.
🛠 How to Use the R&D KPI Scorecard in Excel
Input Data: Enter monthly Actual, Target, and Previous Year figures.
Define KPIs: Set formulas and parameters in the KPI Definition Sheet.
Analyze Performance: Use the Scorecard Sheet for quick KPI overviews.
Track Trends: Explore the KPI Trend Sheet for historical insights.
Take Action: Identify bottlenecks and focus on high-impact areas.
👥 Who Can Benefit from This Scorecard?
🧪 R&D Teams – Track innovation success rates and project timelines.
🏗 Engineering Departments – Measure efficiency and process improvements.
💰 Finance Teams – Monitor R&D cost performance and ROI.
👩💼 Management Executives – Evaluate productivity and alignment with company goals.
🧍♂️ HR & Training Teams – Assess R&D staff development and output.
✅ Why Choose This Scorecard?
Unlike traditional spreadsheets, this template is interactive, automated, and customizable. It consolidates your R&D KPIs into one clean visual system, giving you instant clarity on progress, efficiency, and innovation performance.
By turning raw data into visual insights, the R&D KPI Scorecard in Excel helps you focus on what truly matters — driving innovation and measurable results.
Click here to read the Detailed blog post
👉 Visit our YouTube channel to learn step-by-step video tutorials






























Reviews
There are no reviews yet.