

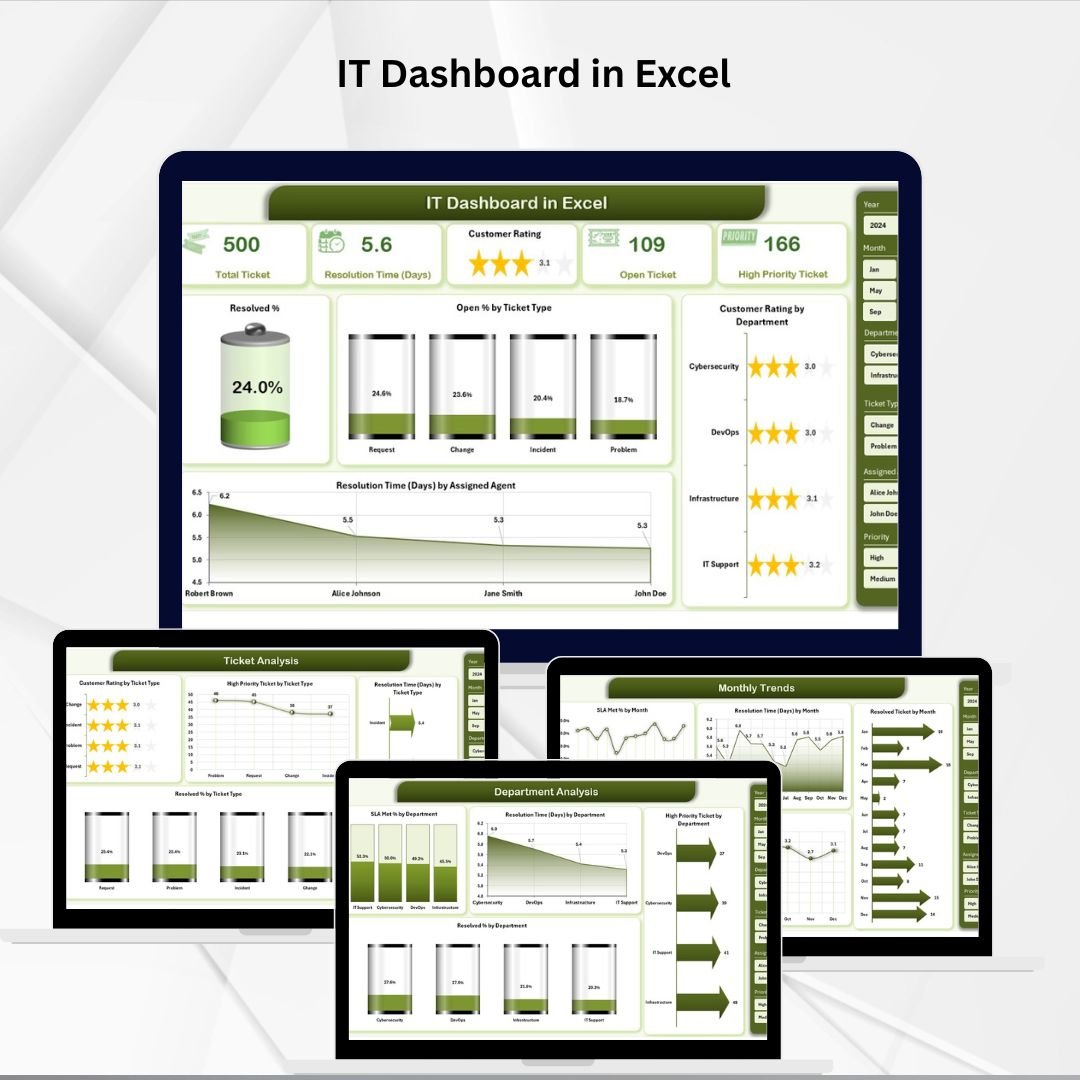

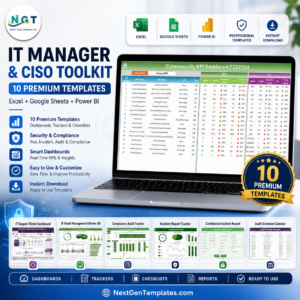
In today’s digital-first world, IT departments are the backbone of organizational success. From resolving tickets to ensuring system uptime, IT teams must balance efficiency, transparency, and accountability. Yet, many organizations still rely on scattered reports, manual tracking, or costly IT management software that is hard to implement and even harder to maintain.
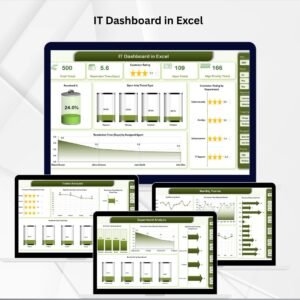
The IT Dashboard in Excel changes this. Designed as a ready-to-use performance monitoring solution, it transforms raw IT records into actionable insights—all within the familiar environment of Microsoft Excel. Whether you manage a small IT team or oversee enterprise-wide operations, this dashboard consolidates everything you need into one structured, visual, and interactive file.
✨ Key Features of the IT Dashboard in Excel
📊 Overview Page – Central Hub
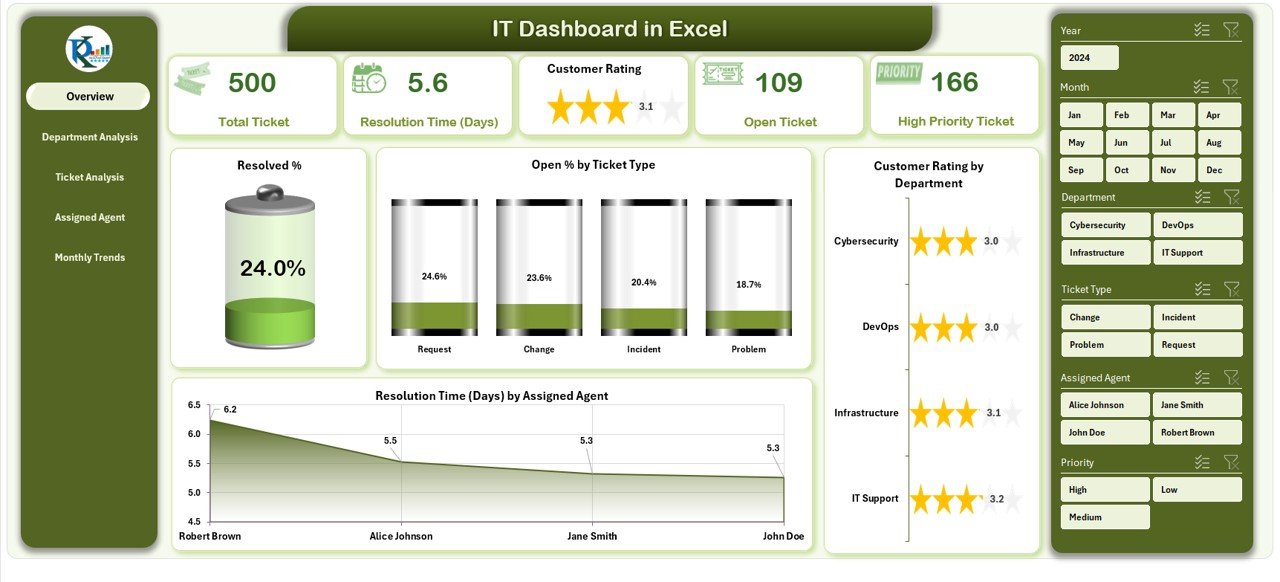
The Overview Page acts as the dashboard’s control center. With built-in slicers for filtering, you can instantly customize the view by time period or attribute. It includes five summary cards for top KPIs and four dynamic charts:
Resolved % – Track resolution efficiency at a glance.
Open % by Ticket Type – Spot categories where issues pile up.
Customer Rating by Department – Monitor service quality across teams.
Resolution Time by Agent – Compare how quickly different agents close tickets.
🏢 Department Analysis Page – Team Performance
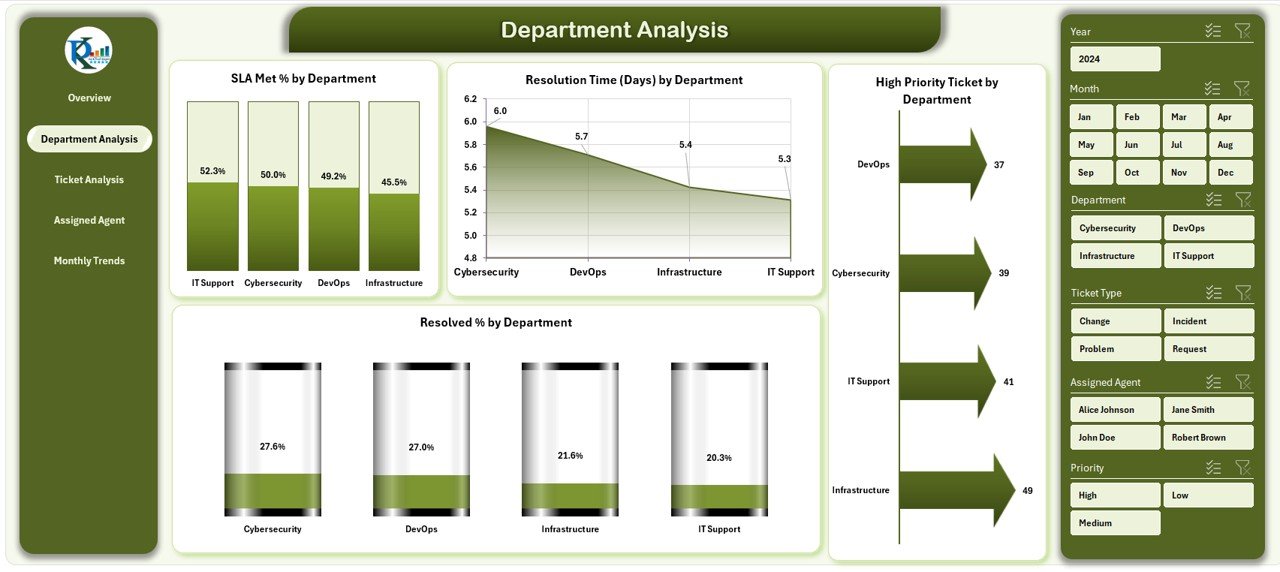
Analyze departmental outcomes with four key charts:
SLA Met % by Department
Average Resolution Time by Department
High-Priority Tickets by Department
Resolved % by Department
This page instantly shows which teams are excelling and where improvement is needed.
🎫 Ticket Analysis Page – Issue Insights
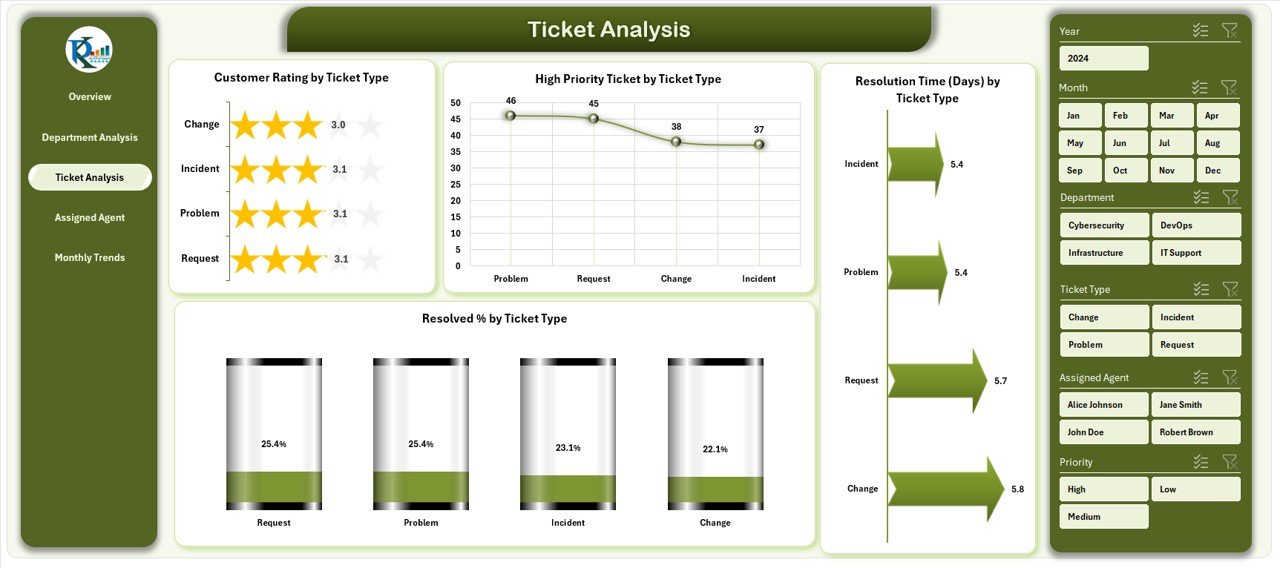
Go deeper into ticket-level performance with charts for:
Customer Rating by Ticket Type
Distribution of High-Priority Tickets
Resolution Time by Ticket Type
Resolved % by Ticket Type
This view highlights how different issue types impact workload and service quality.
👨💻 Agent Analysis Page – Individual Impact
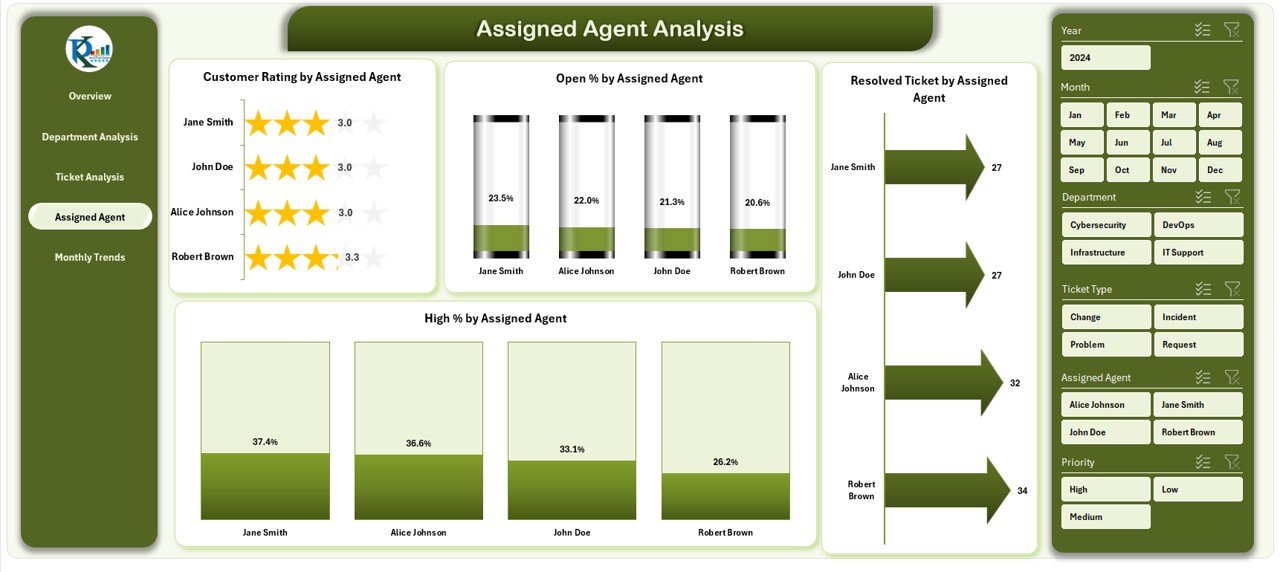
Evaluate individual contributions with metrics like:
Customer Rating by Assigned Agent
% of High-Priority Tickets handled
Open % by Assigned Agent
Total Resolved Tickets per Agent
This ensures accountability and recognition for high performers.
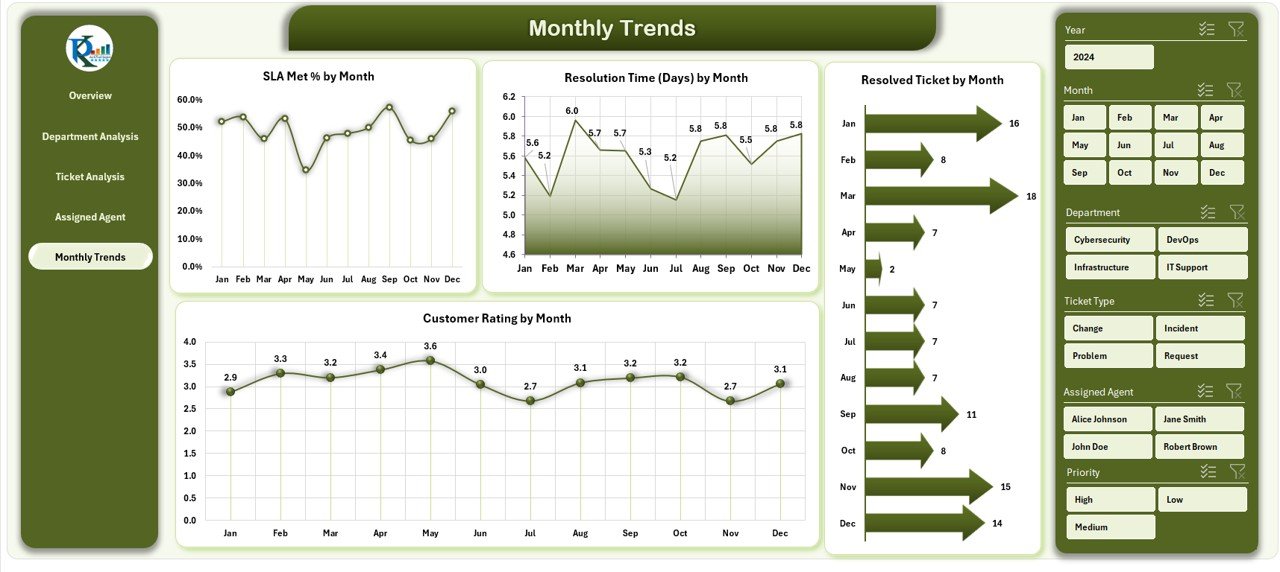
📅 Monthly Trends Page – Time-Based Tracking
Spot long-term performance patterns with charts showing:
SLA Met % by Month
Resolution Time by Month
Tickets Resolved by Month
Customer Rating by Month
This page helps forecast workloads and refine resource planning.
⚙️ Support Sheet – Data Backbone
Includes reference data (departments, ticket types, SLA targets, agents) to keep slicers accurate and consistent.
📂 What’s Inside the Dashboard
Overview Page – Executive summary with slicers and KPIs.
Department Analysis – Department-level tracking.
Ticket Analysis – Ticket type trends and insights.
Agent Analysis – Individual performance reports.
Monthly Trends – Historical and seasonal tracking.
Support Sheet – Centralized data for consistency.
👥 Who Can Benefit from This Dashboard
🏢 Small & Medium Businesses – Cost-effective IT tracking without expensive software.
🏭 Large Enterprises – Monitor multiple teams, departments, and KPIs in one place.
📞 IT Support Centers – Track SLAs, resolution times, and satisfaction ratings.
🎓 Educational Institutions – Ensure IT departments provide fast, reliable support.
🏥 Healthcare Providers – Monitor IT response in high-stakes environments.
🌟 Advantages of IT Dashboard in Excel
✅ Cost-Effective – Avoids pricey IT management software.
✅ User-Friendly – Built in Excel; no advanced training needed.
✅ Customizable – Add or remove KPIs, adjust visuals, and adapt to your workflows.
✅ Real-Time Tracking – Immediate insights with slicers and formulas.
✅ Transparency – Visibility at both department and agent levels.
✅ Improved Decisions – Visuals highlight bottlenecks before they become issues.
🚀 Opportunities for Improvement
🔄 Connect to live databases for automation.
📊 Use Power Query & Power Pivot for advanced analysis.
📱 Optimize for mobile-friendly viewing.
🤖 Add forecasting functions for workload prediction.
✅ Best Practices
Keep data updated and clean.
Review KPIs quarterly to ensure alignment.
Train staff to use slicers and interpret visuals.
Automate wherever possible with formulas or macros.
Back up your data regularly for audit readiness.
🎯 Conclusion
The IT Dashboard in Excel is more than a reporting tool—it’s a performance management system. It empowers IT teams with clarity, accountability, and speed. By consolidating KPIs into one interactive file, it eliminates scattered reports and equips leaders with insights to make informed decisions. Whether you’re tracking SLA compliance, customer satisfaction, or resolution times, this dashboard provides the structured visibility you need to elevate IT operations.
📌 Click here to read the Detailed blog post
Visit our YouTube channel to learn step-by-step video tutorials
Watch the step-by-step video tutorial:
Compatibility and Requirements
- Works in Microsoft Excel desktop (Excel 2016 or later, or Microsoft 365).
- Microsoft’s guide Use slicers to filter data explains the Excel feature this file is built on.
Frequently Asked Questions
What pages are in the IT Dashboard in Excel?
It has an Overview page, Department Analysis, Ticket Analysis, Agent Analysis, Monthly Trends and a Support sheet with reference data.
Which metrics does it show?
It shows Resolved %, Open % by ticket type, SLA Met %, resolution time, high priority tickets and customer rating, split by department, ticket type, agent and month.
How do I filter the dashboard?
Use the built-in slicers on the Overview page to filter by time period or attribute.
Can I add my own departments and agents?
Yes. The Support sheet holds departments, ticket types, SLA targets and agents, which keep the slicers accurate.
Related IT Templates
- IT Support Ticket Dashboard in Excel: ticket and SLA analysis in Excel
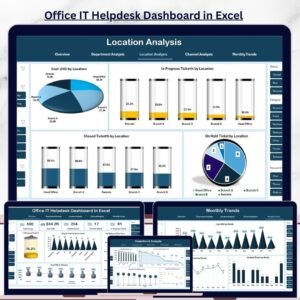
- Office IT Helpdesk Dashboard in Excel: helpdesk view for office IT
- IT Support Ticket Dashboard in Power BI: the Power BI option
- IT Dashboard Report in Excel: a report format for IT data
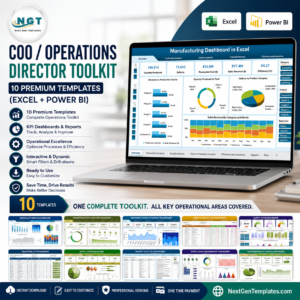
- IT and Cybersecurity Operations Bundle: eight IT templates in one bundle
Browse all Excel IT templates or the Excel dashboards.











Reviews
There are no reviews yet.