In today’s technology-driven business landscape, organizations depend on IT and digital systems to deliver value, streamline operations, and drive innovation. But with increasing complexity comes the need for effective monitoring. From budgets and project execution to issue resolution and resource utilization, businesses must have clear visibility into performance.
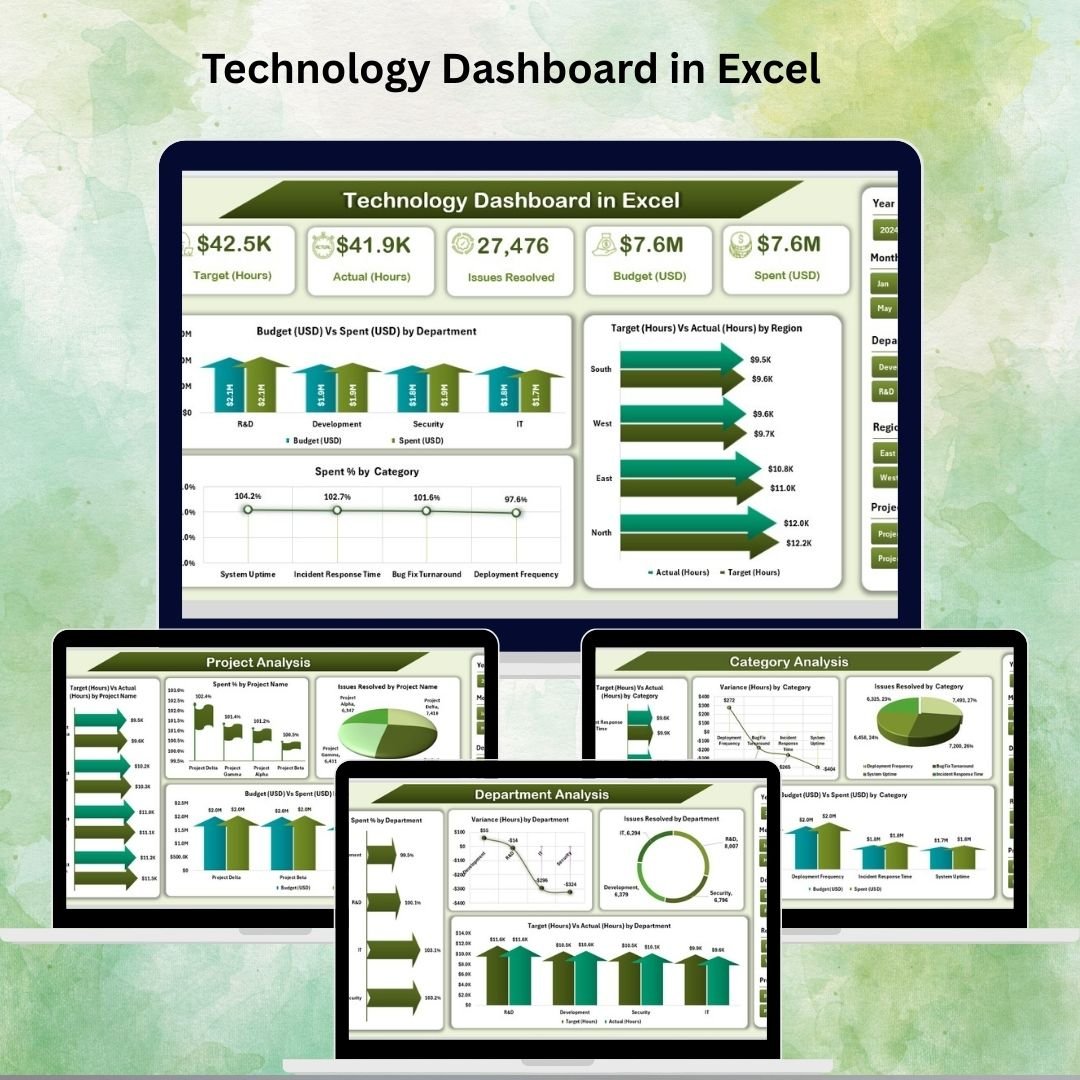
The Technology Dashboard in Excel is a ready-to-use, interactive template designed to help CIOs, IT managers, and technology leaders track key performance metrics in one place. With multiple analysis pages, dynamic charts, and drill-down capabilities, this dashboard provides insights that empower smarter, data-driven decisions.
Unlike complex business intelligence software, this Excel dashboard is cost-effective, customizable, and easy to implement. It’s ideal for organizations of any size that want transparency and accountability without investing in additional tools.
✨ Key Features
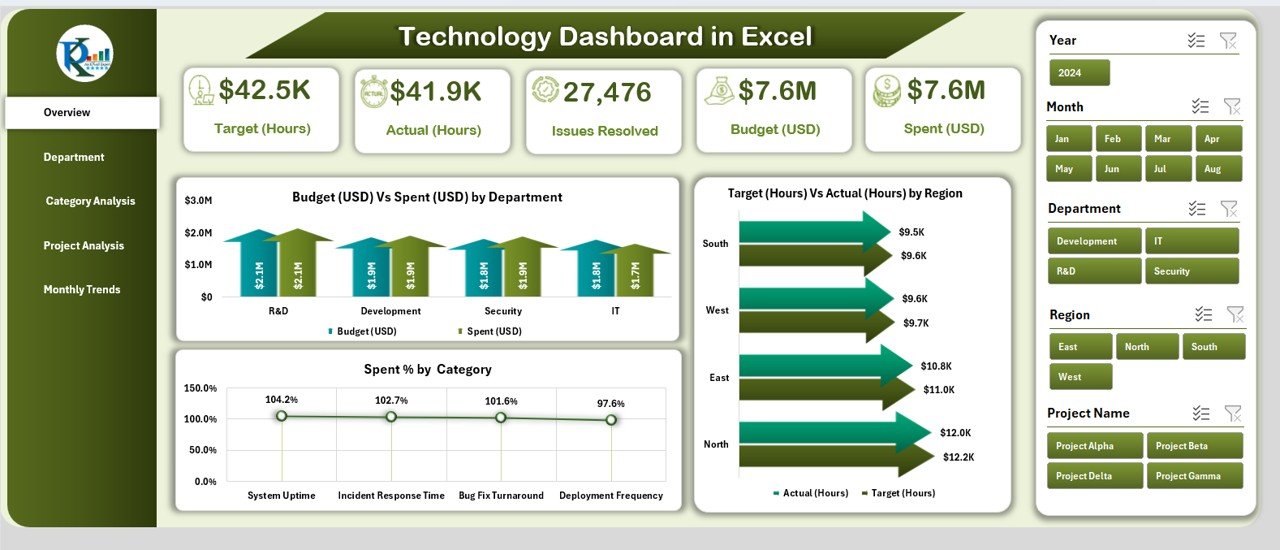
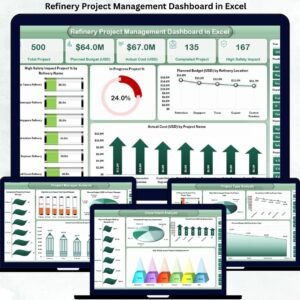
✅ Overview Page
-
5 KPI Cards summarizing budget, actual spend, variance, utilization, and resolved issues.
-
Charts like Budget vs Spend by Department, Target vs Actual Hours by Region, and Spend % by Category.
-
Perfect for executives needing quick high-level insights.
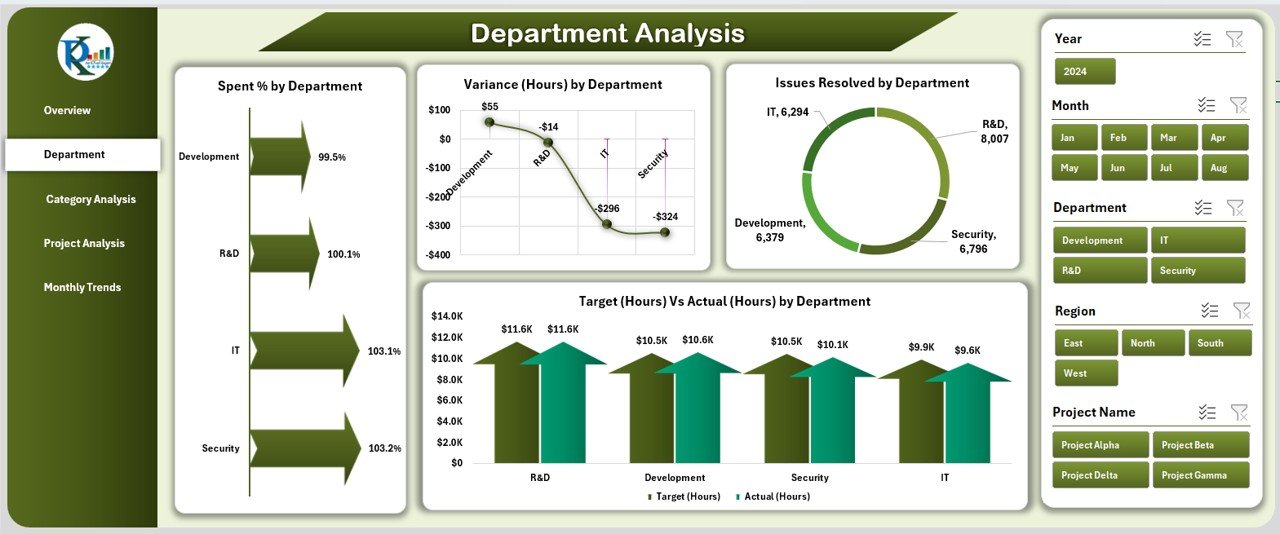
✅ Department Analysis
-
Compare departmental efficiency with metrics such as Spend %, Variance (Hours), Issues Resolved, and Target vs Actual Hours.
-
Promotes accountability across IT, operations, and support teams.
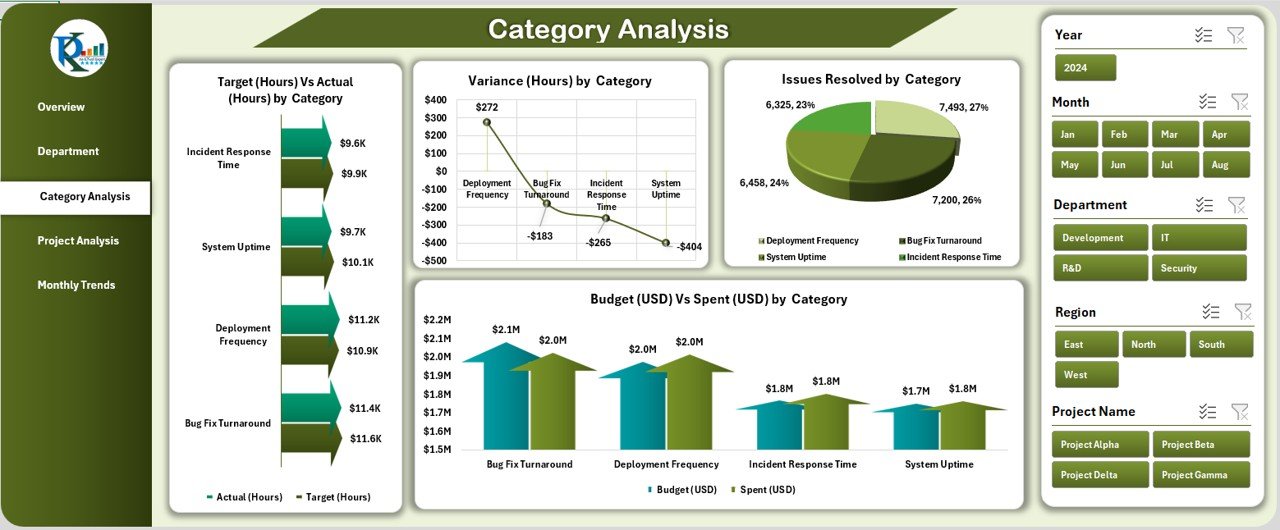
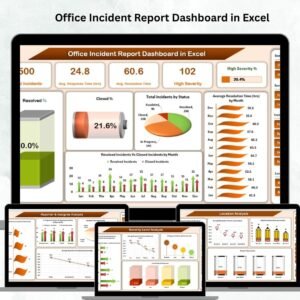
✅ Category Analysis
-
Break down performance by categories such as hardware, software, training, and support.
-
Monitor Budget vs Spend, Variance (Hours), and Issues Resolved by category.
-
Helps procurement and finance teams align budgets with utilization.
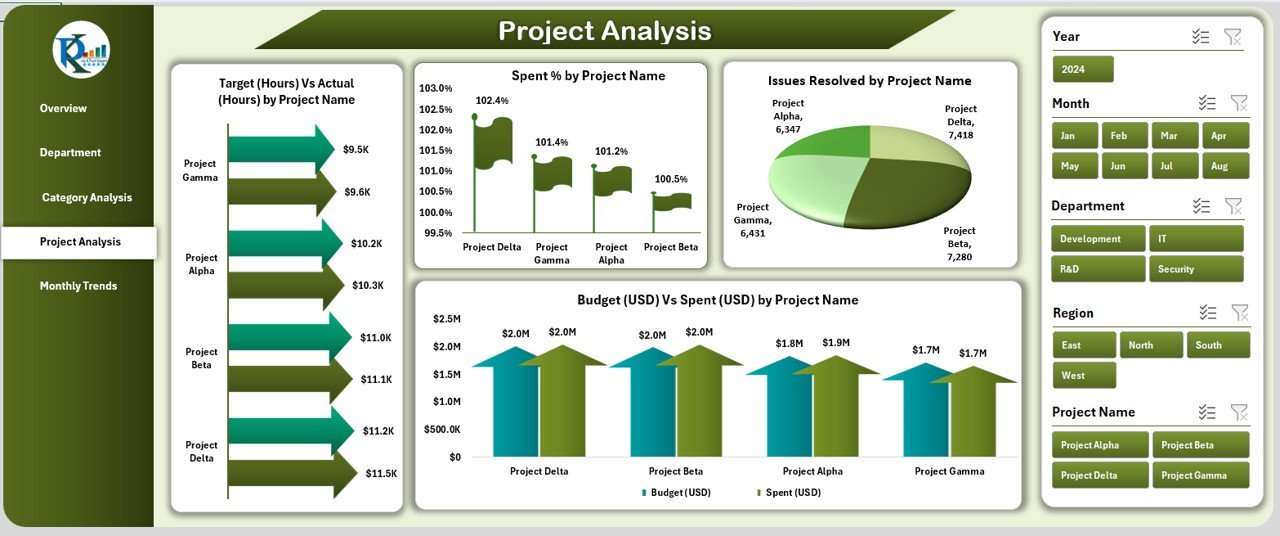
✅ Project Analysis
-
Evaluate performance at the project level.
-
Includes charts for Target vs Actual Hours, Issues Resolved, and Spend % by Project Name.
-
Prevents cost overruns and ensures projects stay on track.
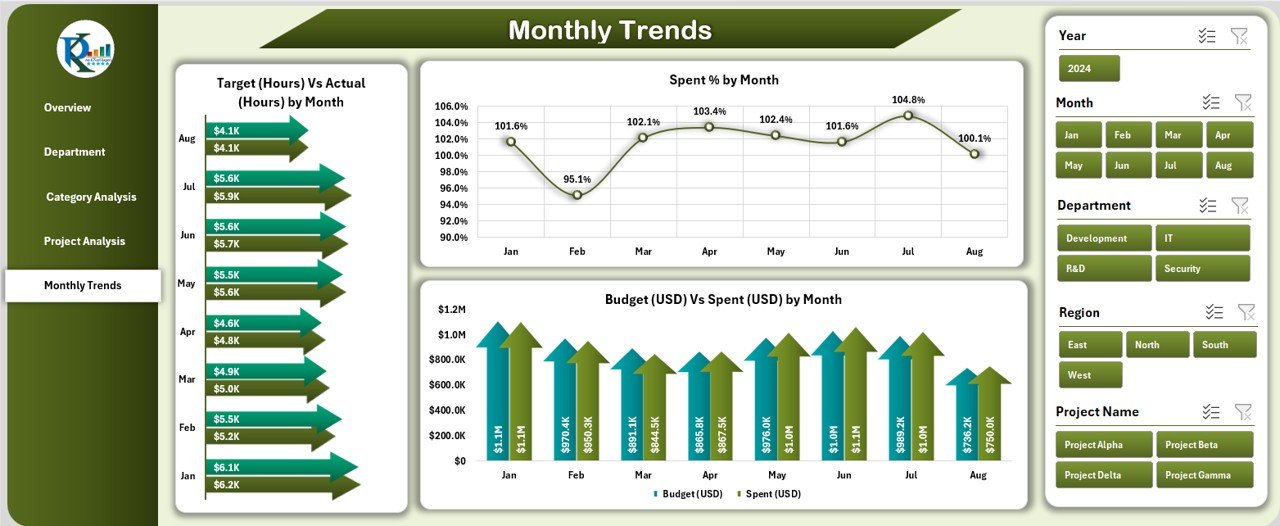
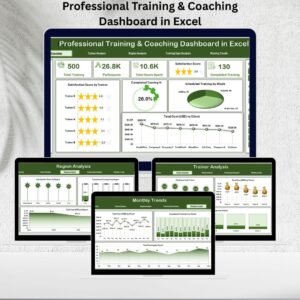
✅ Monthly Trends
-
Identify performance trends over time.
-
Charts for Budget vs Spend, Spend % by Month, and Target vs Actual Hours by Month.
-
Supports forecasting and long-term planning.
✅ Support Sheets
-
Data Sheet for raw inputs like budgets, hours, and issue logs.
-
Support Sheet with dropdowns and reference tables for smooth functionality.
🛠️ How It Works
-
Enter your raw data into the Data Sheet.
-
Update targets and baselines in the Target & Previous Year sheets.
-
Use slicers and dropdowns to filter data.
-
Analyze insights across Overview, Department, Category, Project, and Monthly Trend pages.
-
Share results with stakeholders for performance reviews.
👩💼 Who Can Benefit
-
CIOs & CTOs – Get a top-level view of IT budgets and performance.
-
IT Managers – Track issue resolution times and project delivery.
-
Finance Teams – Compare planned vs actual technology spend.
-
Project Managers – Monitor project hours and progress.
-
Executives – Access quick insights for strategic decision-making.
🚀 Advantages
-
Cost-Effective – Built in Excel, no extra software needed.
-
User-Friendly – Familiar spreadsheet environment.
-
Customizable – Add new KPIs, charts, or categories.
-
Performance Transparency – Provides a single source of truth.
-
Scalable – Adaptable for small, medium, and large organizations.
-
Decision Support – Delivers actionable insights for technology operations.
📈 Opportunities for Improvement
-
Automate updates using Power Query or VBA macros.
-
Integrate with ERP or ITSM systems for real-time data feeds.
-
Use Excel Online or SharePoint for collaborative access.
-
Enhance visuals with conditional formatting and color coding.
-
Add security with password-protected sheets for sensitive data.
✅ Best Practices
-
Define clear KPIs before setting up the dashboard.
-
Update data weekly or monthly for accurate analysis.
-
Use slicers and filters for quick drill-downs.
-
Standardize data entry to avoid inconsistencies.
-
Share across departments to encourage transparency.
-
Review monthly trends to identify recurring issues or seasonal patterns.
🏢 Real-World Use Cases
-
IT Department Performance Review – Present monthly results to management.
-
Budget Tracking – Compare actual spend vs planned allocations.
-
Project Oversight – Monitor hours, issues, and budget adherence.
-
Operations Management – Track resource utilization across regions.
-
Executive Reporting – Provide clear visuals for board meetings.
🔗 Click here to read the Detailed blog post
Visit our YouTube channel to learn step-by-step video tutorials


Reviews
There are no reviews yet.